
What the Chaos Means for Your Portfolio in 2026
The war sent oil prices surging, rattled global markets, and pushed inflation forecasts up and GDP down. Here's a clear breakdown of what happened, where things stand, and how to navigate the year.

Coming into 2026, the consensus on Wall Street was unusually optimistic. Inflation had largely normalized. The Federal Reserve was expected to cut rates. AI investment was accelerating. All strategists surveyed by major financial institutions forecast gains for the S&P 500, with an average return target of 12%. It was shaping up to be a straightforward, if unspectacular, year for investors.
Then, on February 28, the United States and Israel launched joint air strikes on Iran. Within days, the Strait of Hormuz was effectively closed. What followed was a cascading shock to energy markets, inflation forecasts, and global equities that no year-end outlook had anticipated.
Here is a clear, data-grounded account of what happened, what it means for your portfolio, and how to think about the months ahead.
How 2026 Was Supposed to Play Out
The setup coming into this year was, by most measures, constructive. The post-COVID inflation surge had finally been brought to heel. The Fed had been cutting rates. Corporate earnings were healthy. And the emergence of AI as a genuine economic driver was fueling optimism about productivity and growth.
Markets entered the year at or near all-time highs. Consumer sentiment was rising. Gas was under $3 a gallon. The word on every investor’s lips was “soft landing.” Then February happened.
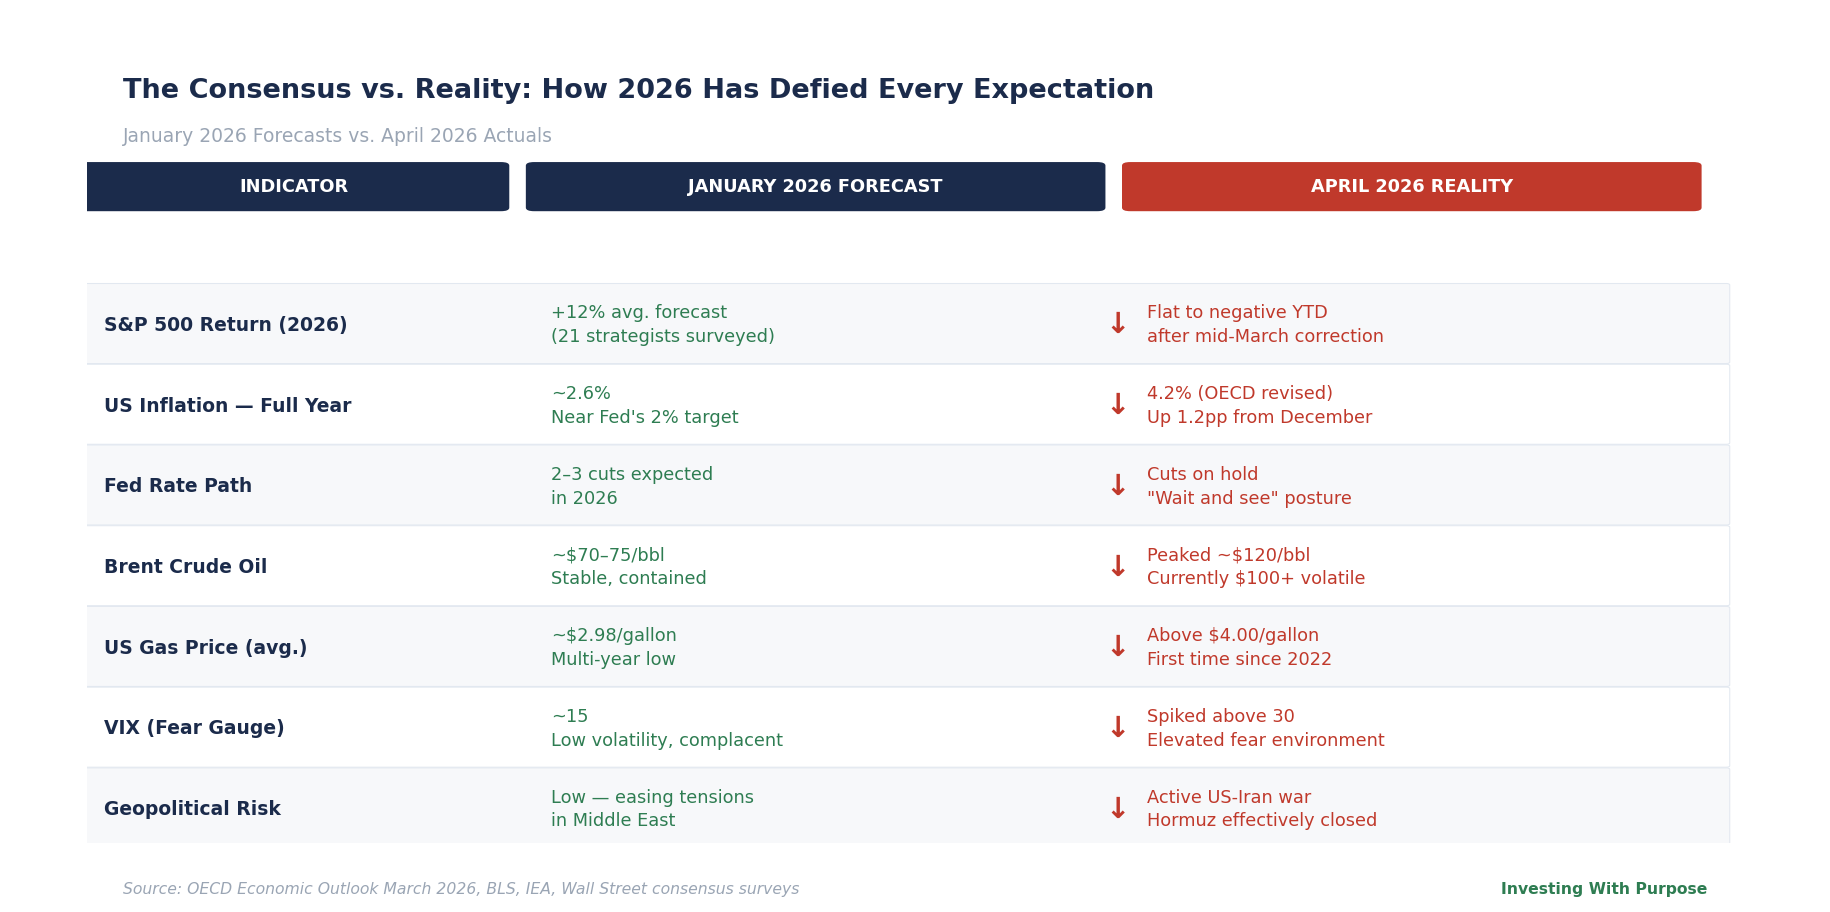
Brent crude, which had been trading around $72 a barrel on February 27 surged past $120 within two weeks. WTI 0.00%↑, the U.S. benchmark, followed. National average gasoline prices crossed $4 a gallon for the first time since 2022. In California, they breached $5.
The IEA described the situation as the greatest global energy security challenge in history. The agency coordinated an emergency release of 400 million barrels from strategic reserves worldwide (the largest on record) to buffer the supply shock. Analysts warned, however, that this could only absorb roughly 20 days of a full Hormuz blockade. The clock was ticking.
How Markets Reacted, and Why It Wasn’t a Straight Line Down
The stock market’s response to the war was volatile, sector-dependent, and driven as much by diplomatic headlines as by expectations on fundamentals. This is the kind of environment that punishes reactive investors and rewards those with a plan.
By mid-March, the Nasdaq had fallen into correction territory, down more than 10% from its recent high. The Dow quickly followed. The S&P 500 too. Technology stocks, already stretched on valuation, bore the brunt. Industrials and consumer discretionary followed. Energy was a completely different story: the USO 0.00%↑ oil ETF surged more than 55% in March alone, its largest monthly gain on record.
But the market didn’t fall in a straight line. Every Trump post on Truth Social about a potential ceasefire sent equities surging and oil tumbling. Sometimes by double digits within hours. Every sign of escalation reversed the trade. On March 31, the S&P 500 staged its biggest single-day rally since May, gaining 2.9%, on reports that Iran’s president was open to ending the war. This kind of headline-driven whiplash is not a new phenomenon, but it is particularly dangerous for investors who try to time it.
The Inflation Problem: Why It Goes Beyond Gas Prices
Before the war, the inflation picture had been encouraging. The CPI rose just 2.4% over the 12 months ending February 2026, close to the Fed’s 2% target, with shelter as the primary remaining pressure. That picture changed almost overnight.
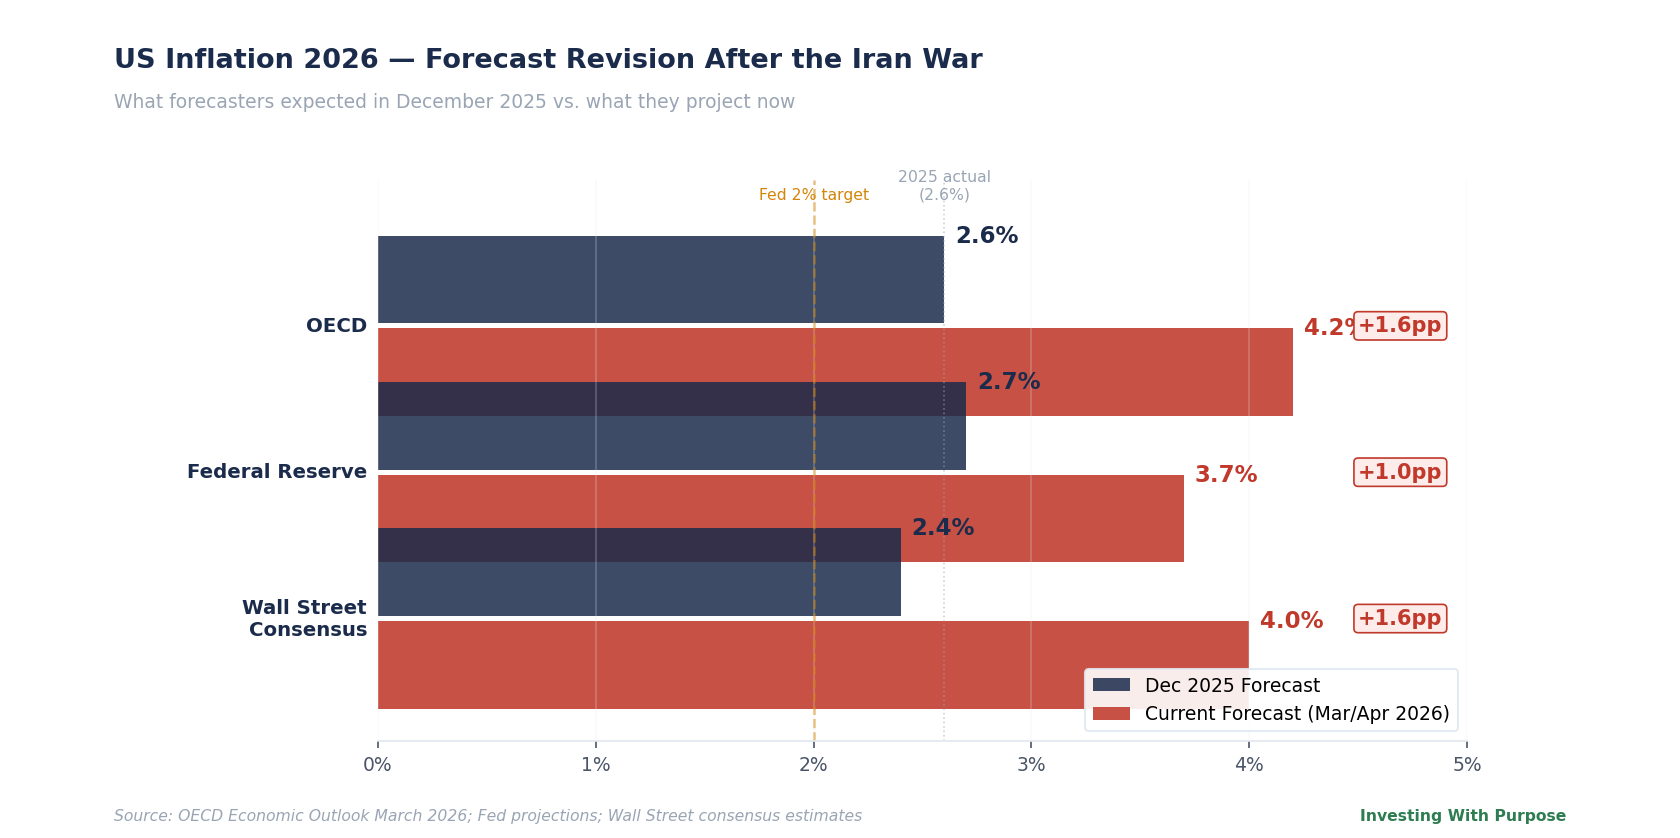
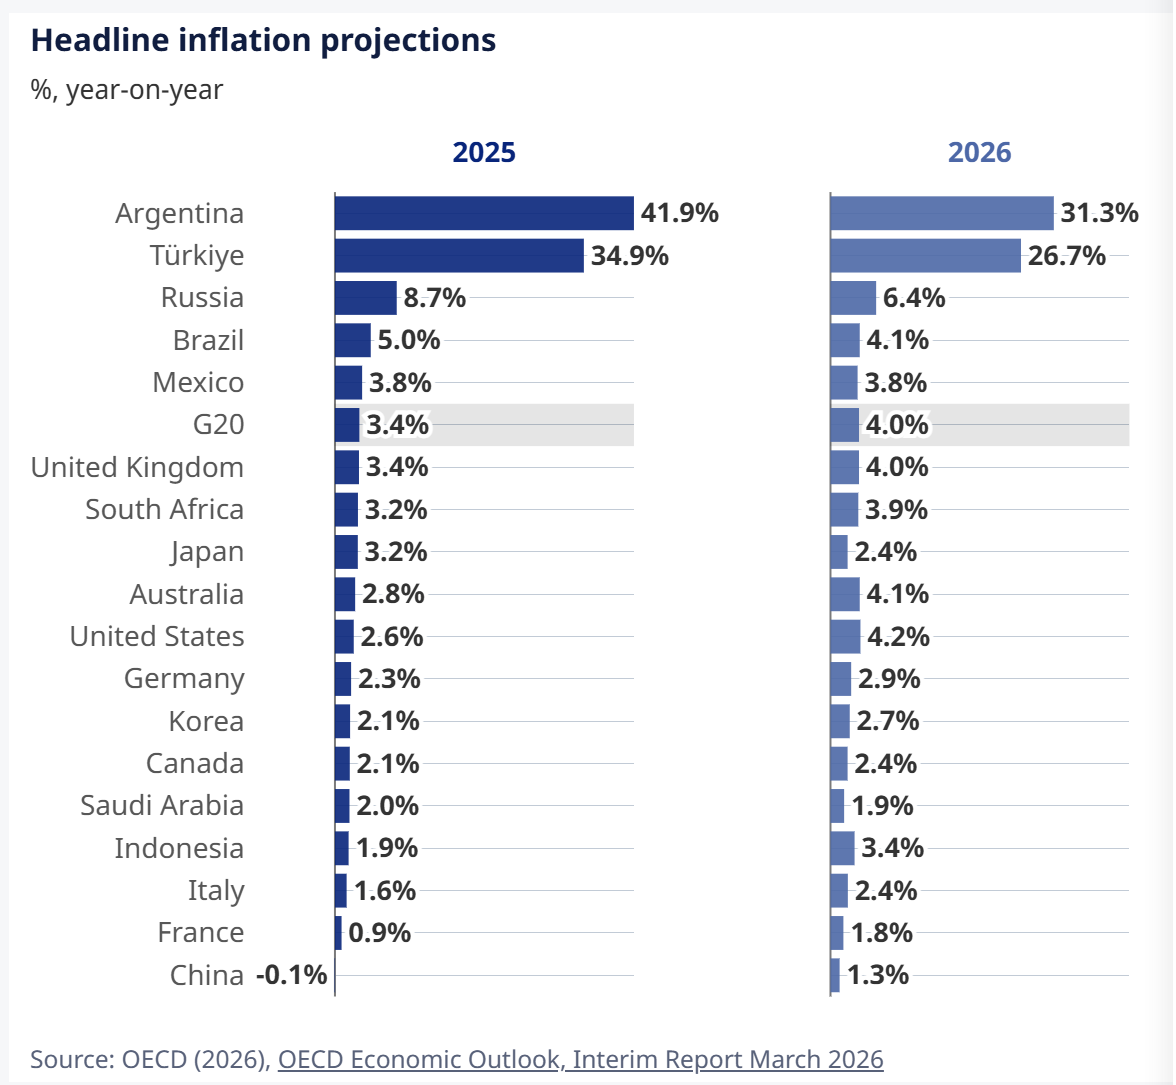
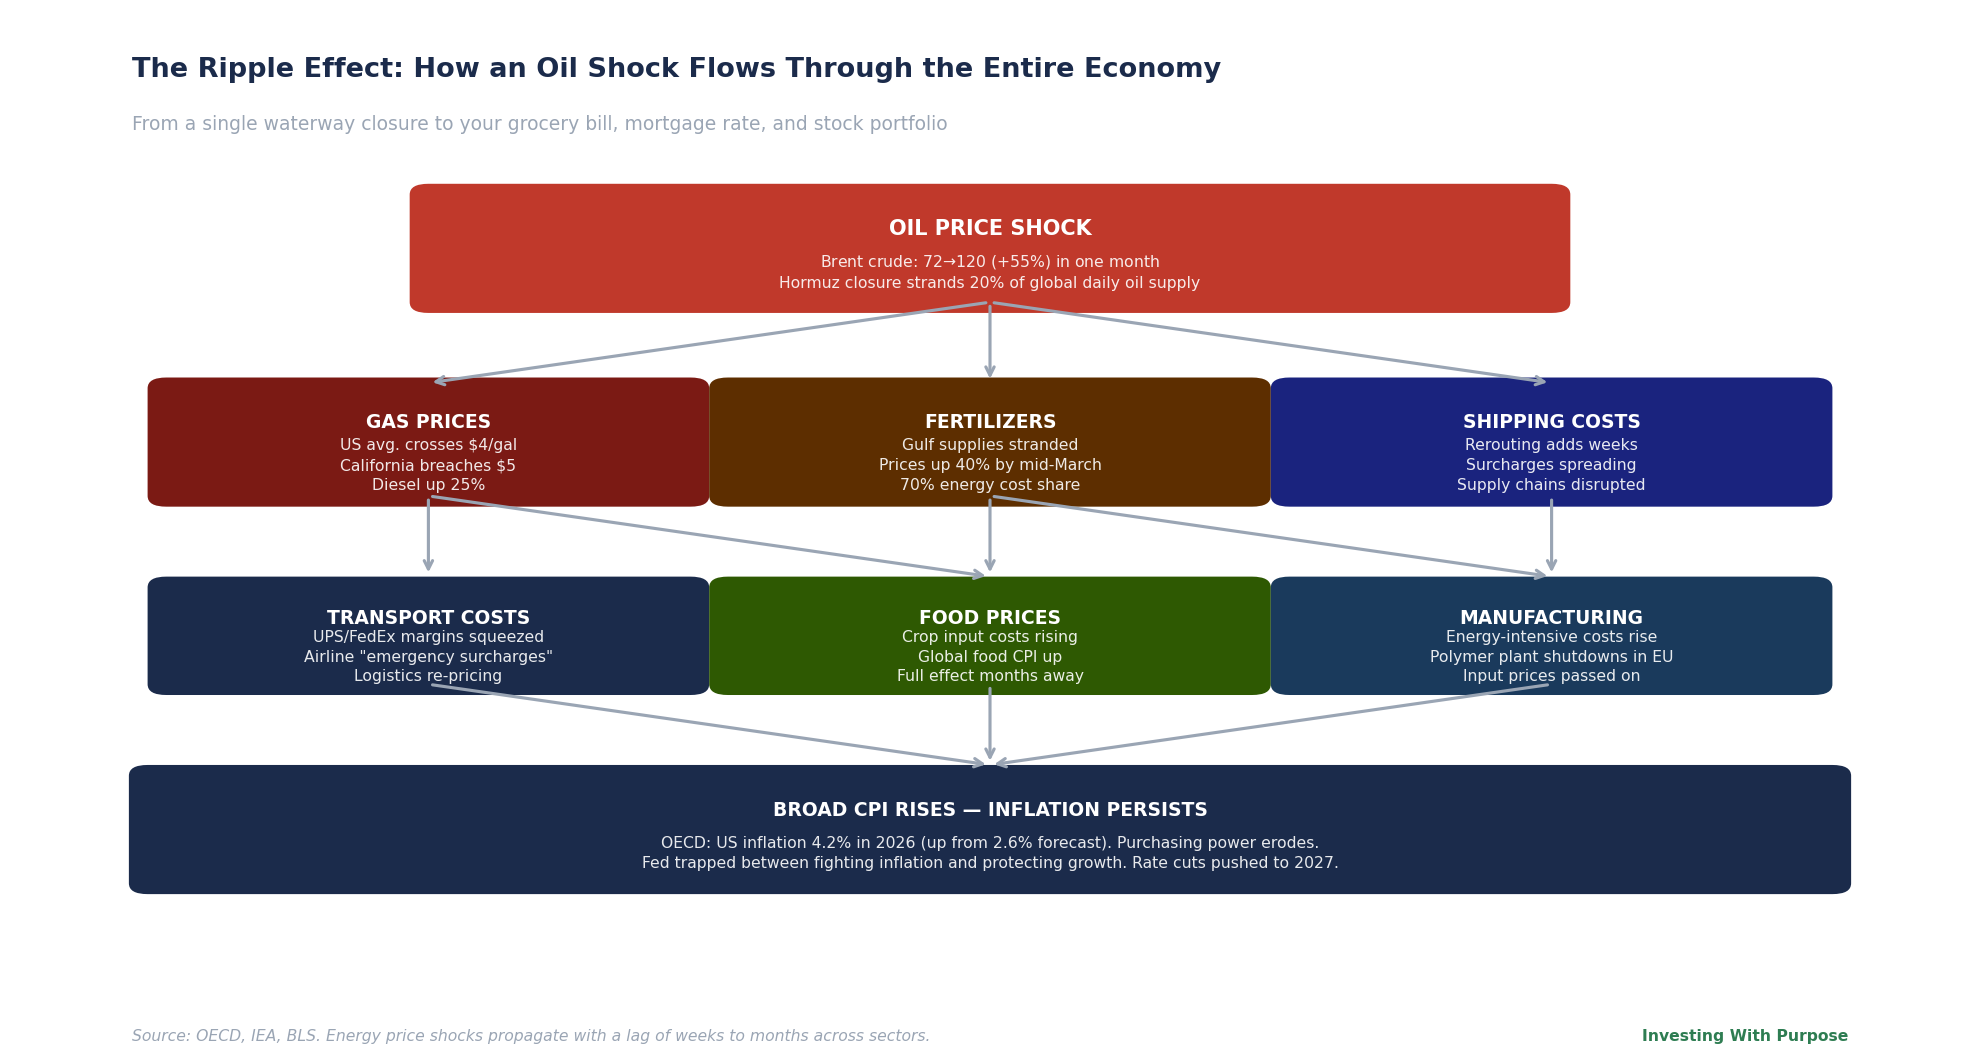
The OECD revised its U.S. inflation forecast for 2026 from 2.6% to 4.2%, a 1.2% jump that represents not just higher gas prices, but a systemic repricing across the entire economy. Energy costs touch virtually every sector: transportation, food production, manufacturing, construction. When oil moves 55% in a month, the ripple effects take weeks and months to fully propagate, and investors haven’t seen most of them yet.
Fertilizer prices rose up to 40% from the beginning of the conflict through mid-March, a consequence of disrupted ammonia and urea supplies that flow through the Gulf. Brazil, which produces nearly 60% of global soybeans and is almost entirely dependent on imported fertilizers, is already reducing crop estimates. Food prices have not yet peaked.
The Federal Reserve’s response has been deliberate restraint. Fed Chair Jerome Powell said in late March that policy is “in a good place” to wait and see, noting that raising rates to fight an oil-driven inflation spike risks weighing on the economy precisely when the supply shock passes. It’s a reasonable position but it leaves inflation running hot in the near term with limited policy response.
Where Things Stand as of April 2026
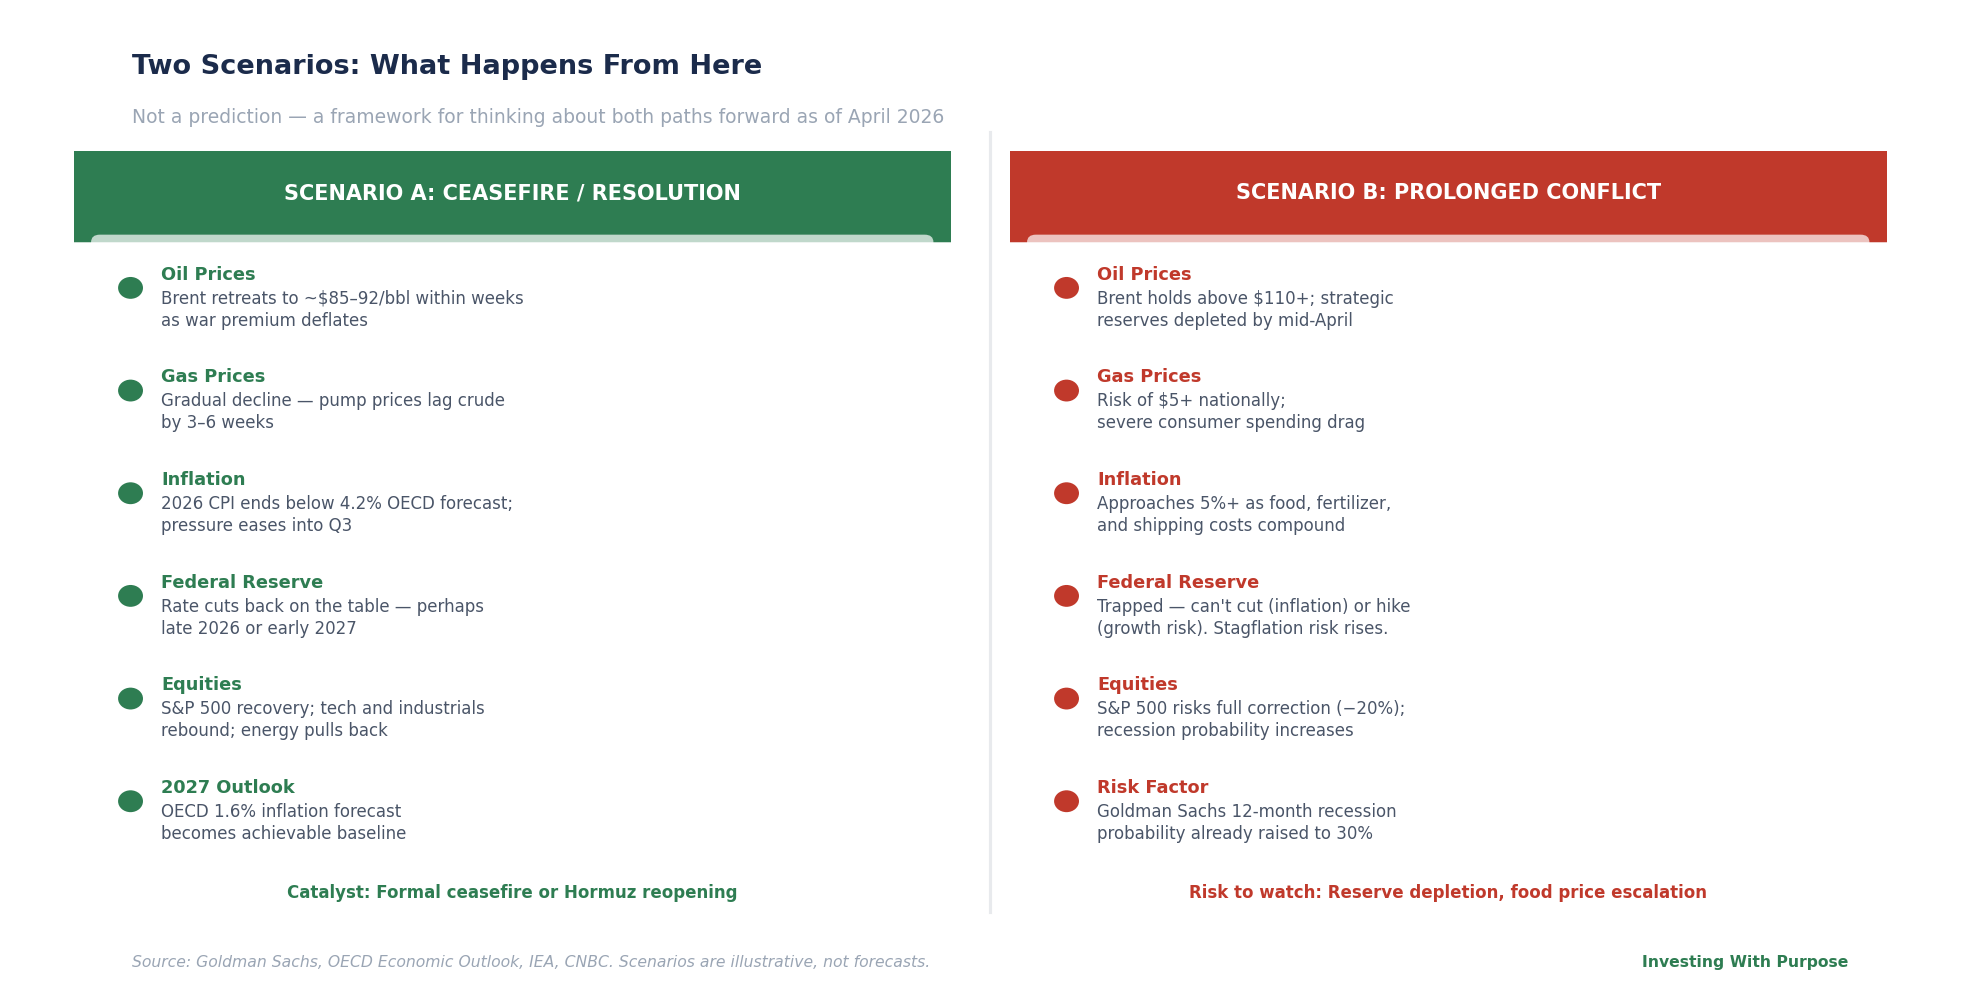
Oil prices remain volatile and almost entirely headline-driven. Brent has pulled back from its $120 peak but continues to trade well above $100, a level that, sustained for any length of time, keeps inflation well above the Fed’s target. The strategic reserve release that buffered initial supply shocks is running thin. Analysts warn that if the Hormuz closure persists into mid-April, there may be little governments can do to prevent a fresh leg higher in energy prices.
The diplomatic picture is fluid. There are credible signals from both sides that a resolution is possible: Iran has signaled openness to talks, Trump has said U.S. forces will leave “whether we have a deal or not.”
What This Actually Means for Your Portfolio
The right response to a market environment like this one is not panic, nor is it complacency. It is a systematic review of where you are exposed, where you may be protected, and whether your current allocation reflects your actual time horizon and risk tolerance.
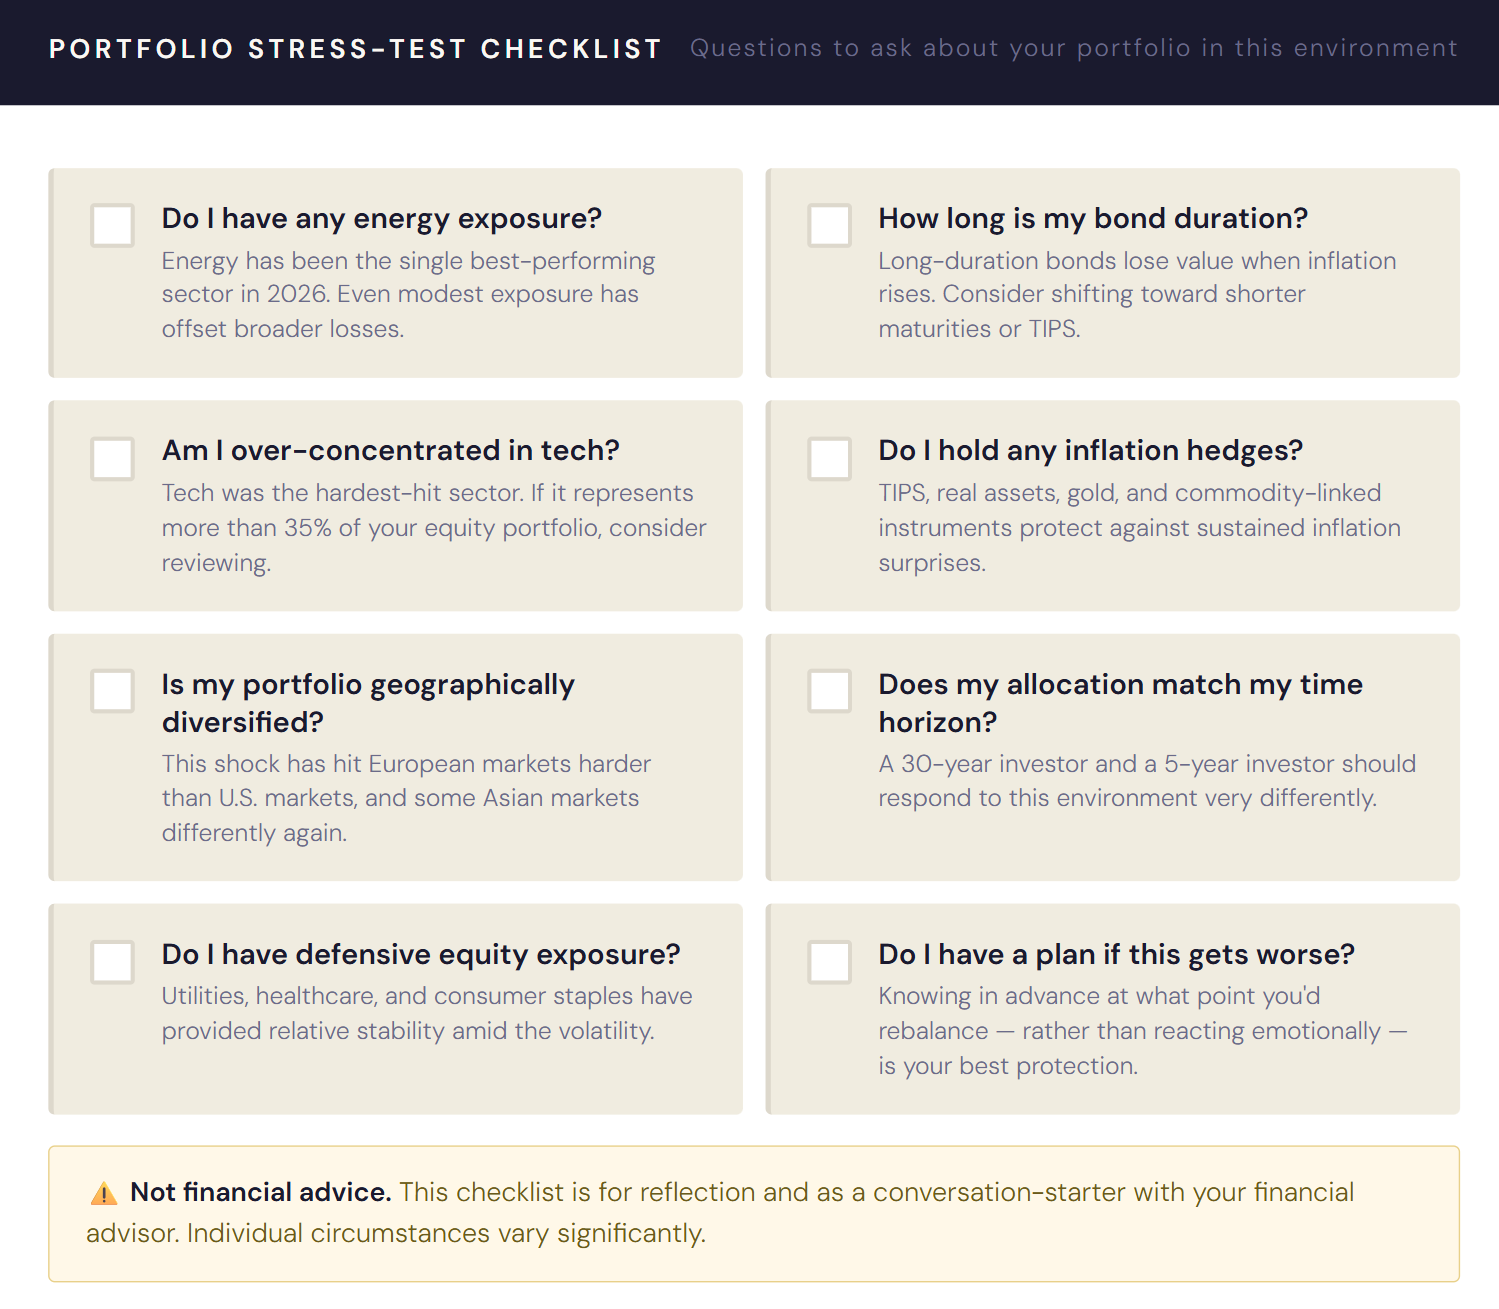
Here are the key questions to work through:
Equities
Sector positioning matters more than it has in years. If you’re concentrated in technology and industrials, you’ve felt the pain. If you have any energy exposure, you’ve likely seen it offset losses elsewhere. The late-March rally was real but it was driven almost entirely by ceasefire hopes, not by fundamental improvements in earnings or economic outlook. Don’t chase it without understanding what drove it.
Defensives like utilities, healthcare, and consumer staples have held up relatively well and remain worth considering as a stabilizing component of equity allocation in an uncertain macro environment.
Bonds
Duration risk is real when inflation is running hot and the Fed’s next move is uncertain. Longer-dated Treasuries get hurt when inflation expectations rise. Short-to-medium duration bonds, or TIPS (Treasury Inflation-Protected Securities), offer more protection in an environment where inflation could surprise to the upside for several more months.
Real Assets & Alternatives
Gold has risen as a safe haven. Real assets broadly (including infrastructure, commodities, and real estate) tend to hold value better during inflationary periods than nominal bonds. If you don’t have any inflation hedging in your portfolio, this environment is a prompt to reconsider that.
Cash
Holding some cash in a high-volatility environment is not necessarily a defensive mistake. It is optionality. If either scenario above plays out in an extreme way, cash gives you the ability to act. High-yield savings accounts and money market funds are still yielding meaningfully above zero.
International Diversification
The war’s effects are not evenly distributed globally. Europe has been particularly hard hit, heavily dependent on Middle Eastern LNG. Some markets are better insulated. Geographic diversification matters more in a geopolitical shock than in a typical economic cycle.
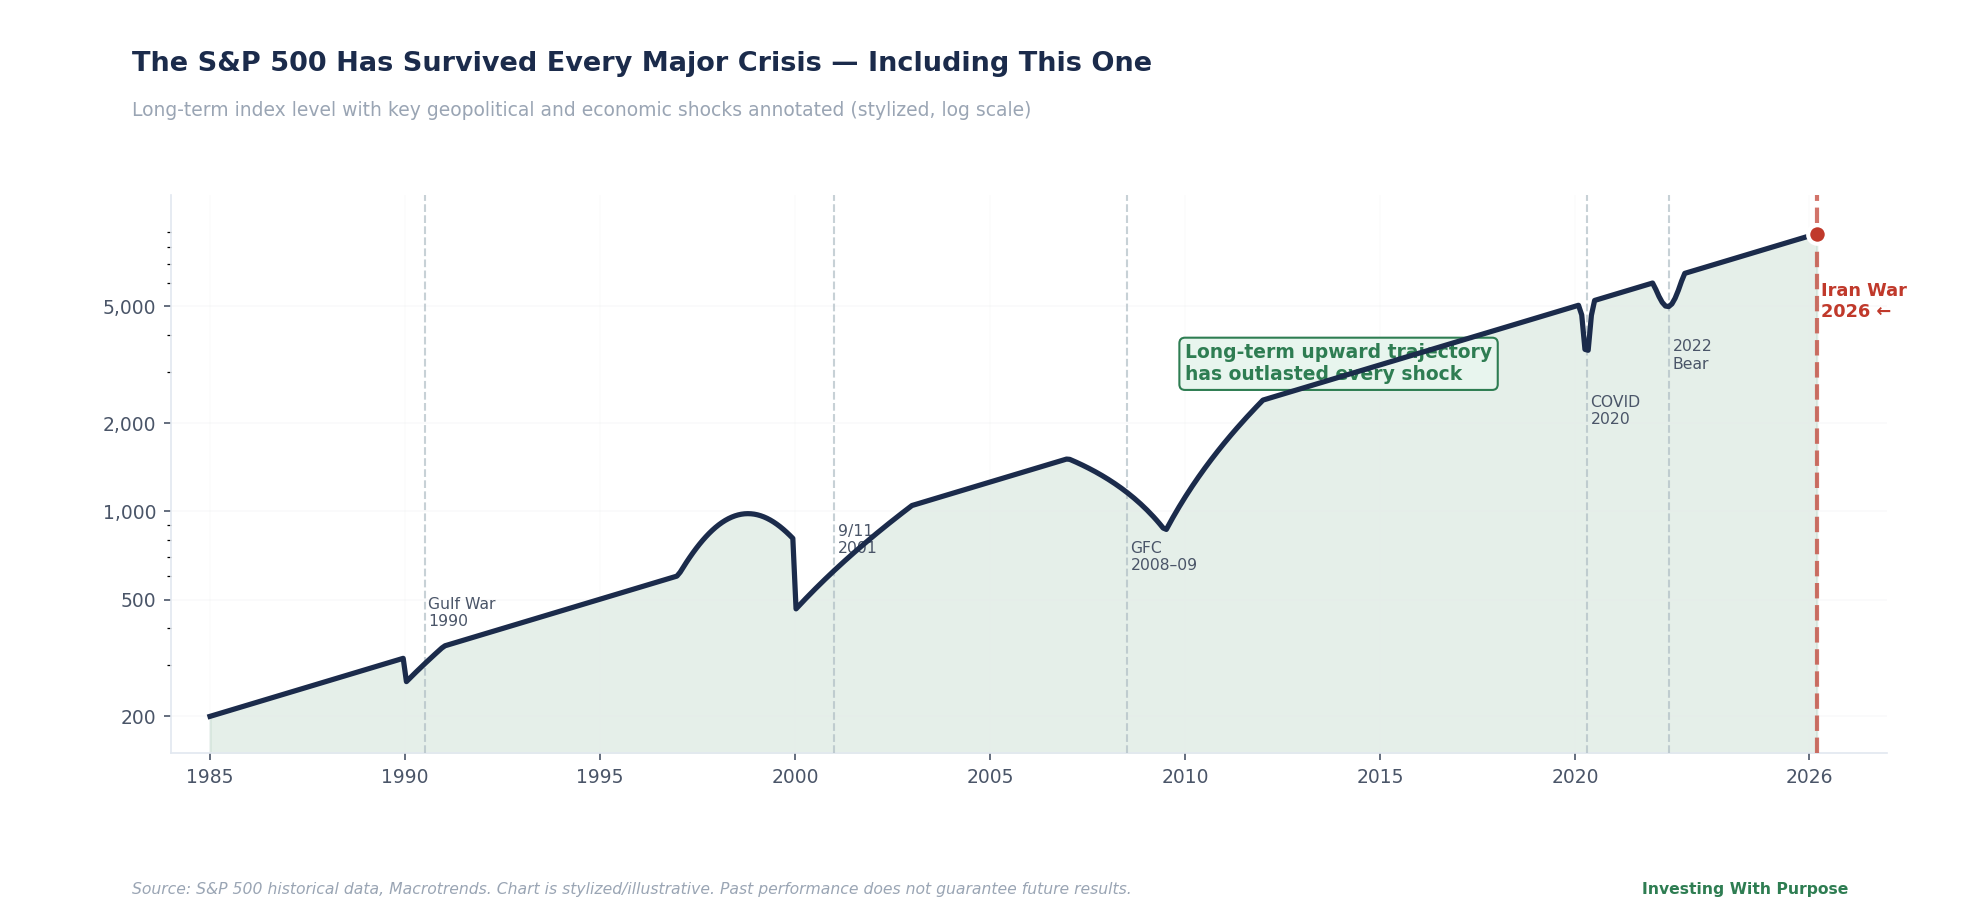
Long-Term Investors Have Seen This Before
Every major geopolitical shock feels, in the moment, like a permanent structural break. The 1973 oil embargo felt that way. So did the Gulf War. So did 9/11. So did the 2008 financial crisis, and the COVID crash of March 2020. In each case, the market eventually recovered, and investors who stayed invested, rebalanced into the fear, or simply did nothing came out ahead of those who fled.
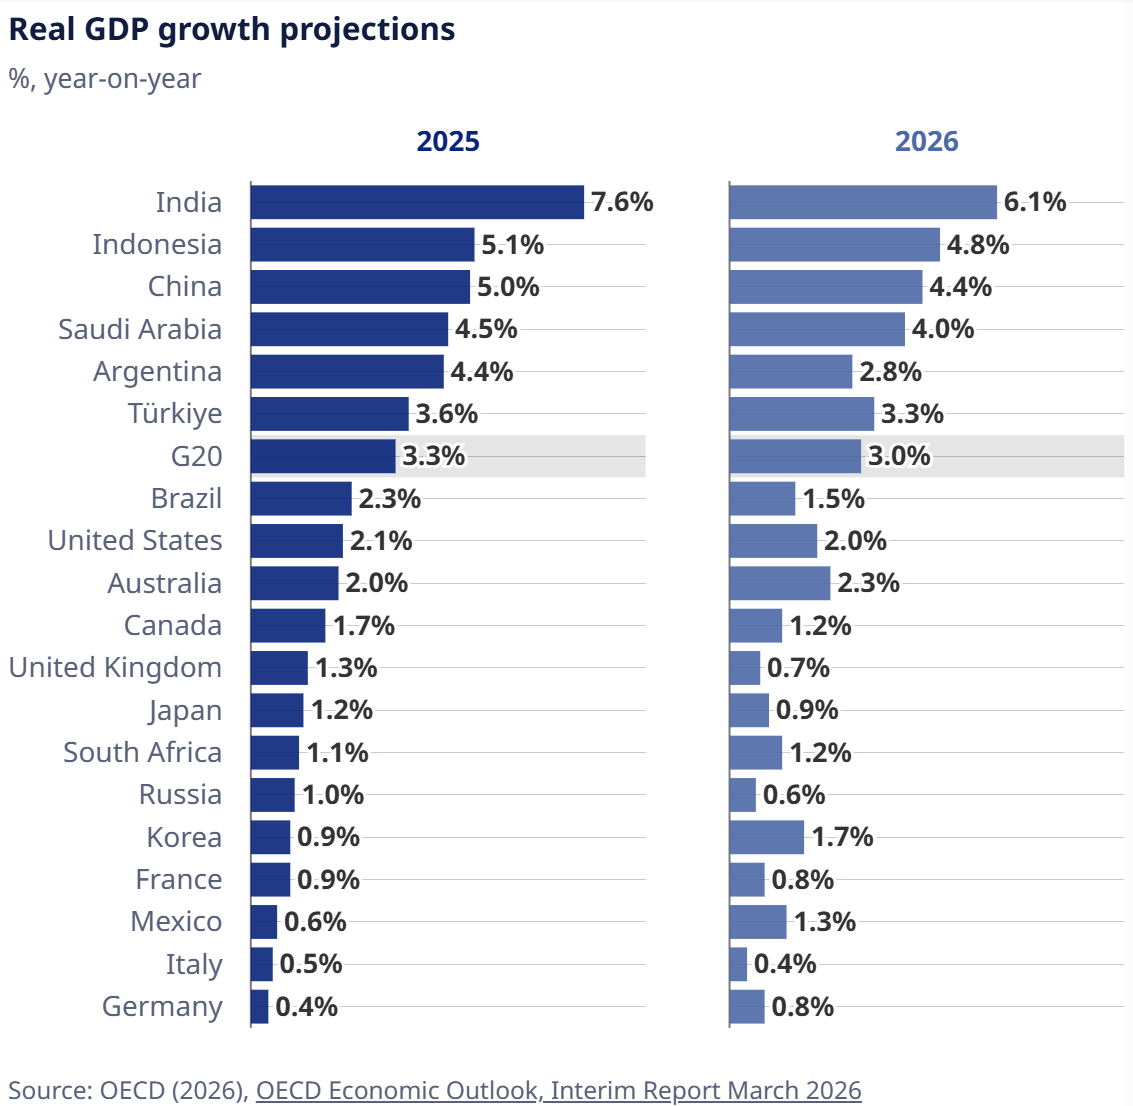
That is not a guarantee of what happens next. History doesn’t repeat perfectly. But it does offer perspective on the kind of shock we’re experiencing. The IEA has released emergency reserves. The Fed has signaled restraint. Diplomatic channels are open. The OECD, even in its revised, downbeat forecast, still projects U.S. growth at 2% in 2026 and sees inflation falling back to 1.6% in 2027.
This is not 2008. There is no systemic financial contagion. Corporate balance sheets are generally healthy. The labor market, while showing some cracks, has not collapsed. The disruption is real, material, and not over - but it has a shape, and that shape suggests a time horizon measured in quarters, not years.
The most important thing you can do right now is not find the perfect trade. It’s make sure your portfolio reflects your actual goals, your real time horizon, and a considered view of risk, not the anxiety of the moment.
If you don’t have that framework, now is the time to build one. Not because the market is going to crash, and not because it’s going to recover tomorrow. But because the next shock, whatever shape it takes, will come. And the investors who navigate it best are the ones who were ready before it arrived.
This article is for informational and educational purposes only and does not constitute financial advice, investment advice, or a recommendation to buy or sell any security. All data referenced is sourced from publicly available reports including OECD Economic Outlook March 2026, IEA Oil Market Report March 2026, U.S. Bureau of Labor Statistics, and major financial news outlets. Market conditions may have changed since the date of publication. Please consult a qualified financial advisor before making investment decisions. Investing involves risk, including the possible loss of principal.