
37% Off. Is Palo Alto Networks Finally Worth Buying?
The business is intact. The chart is damaged. Here is how to think about both.

Most selloffs in quality companies are opportunities in disguise. This one might be. But not yet.
Palo Alto Networks has spent years building one of the most durable businesses in cybersecurity. Sticky recurring revenue. Expanding cash flows. A platform strategy that locks customers in by solving more of their problems over time. The stock rewarded that story generously.
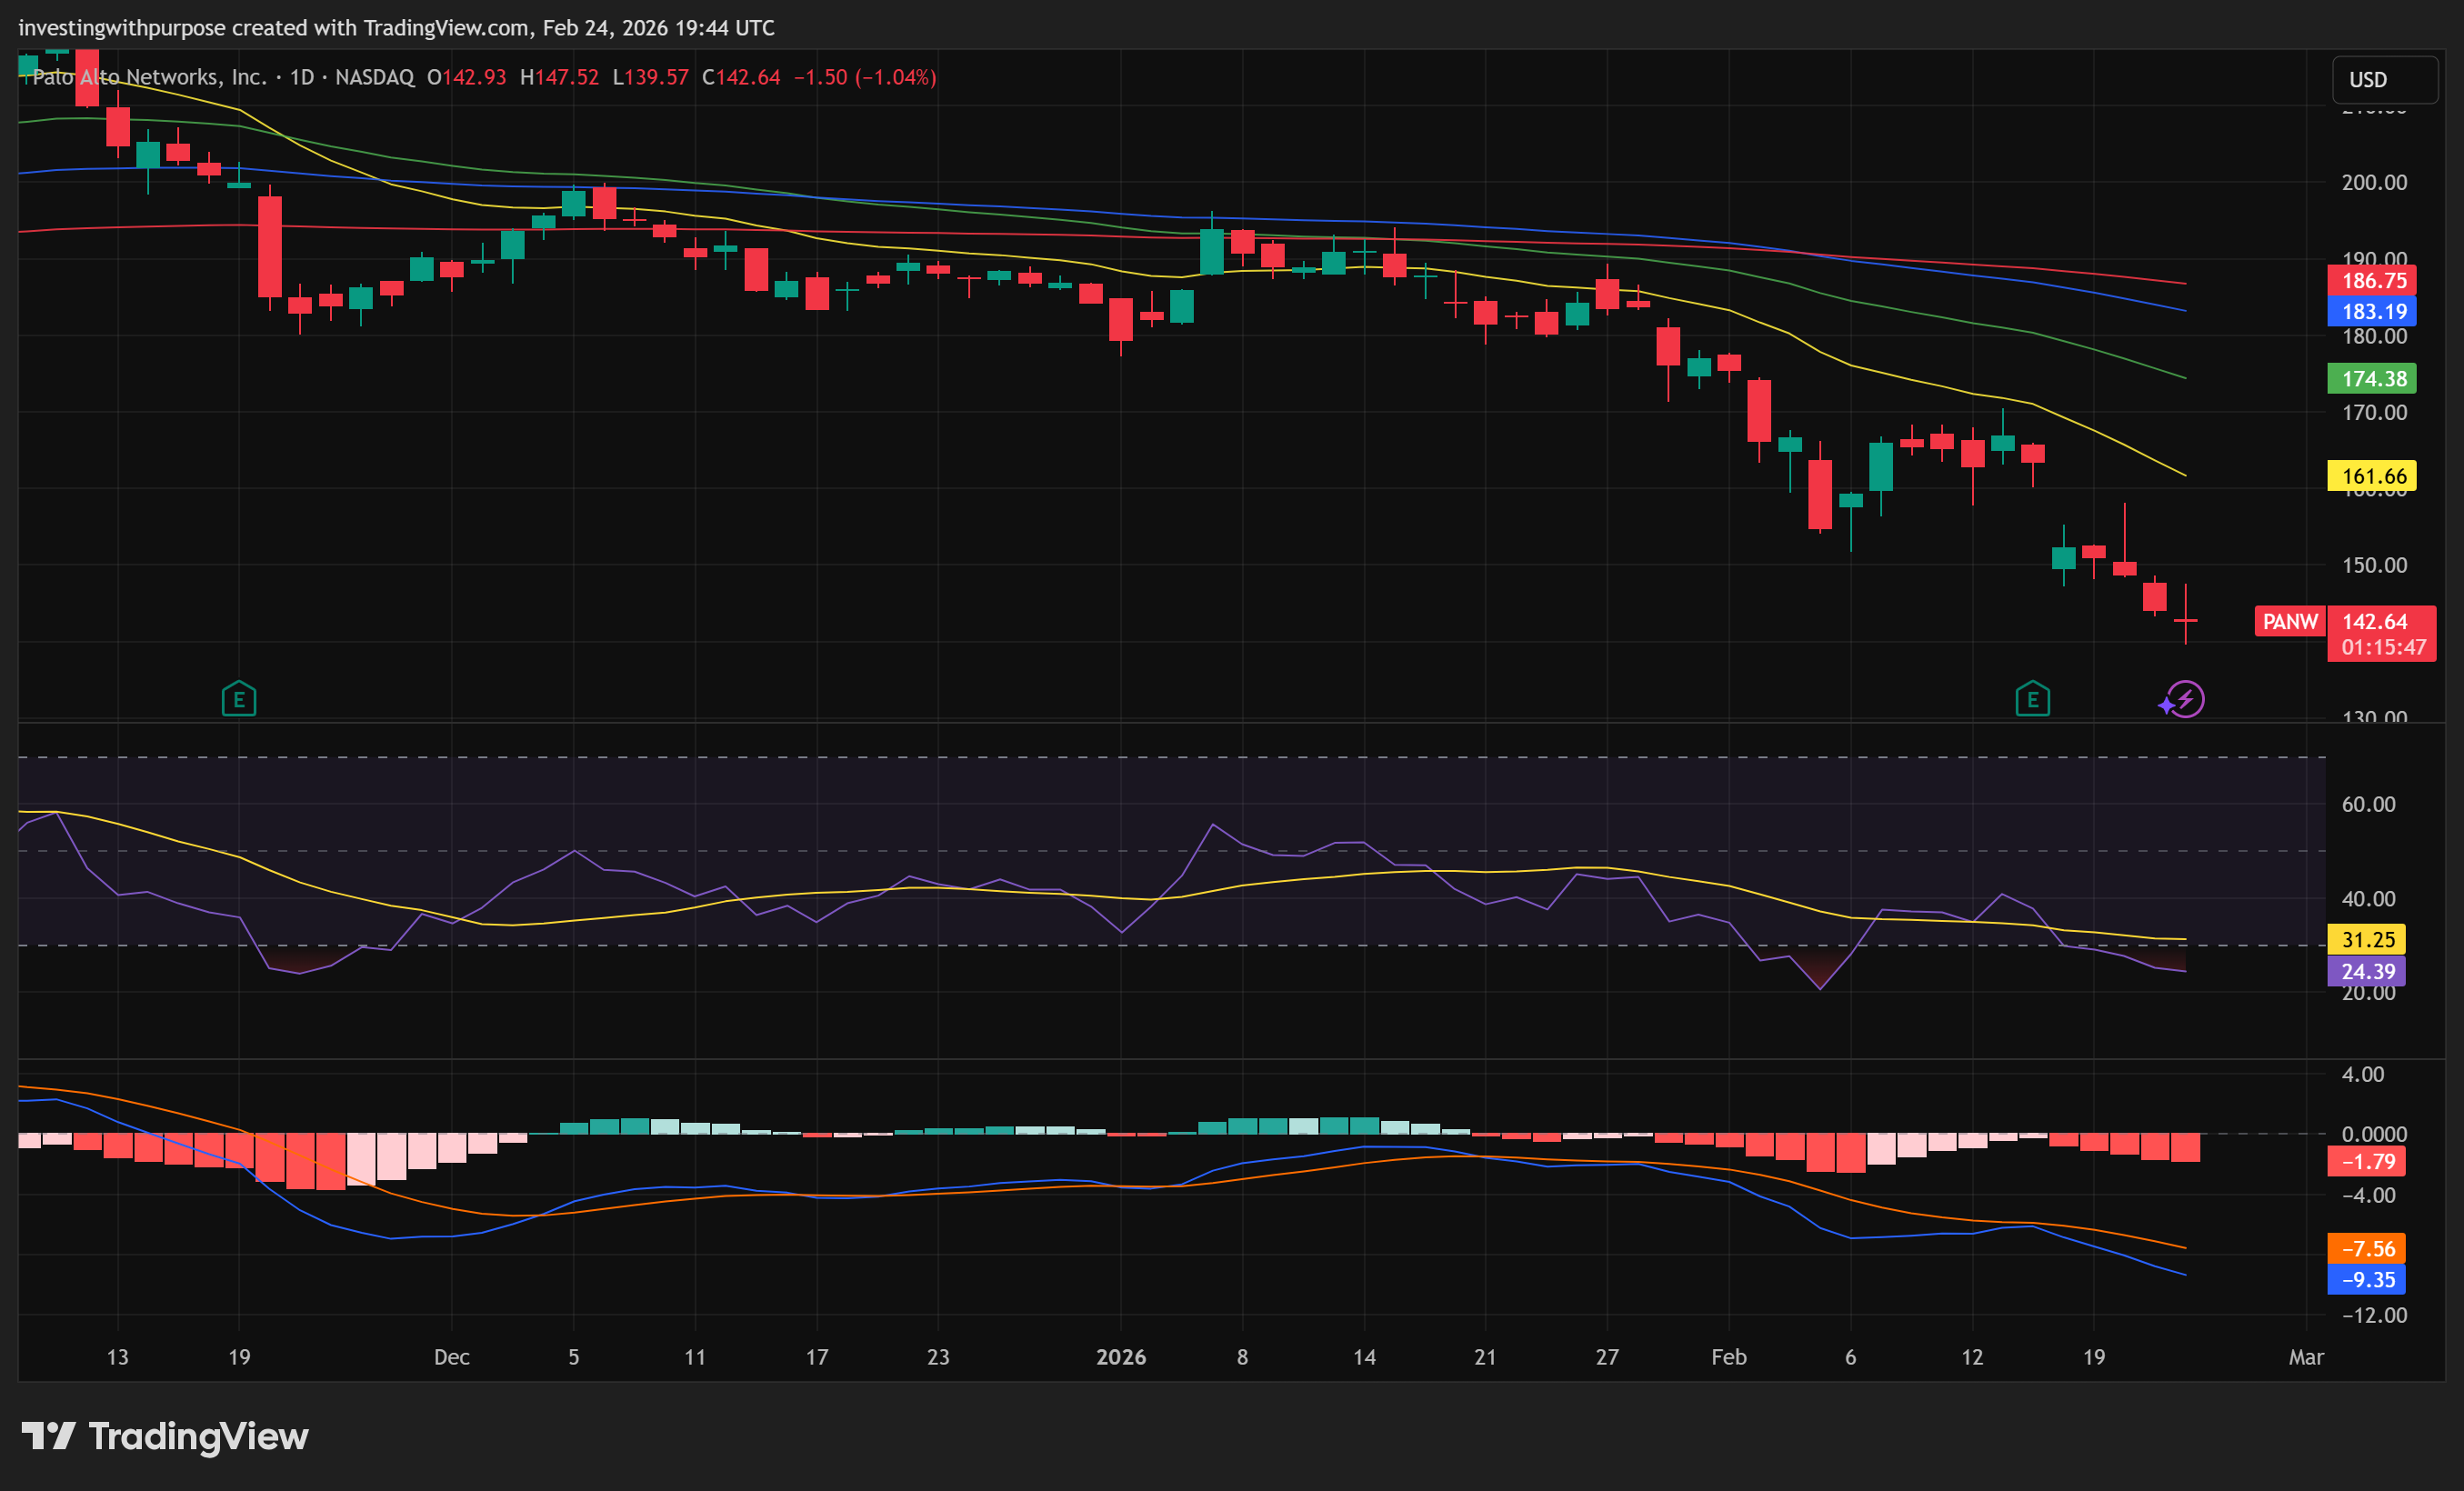
Then February earnings hit, and the stock gapped down 7% overnight and has not stopped falling since. At $142, PANW sits 37% below its 52-week high. That kind of decline in a quality company is rarely pure noise, but it is rarely the end of the story either.
Here is the honest take: the business did not break. The chart did. And right now, the chart is the one setting the terms.

Key Takeaways
The short version, for those who read the bottom line first.
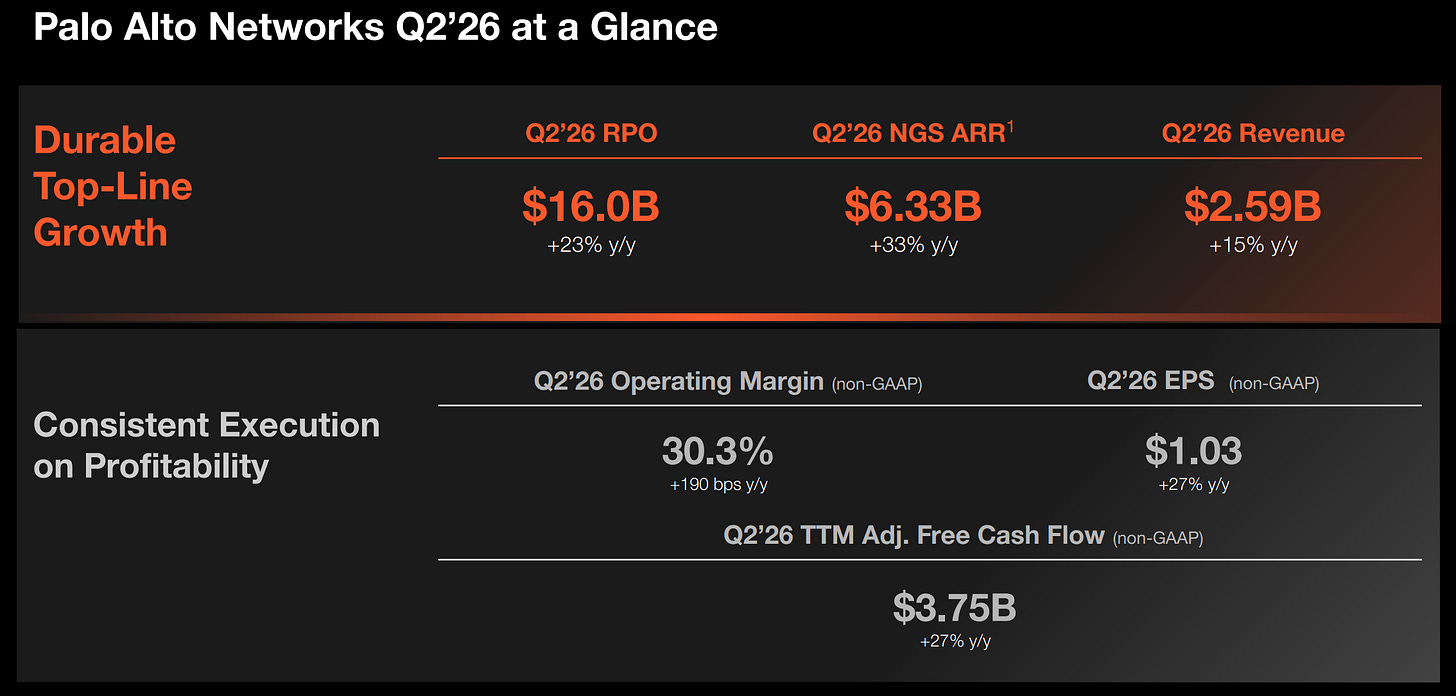
Revenue is growing near 15% year over year. Contracted future revenue sits near $16 billion, or roughly 18 months of forward visibility.
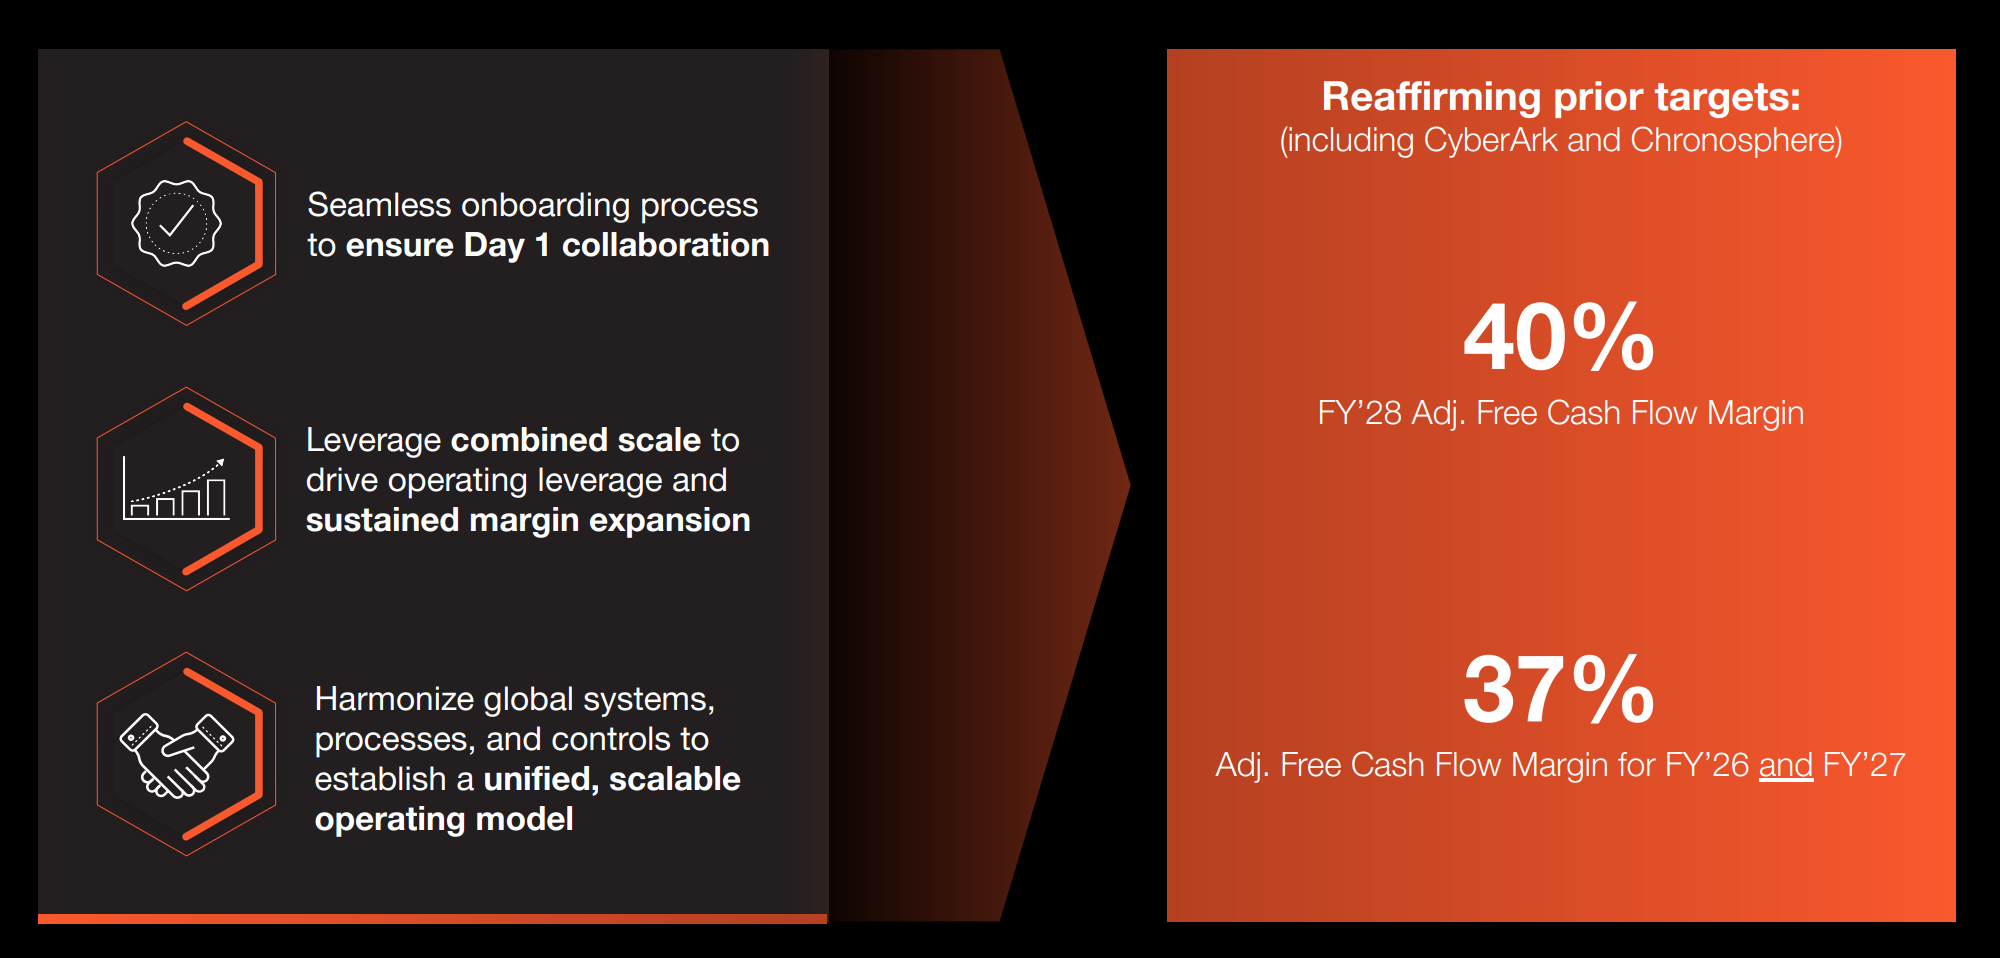
Free cash flow runs near $3.5 billion annually at a 36% to 37% margin. That guidance was not cut at earnings, only profit per share was.
The earnings reset was about acquisition costs, not demand. Two large deals closed simultaneously, front-loading amortization and dilution.
Stock-based compensation is real dilution at roughly $1.2 billion annually, but it has been declining as a share of revenue and that trend matters.
The stock broke major support near $165 before earnings. The gap down accelerated a move already in progress.
$139 to $142 is the current support zone. Below $139, the next meaningful level is $129, and below that the thesis changes.
No technical reversal has been confirmed. Patience is not pessimism here. It is risk management.
The Business, the Backlog, and What Earnings Actually Changed
This is a cost story dressed up as a growth scare.
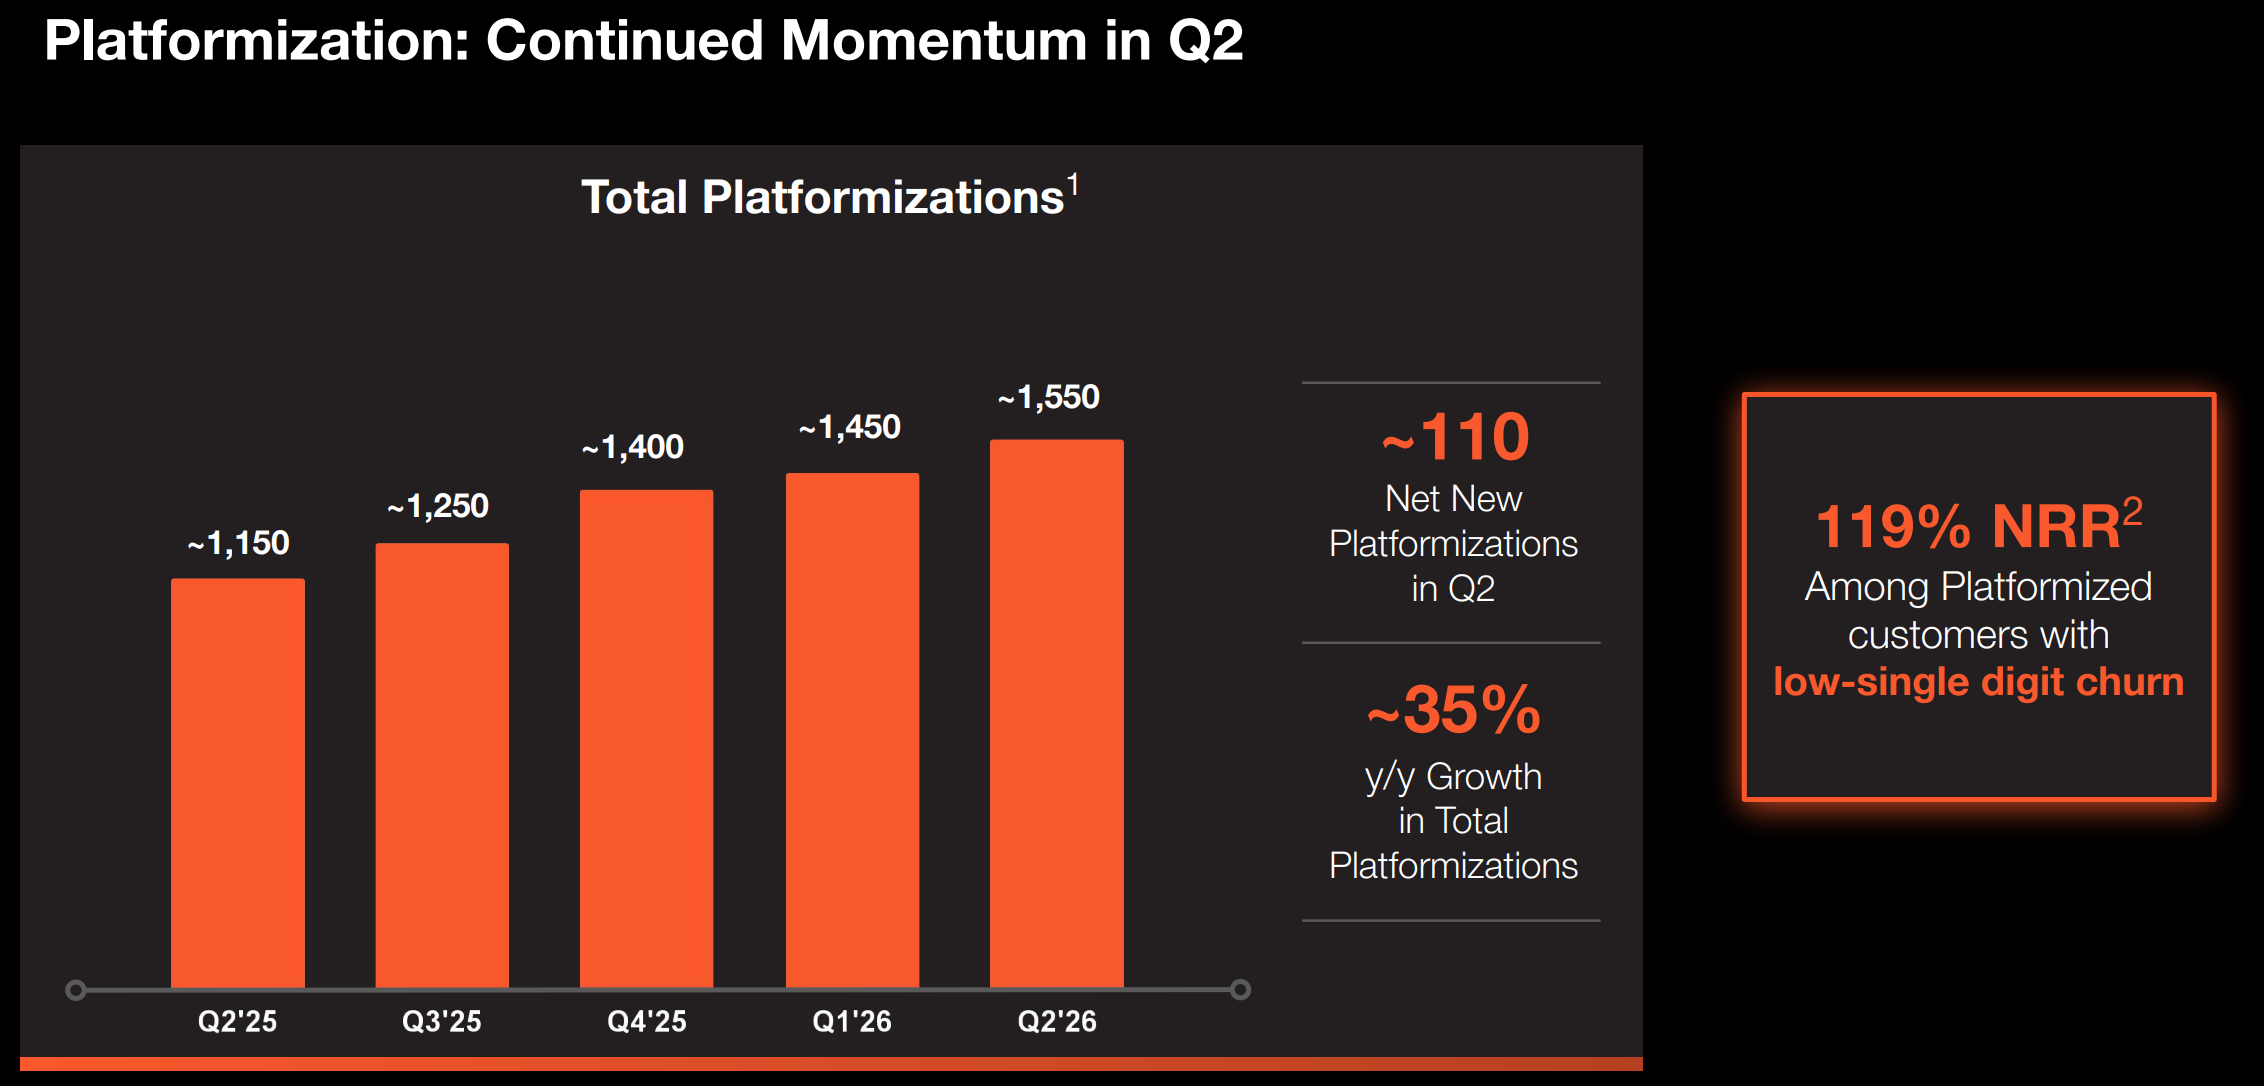
Palo Alto’s model is built around platform consolidation. Customers who adopt multiple products spend 3 to 5 times more than single-product customers and churn far less. That dynamic is compounding quietly in the background, and the numbers reflect it.
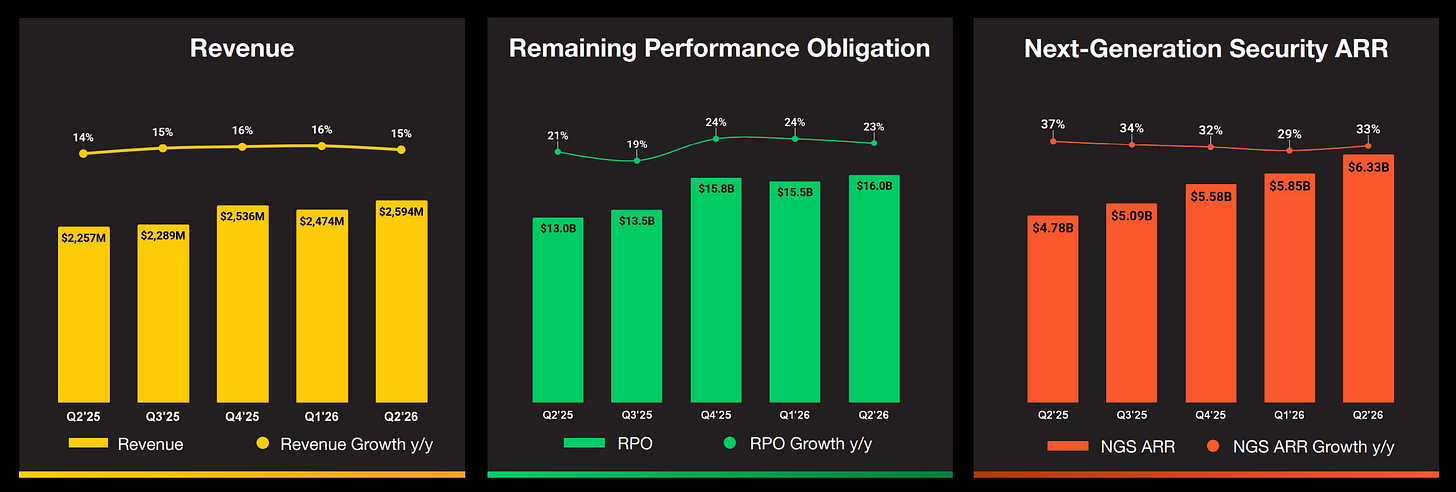
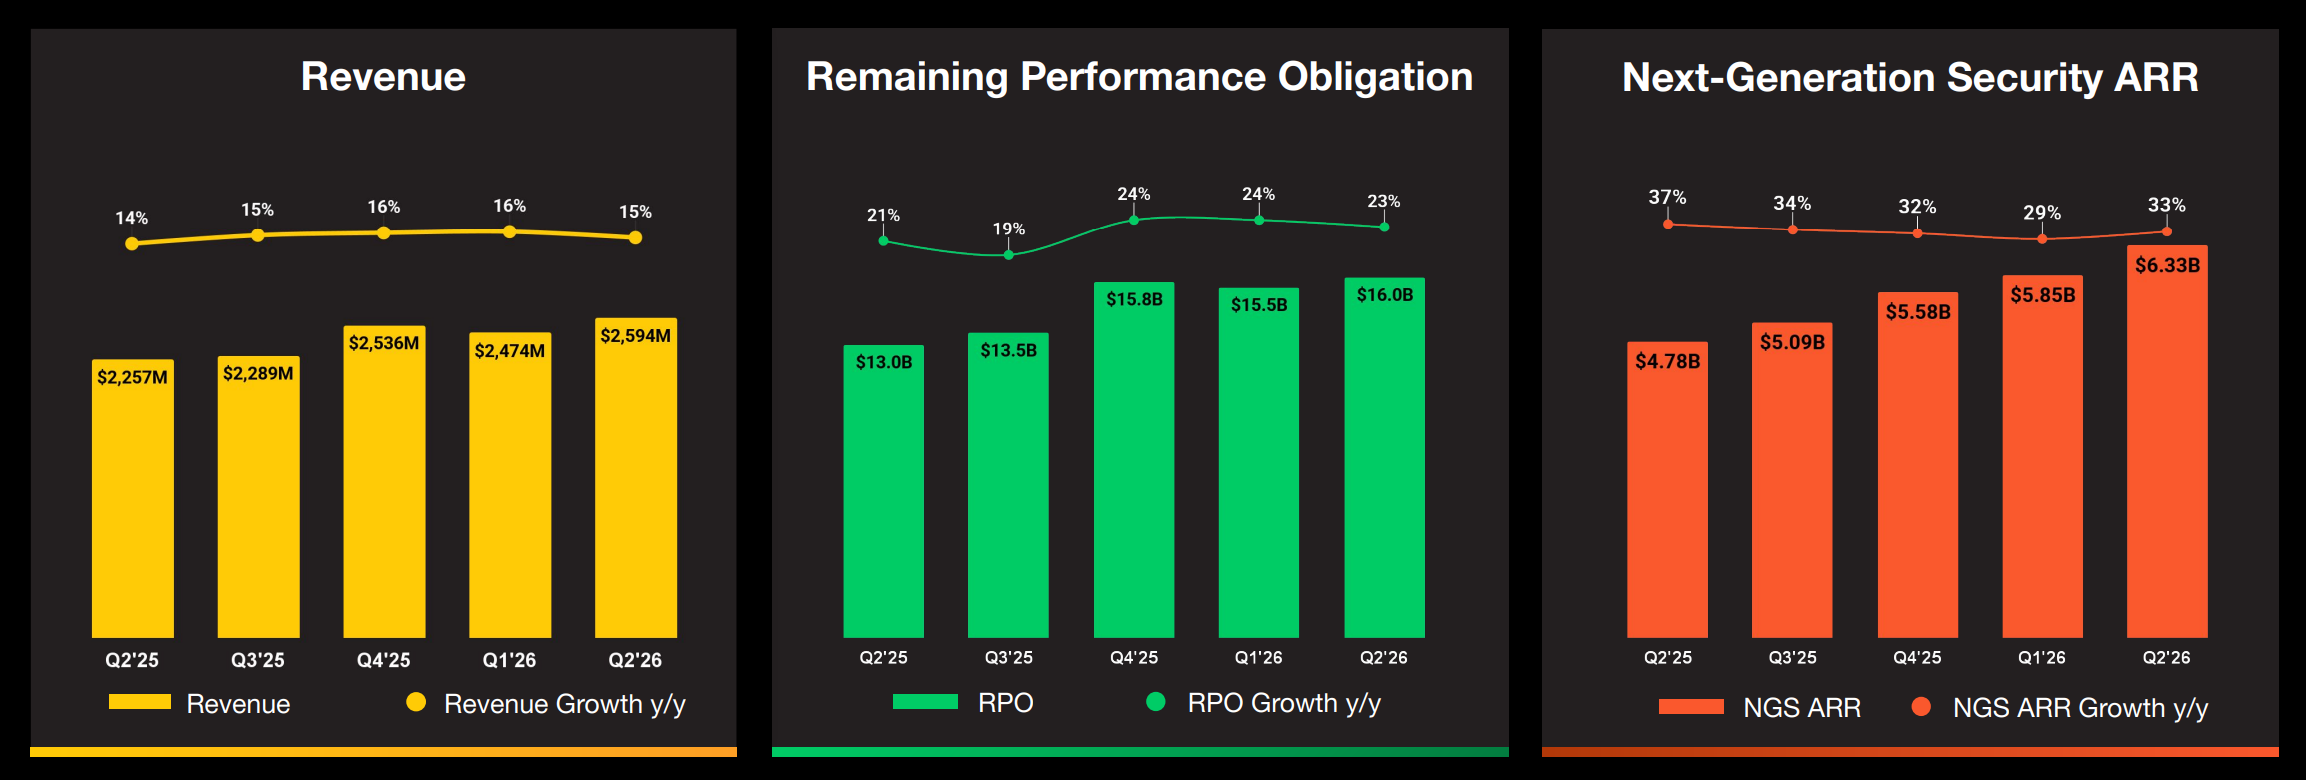
Remaining performance obligations, essentially contracted future revenue, sit near $16 billion, up more than 20% year over year.
Next-Generation Security ARR crossed $6.3 billion and is growing above 30% annually.
Subscriptions and support make up the majority of total revenue, providing a predictable, recurring base.

None of that changed at earnings. What changed was the profit timeline. Two large acquisitions closed in quick succession: CyberArk, a $25 billion identity security deal, and Chronosphere, a $3.35 billion observability platform. Both bring immediate integration costs, amortization charges on acquired intangibles, and dilution from newly issued shares. Full-year revenue guidance went up. Profit per share guidance came down.
The market repriced aggressively because PANW had been priced for perfection. At a premium multiple, any delay in margin expansion is not forgiven easily. But the underlying demand engine is running fine. That distinction matters for how you size your patience.
Fundamental Analysis
The numbers are good. The question is whether the price already reflects that.
Revenue and Margins
Trailing revenue sits near $9.9 billion, growing near 15% year over year.
Gross margin remains strong near 73%, reflecting the software-heavy, high-value nature of the business.
Free cash flow margin sits near 36% to 37%, and management held that guidance even while cutting profit per share. That is the most underappreciated data point from earnings: cash generation is intact even as accounting earnings get compressed by acquisition costs.
Valuation: The Insight Most People Miss
At roughly $107 billion in market cap, PANW trades at about 30 times free cash flow. That sounds expensive. But here is the framing that changes the picture: the company is generating $3.5 billion in free cash flow today on a revenue base of $9.9 billion. If free cash flow margins hold near 37% and revenue compounds at even 18% annually over 3 years, free cash flow reaches roughly $6.5 billion by fiscal year 2028. At today’s price, you are buying that $6.5 billion stream at roughly 16 times, paid now.
The risk to that math is not demand. It is execution. Specifically, whether two simultaneous large integrations can be managed without derailing the organic growth engine. That is the real bet investors are making here, not whether cybersecurity spending will grow.
Stock-Based Compensation
SBC runs near $1.2 billion annually, roughly 11% to 12% of revenue.
This is real dilution and investors should mentally haircut the free cash flow figure accordingly. But the trajectory matters: SBC has declined from roughly 16% of revenue two years ago and is heading toward 9% to 10%. That normalization will add hundreds of millions in real earnings quality over the next 2 years, a tailwind that consensus models tend to underweight.
Balance Sheet
Net cash remains positive. Goodwill and intangibles have grown substantially following CyberArk, which introduces impairment risk if integration underperforms. Not a near-term concern, but worth monitoring.
The business is strong, cash flows are durable, and the long-term thesis remains credible. The stock is no longer priced for perfection, but it is not cheap on a current-year basis. The value case is a 3-year story, not a 3-month one. Investors who need near-term catalysts will stay frustrated. Investors who can hold through integration noise may be well rewarded.
Technical Analysis
The chart is telling you something the fundamentals cannot: who is in control right now.
Technical analysis is not about predicting the future. It is about understanding the balance of supply and demand at specific price levels, and using that understanding to define risk. Here is what the structure shows.
The Breakdown That Happened Before Earnings
The most important technical fact about this selloff is that the stock had already lost 27% from its peak before earnings. Lower highs were forming through late 2025. The critical break came in early February when price lost the $165 level, which had served as long-term support and the base of the prior advance. That break shifted the trend structure from consolidation to confirmed downtrend. Earnings did not create the problem. They removed the last ambiguity about it.
Key Price Levels and Why They Matter
$165 is the prior major support level, now major resistance. A weekly close below this level in early February was the confirming signal that the trend had changed. Any rally that fails to reclaim and hold $165 is just a bounce within a downtrend.
$153 to $155 is the first meaningful reclaim zone. This is where the post-earnings gap partially fills, where a cluster of Fibonacci measurements from the prior swing converge, and where the trend would begin shifting from lower highs to base formation. A sustained close above $153 is the first real sign of repair.
$139 to $142 is the current zone. Measured extensions of the prior decline, the 52-week low, and multiple independent technical frameworks all converge here. Markets frequently pause at these symmetry levels. Whether they hold is a different question.
$129 is the next meaningful level below current prices. It derives from a longer Fibonacci projection of the full decline from the $223 peak. This is the line that separates a reset from a reckoning.
Momentum Across Timeframes
Short-term momentum is deeply oversold. That is associated with elevated bounce risk, not confirmed bottoms. The important context is that in a strong, institutional-driven downtrend, oversold readings can persist for weeks. The decline has been persistent and orderly rather than chaotic, which tells you this is not retail panic being cleared. It is professional distribution.
Weekly momentum is approaching extreme territory, and historically the times PANW’s weekly indicators reached these levels, the stock staged significant rallies of 30% or more over the following months. That historical pattern is the best technical argument for building a position here. It is a necessary condition, not a sufficient one.
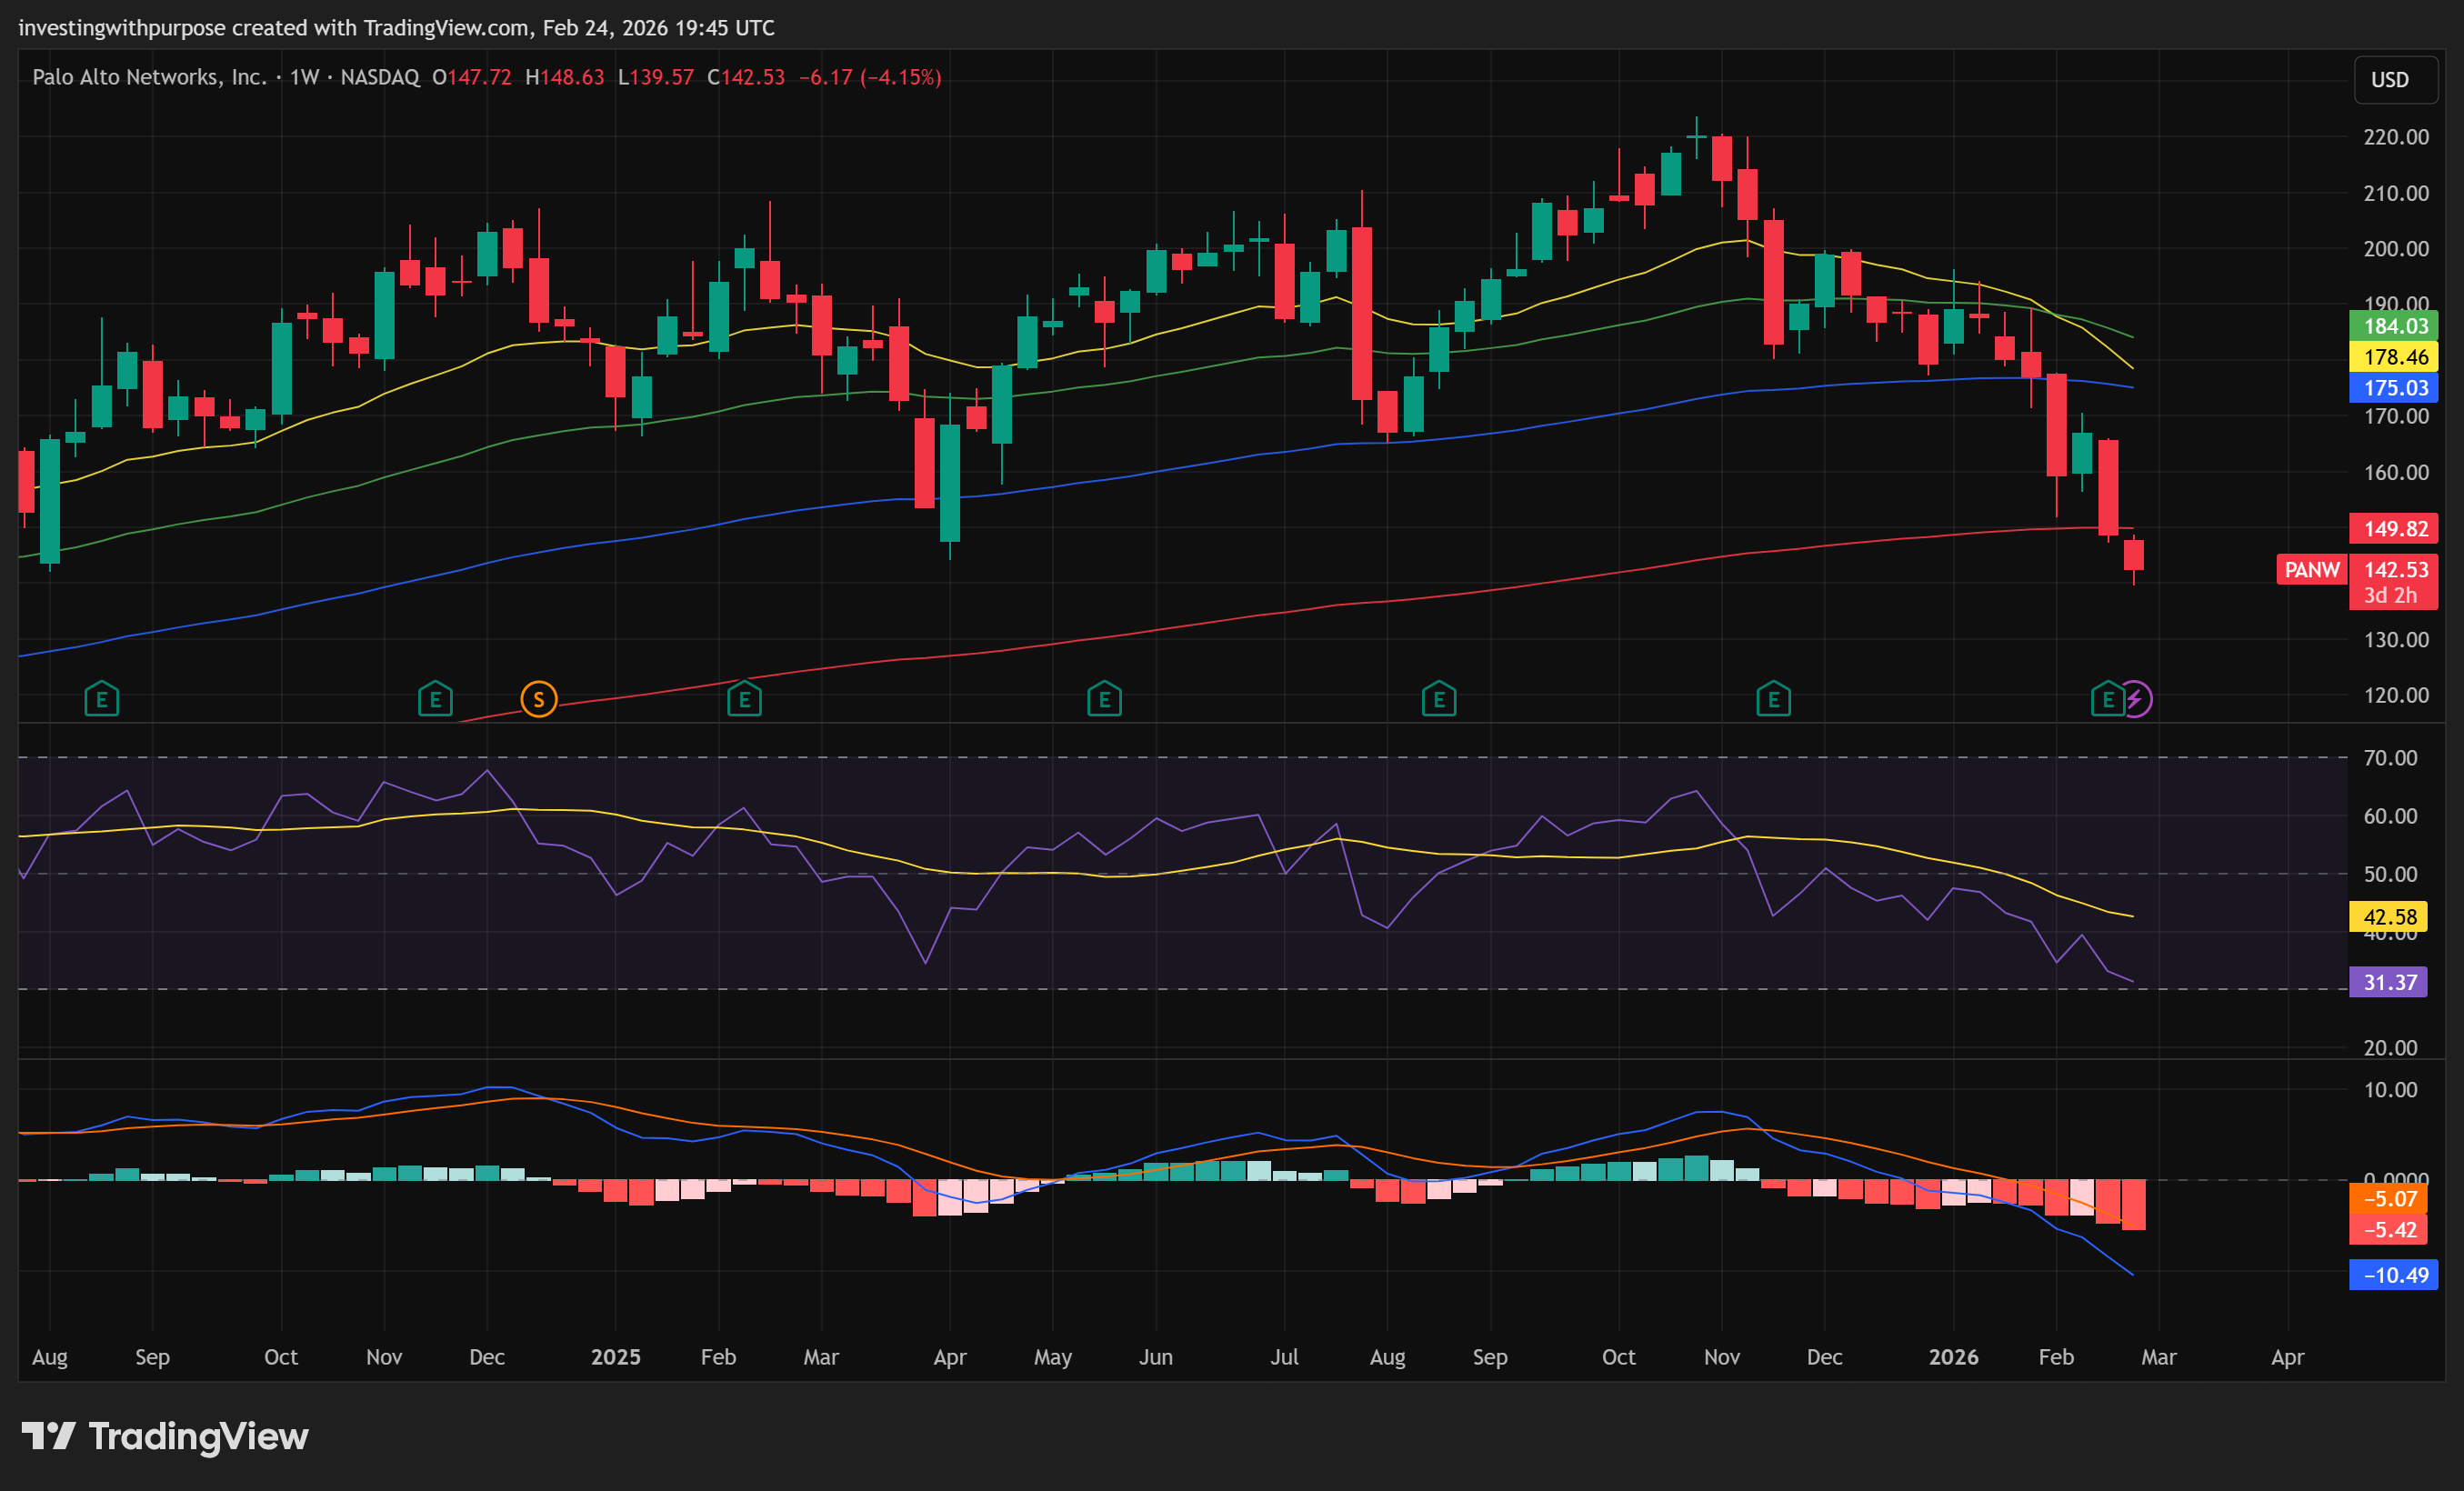
One scenario framework worth holding: if the current decline is the final leg of a corrective sequence from the $223 peak, the $139 to $142 zone represents a natural completion point, and the next major move would resolve sharply higher. The alternative scenario sees a brief oversold bounce followed by a continuation toward $129 before a durable low forms. Both scenarios share the same invalidation. Below $129, the corrective structure likely extends considerably further.
The trend is down, momentum is negative, and no reversal has been confirmed. $139 to $142 is meaningful support. $129 is where the thesis breaks. The first evidence of structural repair is a sustained reclaim of $153, and until that happens, the weight of technical evidence favors careful, structured entry over conviction buying.
Our Trade Plan
A good plan survives contact with a bad day. Build it that way.
This plan is for medium- to long-term investors. Every level has a reason. Every stop has a structure. The goal is to define maximum risk before entering, so that the decision to hold or exit is made in advance, not under pressure.
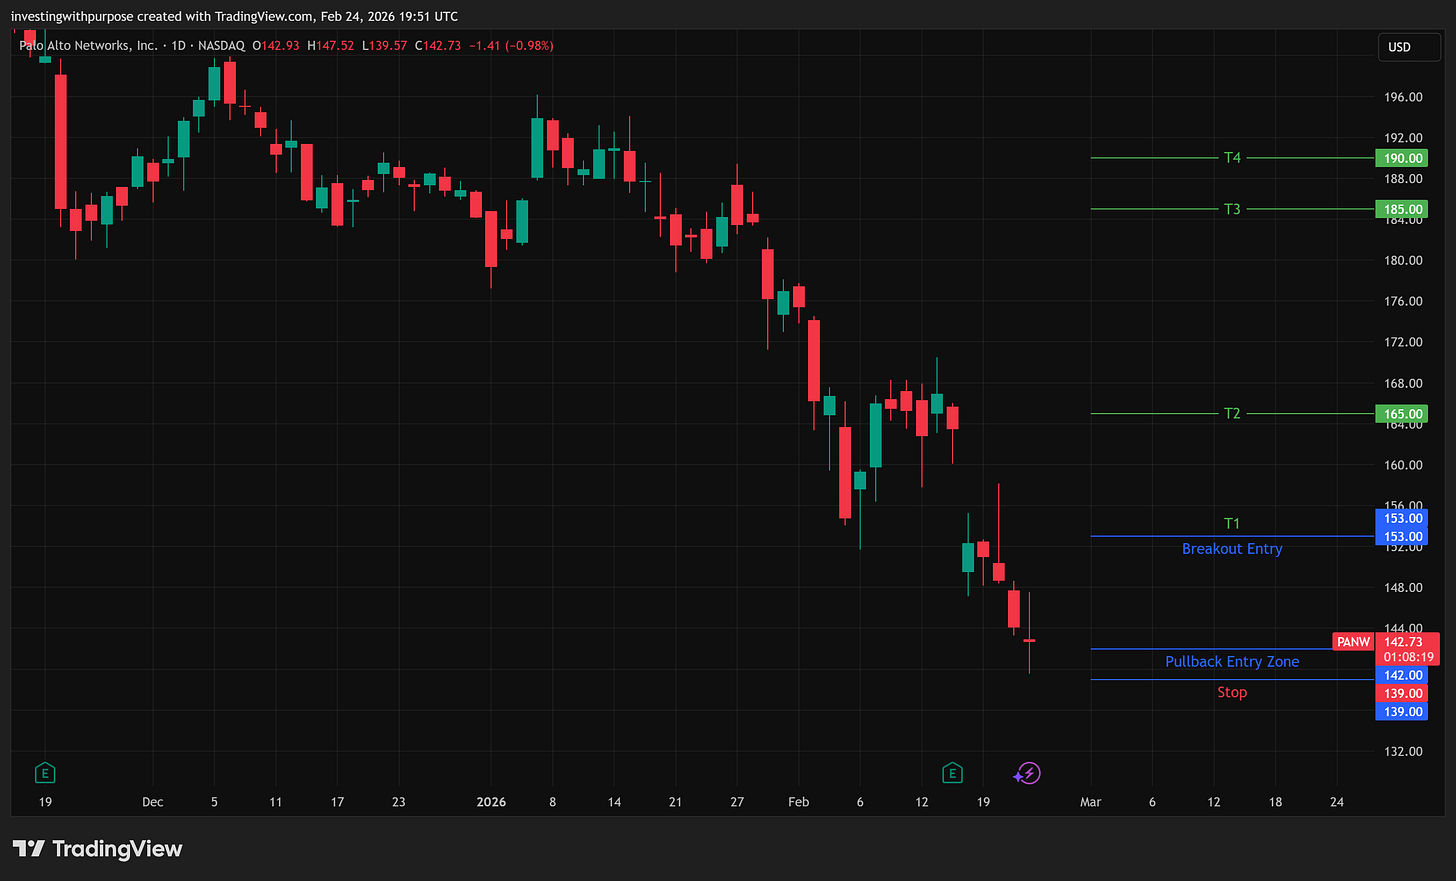
Pullback Entry Zone: $139 to $142. Current structural support where multiple frameworks converge.
Wait for price to stabilize. In practice, that means 2 to 3 consecutive daily closes above $140 with no intraday breakdown below $138.50. One green candle in a downtrend is not confirmation.
Start with roughly half your intended allocation. Reserve the rest for the breakout entry.
Breakout Entry Trigger: a sustained daily close above $153.
This confirms the reclaim of the prior breakdown pivot and a shift from lower highs toward base formation. Add the remainder of your planned allocation on this signal. Do not chase intraday moves. Wait for the close.
True Invalidation Level: $129: A decisive break below $129 confirms the corrective structure is extending and invalidates the reset thesis. This is not a stop loss to be debated. It is the line below which the fundamental and technical case for the position deteriorates materially. If price closes below $129, exit and reassess from the outside.
Targets
Short term, $151 to $153. First structural resistance. Consider trimming roughly one-third of the position here to reduce risk in the trade.
Medium term, $165. Prior major support turned resistance. A sustained reclaim marks a significant change in trend structure. Realistic timeline of 2 to 4 months if the thesis is working.
Long term, $185 to $190. Area of prior consolidation and heavy historical supply. This requires both fundamental execution on margin recovery and meaningful technical repair. Realistic timeline of 6 to 12 months.
Rolling Stop Logic: Entering near $142: initial stop just below $139.
Once price reclaims and holds $153 for 2 closes: raise stop to just below $147. You are now protected from loss regardless of what follows.
Above $165: trail the stop beneath higher weekly lows rather than fixed price levels. This lets the position breathe while protecting against a trend reversal.
A trailing stop simply means you raise your exit level as price rises. You stay invested as long as the uptrend holds, and exit automatically if price reverses through your stop.

Risk-Based Position Sizing
Allocate 0.5% to 1% of total portfolio capital as your maximum loss on this idea.
Wider stops require smaller positions. A wider stop is not permission to risk more. It is a signal to size down.
Scale in after structural confirmation. Initial position in the $139 to $142 zone. Add only after a confirmed close above $153. Do not average down aggressively before that confirmation. In a downtrend, adding to a losing position without a technical signal is not conviction. It is hope wearing conviction’s clothes.
Bottom Line
Separate what changed from what didn’t. Then make your decision.
Palo Alto Networks is not broken. Revenue visibility is strong, cash generation is holding up, and the cybersecurity platform thesis remains credible. The earnings reset was about investment timing, not demand. The business is paying a short-term price for long-term positioning.
But the stock is technically damaged, and damaged stocks require patience. Oversold momentum tells you bounce risk is elevated. It does not tell you the bottom is in. The investors who navigate this well will be the ones who define their risk first and let the plan do the work.
At $142, aggressive investors can begin building a small position against defined risk just below $139. Conservative investors should wait for a sustained reclaim of $153. Everyone should treat $129 as the line that changes the story.
This is a structured opportunity. It is not a gift. The difference matters.
This article is for informational and educational purposes. It is not financial advice. Always do your own research and consult a qualified professional before making investment decisions.
Great read! It is a difficult time for Tech investors.
This analysis highlights the importance of Intrinsic Value versus Market Price. When a stock is "37% off," it suggests a significant Margin of Safety—the gap between what the company is worth based on its cash flows and what the market is currently charging. However, Palo Alto’s current valuation is heavily tied to their "Platformization" strategy. The discount exists because the market is skeptical about their plan to give away services for free now in exchange for total ecosystem dominance later.
Do you think Palo Alto’s strategy to consolidate the cybersecurity market will create a "winner-takes-all" moat, or does the rapid rise of AI-driven competitors make this a value trap?