


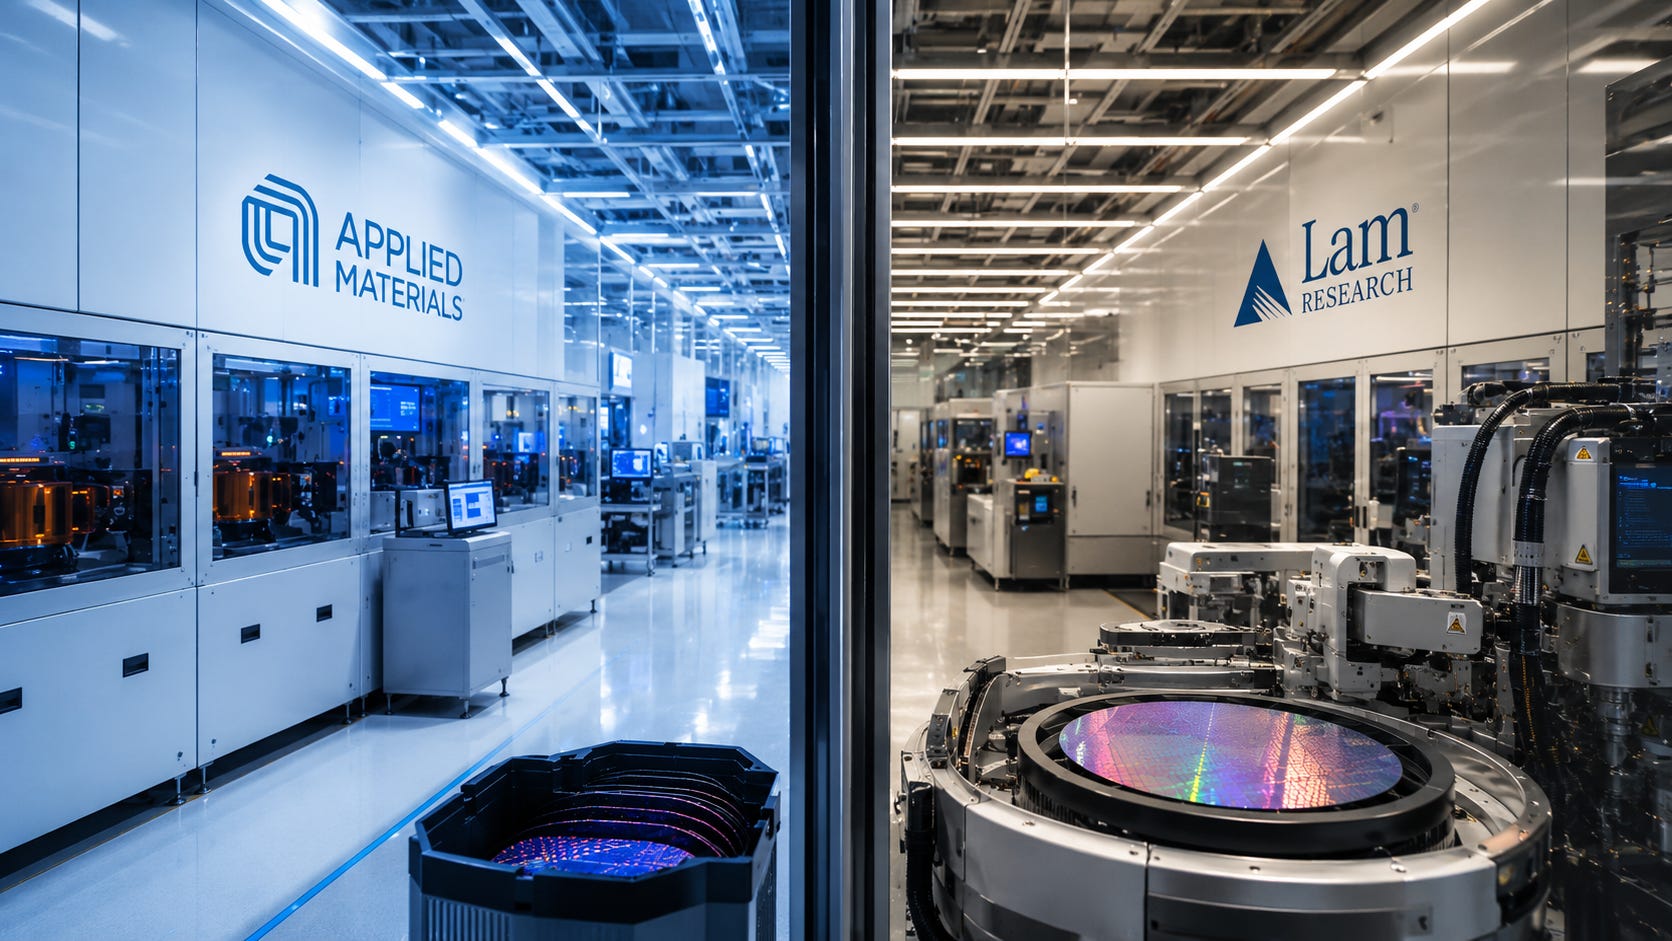
Applied Materials AMAT 0.00%↑ reported Thursday after the close, Lam Research 2 weeks earlier, and the numbers were about as good as semicap numbers get: record revenue at both, record operating income at both, and current-quarter guides that work out to roughly 50% year-over-year growth at each. Yet AMAT closed Thursday at $534.54, already 27.7% below its June 30 high, then fell another 5% after hours.
Lam Research LRCX 0.00%↑ sits 23.1% below its own high, set the very same day. So the frame for everything below: the market isn’t arguing with these earnings. It’s arguing with how long they last.
Key Takeaways
AMAT posted record Q3 revenue of $9.12 billion, up 25% YoY, with record non-GAAP EPS of $3.50, and guided Q4 to $10.25 billion, which against last year’s $6.80 billion works out to roughly 51% growth.
LRCX posted record June-quarter revenue of $6.72 billion, up 30% YoY, at a record 38.4% non-GAAP operating margin, and guided September to $8.10 billion, roughly 52% above the year-ago quarter.
Both stocks peaked on June 30 and have been marked down since, so this is multiple compression against rising fundamentals, not deteriorating businesses.
Nearly identical market caps ($424 billion versus $422 billion) buy you very different things: AMAT carries about 33% more revenue, LRCX converts it far better, and they meet at roughly 29x forward earnings.
Buying both provides less diversification than it looks like: same cycle, same customers, same peak date.
The one that just got marked down first.
AMAT: A Record Quarter, Sold Anyway
The quarter was a genuine beat on the line that matters. Revenue of $9.12 billion grew 25% YoY and 15% sequentially, non-GAAP EPS of $3.50 rose 41% and cleared the $3.45 consensus, non-GAAP gross margin was 50.4%, and non-GAAP operating income of $3.10 billion (34.0% of revenue) was a record. Semiconductor Systems did $7.04 billion at a 37.7% operating margin, services added $1.78 billion at 30.1%, and operating cash flow of $3.04 billion was also a record.
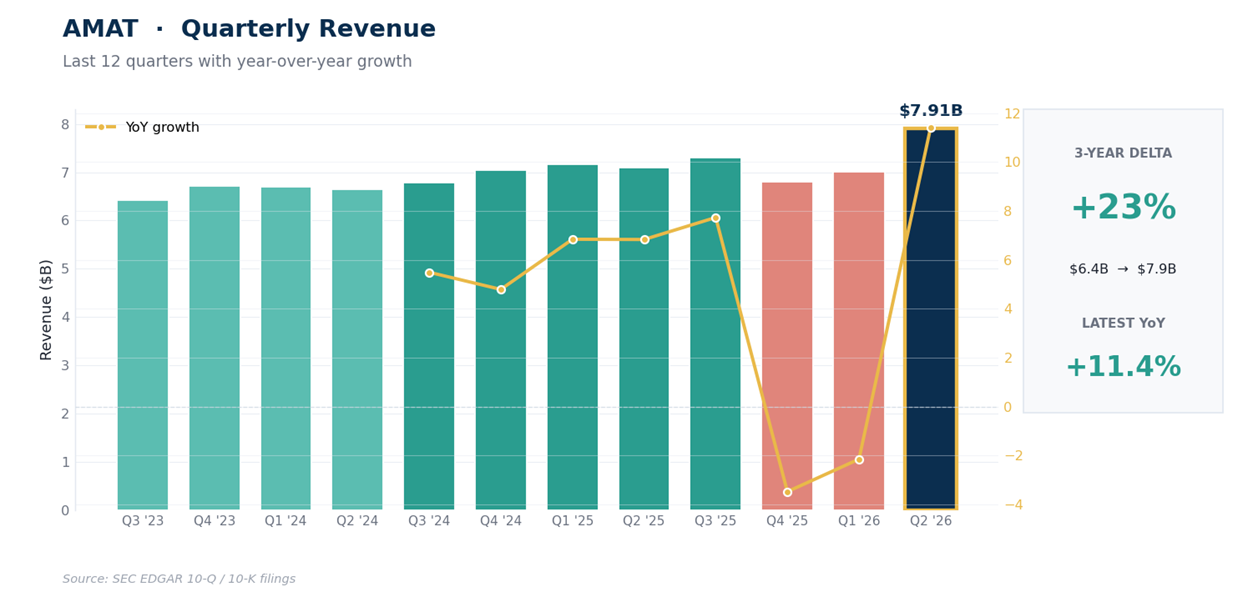
The guide is the part worth sitting with. Management pointed Q4 at $10.25 billion give or take $500 million, with non-GAAP EPS of $4.02. Against the year-ago October quarter’s $6.80 billion that implies roughly 51% growth, and it’s worth remembering AMAT was shrinking a year ago, at -3.5% and -2.1% in the October and January quarters.
Applied again raised its Semiconductor Systems outlook for calendar 2026, now to growth exceeding 30% against a prior expectation above 20%, expects to outgrow the market this year, and sees another strong growth year in 2027. Revenue came slightly below the $9.18 billion consensus in my data feed, though estimates varied by provider, and no gross margin guidance accompanied the outlook.
That’s the thread sellers pulled: the stock fell about 5% after hours to roughly $508 despite the beat and the raise.
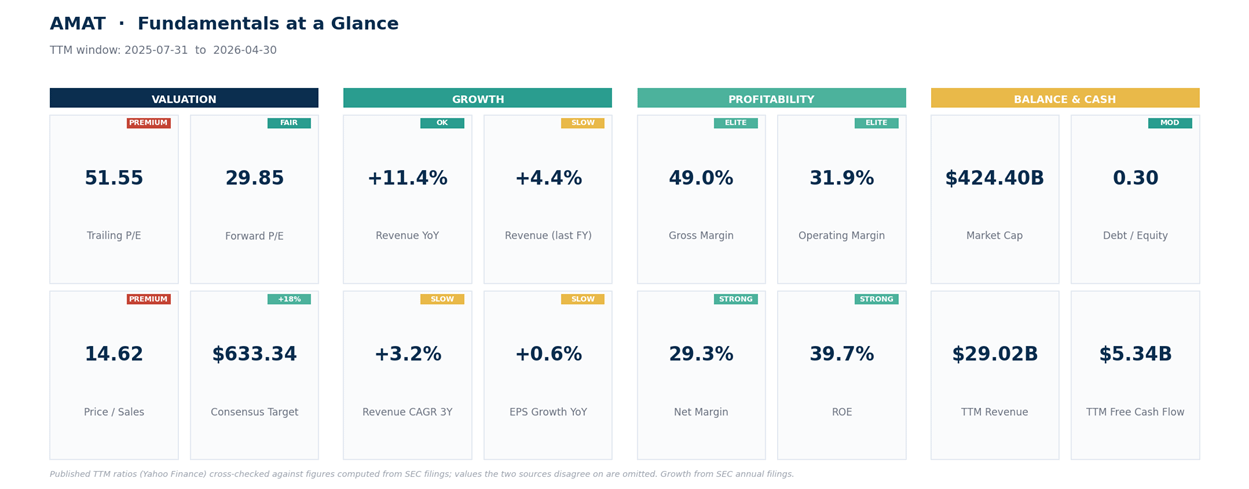
That dashboard is one quarter stale, since the feeds haven’t ingested Thursday’s filing; trailing-12-month revenue of $29.02 billion becomes about $30.84 billion once the new quarter rolls in, pulling price-to-sales from 14.6x to roughly 13.8x at Thursday’s close, or near 13.1x after hours.
The forward multiple of 29.9 is the number that matters; trailing P/E of 51.5 sits on a different earnings basis, so the 2 aren’t a clean growth bridge. Consensus is willing to underwrite the forward figure, at a $633 mean target across 35 analysts, though those estimates predate Thursday’s guide.
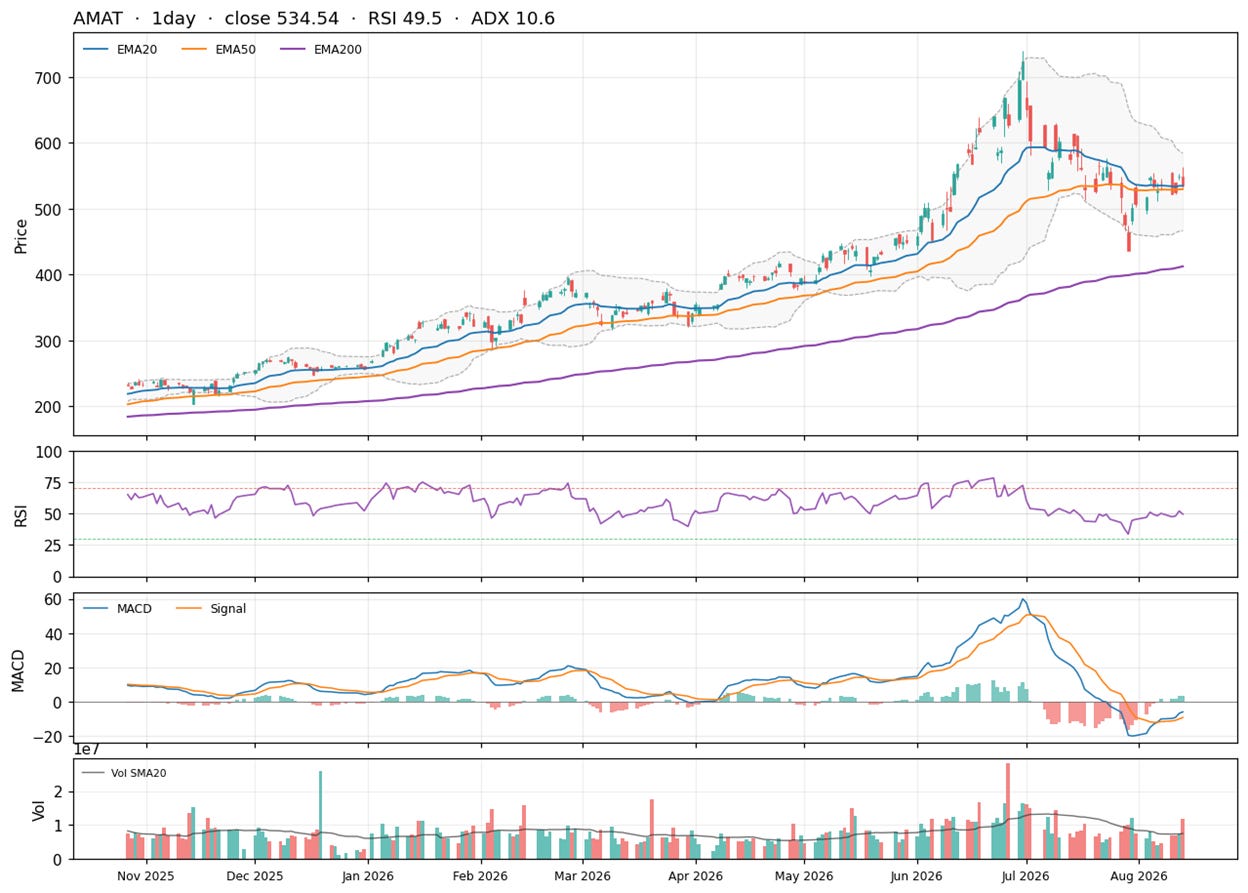
Technical levels below are based on the August 13 close, before the after-hours reaction. AMAT went into the print pinned to its 20-day EMA at $534.63, above the 50-day at $529.59, the 100-day at $486.77 and the 200-day at $412.42, with the daily ADX at 10.6 showing no established trend and RSI at a neutral 49.5.
The weekly timeframe still reads as a strong uptrend with buyers leading sellers, but weekly momentum is fading, and at an after-hours price near $508 it sits below the 50% retracement at $528.16, with the next shelf at the 100-day EMA and the 61.8% retracement at $478.25. With a daily average true range of $35.59, about 6.7% of the price, a single session can travel most of that span.
The business accelerated and the stock got cheaper, the setup value investors say they want and rarely buy. This isn’t a falling knife either, since the guide went up rather than down and the drop lands on a defined shelf instead of a fresh low. The complaint is margin visibility, not demand.
Now the better business.
LRCX: The Higher-Quality Compounder, Already Re-Rated
Lam’s June quarter was the stronger print of the 2, on the metrics that separate good semicap from great. Revenue of $6.72 billion grew 30% YoY and 15% sequentially, non-GAAP gross margin of 52.0% came in above the high end of its own guidance on pricing and mix, and a 38.4% non-GAAP operating margin was a record. Non-GAAP EPS of $1.82 grew 41% against fiscal 2025. Growth has accelerated in each of the last 2 quarters, from 22.1% to 23.8% to 30.0%, with gross margin climbing 49.6%, 49.8%, 51.7% alongside it on the filed figures. Rising volume alongside expanding margins points to unusually strong operating leverage, helped by pricing, efficiency and mix.
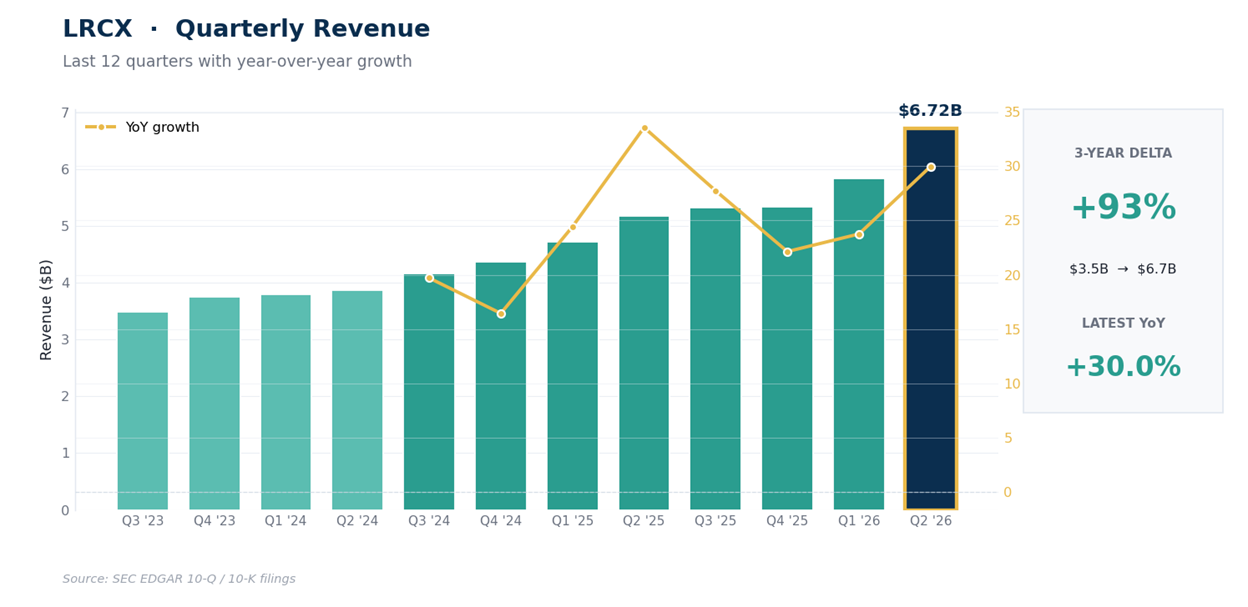
The September guide is where it separated: $8.10 billion give or take $400 million, roughly $1 billion above consensus, with gross margin guided to 52% and operating margin to 39.5%.
Against the year-ago September quarter’s $5.32 billion that’s about 52% growth. Lam also raised its calendar 2026 wafer fab equipment forecast to the low $150 billion range from $140 billion, and framed 2026 as its third consecutive year of outgrowing that market. A supplier raising the size of its own end market mid-cycle is a different signal than one merely beating a quarter.
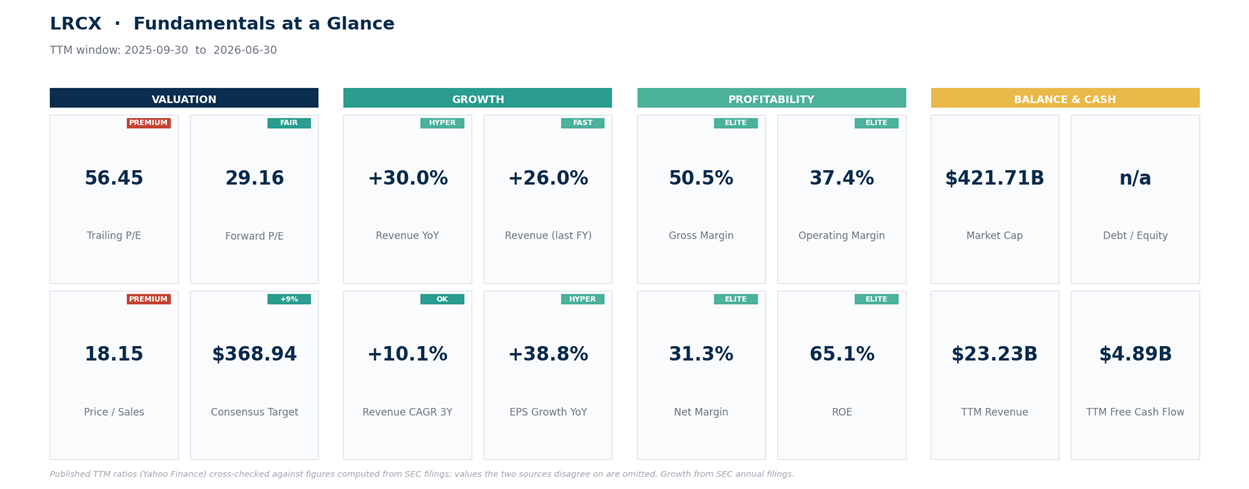
Here the 2 companies invert. LRCX carries the richer valuation, 18.2x trailing sales against AMAT’s 13.8x, and the higher trailing P/E at 56.5, but it earns it: a 50.5% trailing gross margin against 49.0%, a record 38.4% operating margin last quarter against AMAT’s 34.0%, and a 65.1% return on equity against 39.8%. Same market value, about a quarter less revenue, converted far more efficiently.
On forward earnings the 2 land within a rounding error of each other, 29.2x versus 29.9x, which is the market saying these are the same asset priced through different mixes. The catch is upside: consensus sits at $369, only about 9% above Thursday’s close, versus 18% for AMAT.
LRCX is the exact inverse of AMAT’s setup. It bottomed at $250.50 on July 29, its own report date, and has since run 34.5% to $337.01, closing above every daily EMA (20-day $314.67, 50-day $318.48, 100-day $300.29, 200-day $257.43) with buyers leading sellers and momentum still building.
It’s also stretched: the faster stochastic-RSI reading near 98 is about as overbought as that gauge registers, Bollinger %B at 0.91 has price pressed against the upper volatility band, and Thursday’s $345.12 high stopped at a triple confluence with the upper band at $343.84 and the 38.2% retracement at $345.13.
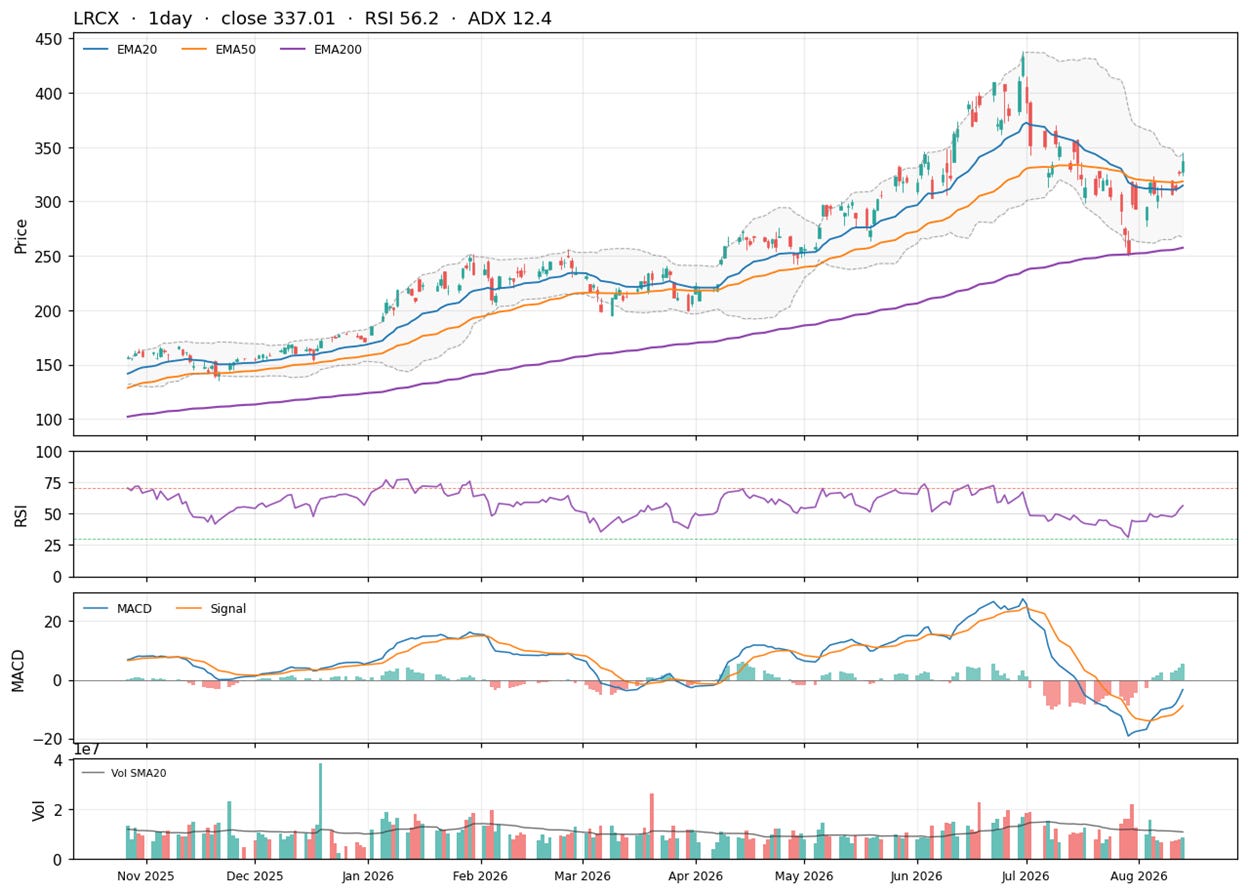
The better business, already paid for the quarter, sitting overbought at a defined ceiling. Quality doesn’t exempt it from needing an entry.
The risk neither number shows.
The Cyclical Trap, Named
In semicap, the P/E lies at both ends. A low multiple on peak earnings is the classic value trap; a high multiple on trough earnings is usually the buy. Roughly 29x forward on earnings visibly inflecting upward is neither. It’s a bet this cycle extends beyond 2027 rather than topping in it. The evidence for extension is recent: both raised outlooks rather than merely beating, and Lam raised its estimate of the market’s size. The evidence for caution is the 6-week derating itself, which suggests investors are discounting duration, valuation and AI-capex cycle risk despite improving near-term fundamentals.
Which brings up concentration. The mix isn’t identical, Lam skews toward memory while Applied is broader with a large services base, but both sell wafer fab equipment to the same handful of customers and both peaked June 30. Owning both gives you less diversification than 2 tickers suggest, so size it closer to 1 position split across 2 names than 2 independent ideas.
How to act on it.
Post-Earnings Setup
The 2 names sit at opposite ends of the same reaction cycle: AMAT is being marked down as you read this, LRCX has already run 34% off its low into resistance. That difference, not company quality, drives the entries. They’re illustrative levels, not instructions.
AMAT
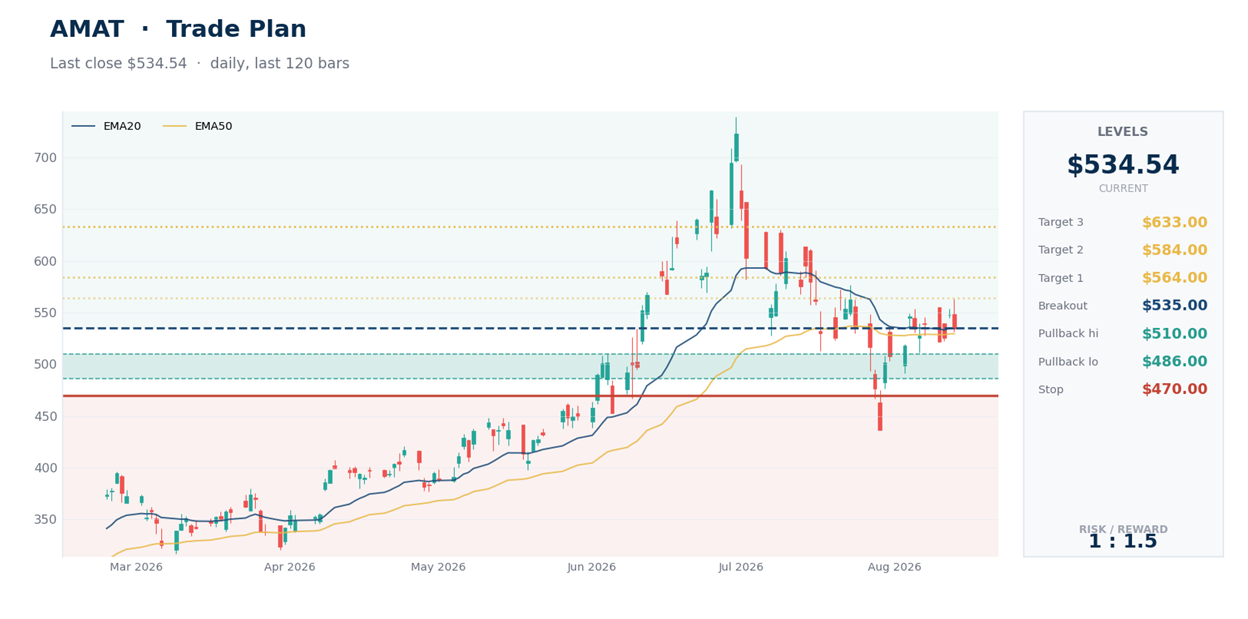
1. Support test: $486 to $510, where the 100-day EMA sits just above the 61.8% retracement. The after-hours print lands at the top of it. Invalidation: a close below $470, under that retracement, which reopens the May range.
2. Reclaim confirmation: a close back above $535, over the 20-day and 50-day EMAs it just lost. Objectives: $564 at Thursday’s high, $584 at the upper band, then $633 at the analyst mean. On a reclaim entry, invalidation tightens to a close below $510.
3. Estimates predate the guide and will be revised; let the shelf prove itself first.
LRCX
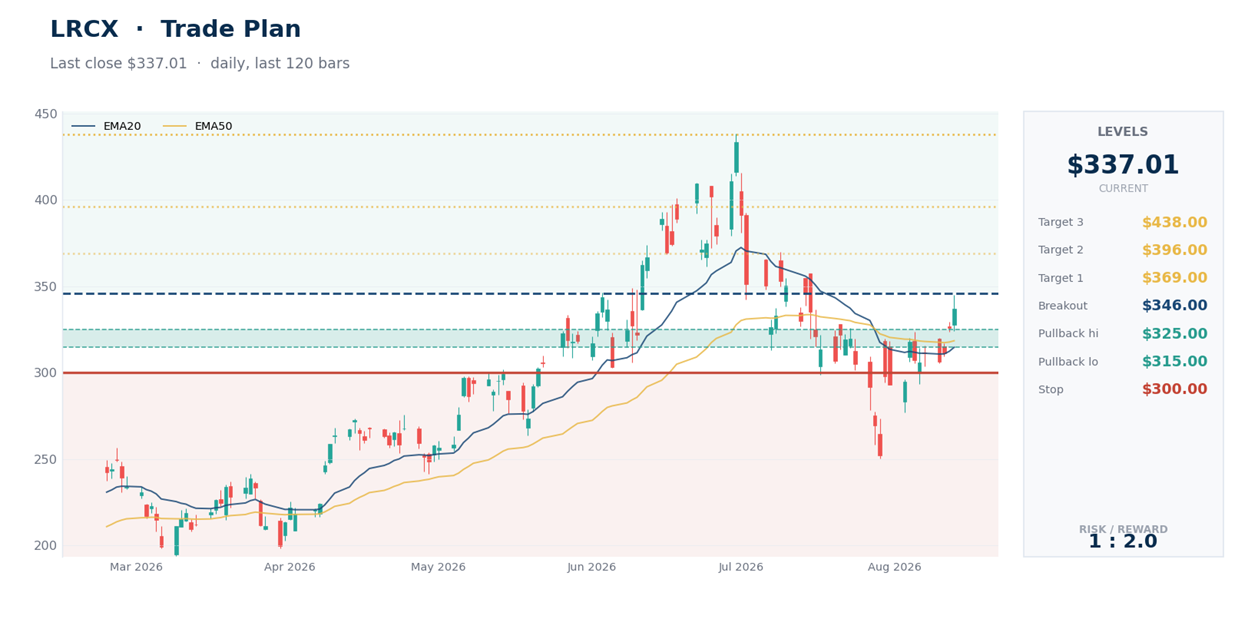
1. Support test: $315 to $325, the 20-day and 50-day EMA cluster with the 50% retracement at $316.29 underneath. This is the entry the current price doesn’t offer. Invalidation: a close below $300, at the 100-day EMA, which would undo the post-earnings advance.
2. Breakout confirmation: a close above $346, clearing the upper band and the 38.2% retracement together. Objectives: $369 at the analyst mean, $396 at the weekly upper band, then $438 at the June high. On a breakout entry, invalidation tightens to a close below $324, Thursday’s low, which would mark it a failed break.
3. With the faster oscillator near overbought and price at a triple-level ceiling, chasing here pays up for a move already made. Patience is a position.
Bottom Line
Your read is right on the businesses and needs 1 adjustment on the trade. Both are executing at records, both raised, and both are cheaper than 6 weeks ago while earning more, which is multiple compression against rising fundamentals rather than a broken story. The adjustment: these aren’t 2 opportunities.
They’re the same AI-capex cycle wearing 2 tickers, peaking the same day and priced within a rounding error of each other on forward earnings. If forced to choose today, AMAT offers the better entry mechanics, a fresh markdown into a defined shelf with 18% to consensus, while LRCX offers the better business, higher margins and returns and an end market it just told you is bigger than everyone thought, at a price that already reflects it.
The markdown currently offers the cleaner setup: AMAT is moving toward an entry zone, while LRCX is asking investors to pay for a move that has already happened.
This is research and commentary, not personal investment advice. Levels and trade plans are illustrative; size positions to your own risk tolerance and time horizon. The author may hold positions in names discussed.