


The Trade Desk fell 21.9% on Friday to $13.80 after its Q2 report, and the value screen now lights up: roughly 16x trailing earnings, net liquidity, strong free cash flow. Here’s the frame for everything below. Cheap is a fact about the price.
Bargain is a forecast about the earnings. TTD has earned the first label, and Friday’s report is precisely what puts the second in doubt: revenue growth of just 3.0% YoY, followed by Q3 guidance of at least $650 million, a floor that implies roughly a 12% YoY revenue decline. The screen is real. So is the reason it triggered.

Key Takeaways
TTD dropped 21.9% on Friday to $13.80, a fresh 52-week low intraday, after Q2 revenue grew just 3.0% YoY and the company guided Q3 to at least $650 million, roughly 12% below last year.
The value screen is real: 16.4x trailing earnings, about 8x EV/EBITDA, 2.17x sales, more than $1 billion of net liquidity, and the $434 million booked as debt is mostly operating leases.
The slowdown is leaking into profitability: adjusted EBITDA fell 11% YoY with 5 points of margin compression, and Q2 free cash flow of roughly $136 million was down sharply from a year ago.
The sell side isn’t calling it a bargain: a hold consensus, mean targets clustered in the mid-$14s near the price, and 4 same-week downgrades including Citi to sell at $11.
With the next report about 87 days away and roughly 18% of the float short, nothing forces a decision on day 1. The levels below define when this becomes investable rather than merely cheap.
The Screen That Says Bargain
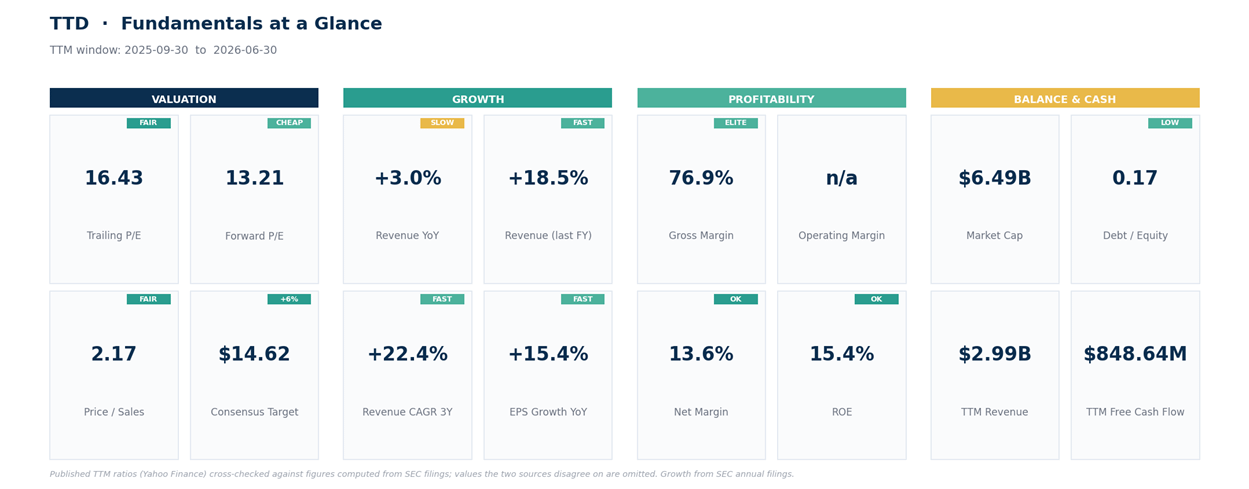
Give the bargain case its due, because parts of it are genuinely right. At $13.80, TTD trades at 16.4x trailing earnings, about 8x EV/EBITDA, and 2.17x trailing sales for a business running a 76.9% gross margin. The balance sheet is the strongest part of the story: $1.1 billion of cash plus roughly $360 million of short-term investments, while the $434 million classified as debt is mostly operating-lease liabilities rather than borrowed money.
Call it what it is, an effectively debt-free company with more than $1 billion of net liquidity and free cash flow north of $800 million over the trailing year. This isn’t a broken company; it’s a profitable, high-gross-margin business that can fund its own turnaround without asking anyone’s permission.
The screen also isn’t picking up some accounting mirage. Fiscal 2025 revenue grew 18.5% to $2.9 billion, the 3-year revenue CAGR runs at 22.4%, and trailing-12-month revenue stands at $2.99 billion with a 13.6% net margin. The stock, meanwhile, is down roughly 74% over 12 months against a 21.7% gain for the S&P 500, from a 52-week high of $56.77. Fiscal-2025 EPS grew 15.4% while the price collapsed, which is another way of saying the multiple did all the falling. That’s the setup value investors dream about.
Until you ask why the multiple fell.
What the Screen Misses
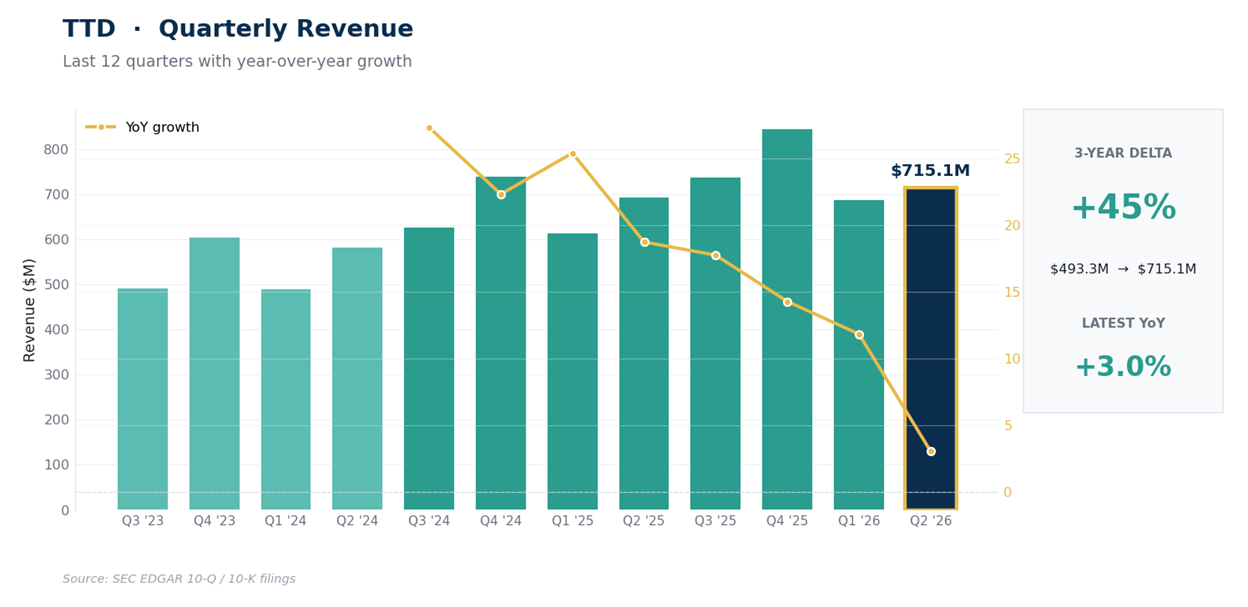
A single-quarter stumble doesn’t take a stock from $56.77 to $13.80. A trend does, and TTD’s growth trend is 2 years of deceleration: +27.3%, +22.3%, +25.4%, +18.7%, +17.7%, +14.3%, +11.8%, and now +3.0%, one brief uptick in early 2025 and nothing since. Q2 revenue of $715.1 million came with net income of $64.4 million, down 28.6% YoY, and GAAP diluted EPS of $0.14.
Then came the guide: Q3 revenue of at least $650 million against $739 million a year ago, a floor that concedes roughly a 12% decline. That’s company guidance, not analyst pessimism.
The slowdown is also already leaking into operating leverage. Adjusted EBITDA fell 11% YoY, from $271 million to $241 million, with the margin compressing 5 points from 39% to 34%, and non-GAAP net income dropped from $203 million to $158 million.
That’s cleaner evidence than the GAAP decline, because nobody can wave it away as tax or stock-comp noise. Free cash flow tells the same story in softer form: still strong over the trailing year, but the quarter’s own contribution, roughly $136 million, was down sharply from a year ago. Strong in absolute terms; no longer immune.
Which raises the question the whole bargain debate turns on: is the reset cyclical, execution, or structural? Management pointed to a tough environment for large advertisers, consumer packaged goods and autos in particular, and the reporting around the print adds pressure from closed ecosystems, pricing and execution questions, and the Publicis dispute.
Against that, CTV and audio kept growing at double-digit rates, with international CTV strong. If the $650 million floor is a kitchen-sink number, macro plus Publicis disruption plus internal cleanup, then sub-8x EV/EBITDA with a billion of net liquidity is genuinely interesting. If TTD is instead losing pricing power or share to Amazon and the closed ecosystems, then 16x trailing isn’t cheap at all, because normalized earnings power sits below trailing earnings. That fork, not the multiple, is the investment decision. The screen sees a 16x multiple on trailing earnings; the trajectory says those trailing earnings may be the high-water mark, not the base.
The noise around the print doesn’t settle the fork either. The leadership team was heavily reshaped over the summer, with a new CFO, CMO and chief commercial officer arriving since June, though Jeff Green remains CEO. The forward multiple is a moving part by construction: the dashboard prints 13.2x, but estimates are being revised as you read this, and quotes run into the mid-teens depending on the provider.
When the E is falling, a low P/E is a moving target. The sell side reflects it: a hold consensus, mean targets clustered in the mid-$14s, essentially at the price, and 4 same-week downgrades, Citi to sell with an $11 target plus Raymond James, Truist and Susquehanna. Latest reported short interest runs about 73.6 million shares, roughly 18% of the float, positioning color that can fuel bounces but isn’t a thesis.
Now the price structure.
The Structure After a 22% Day
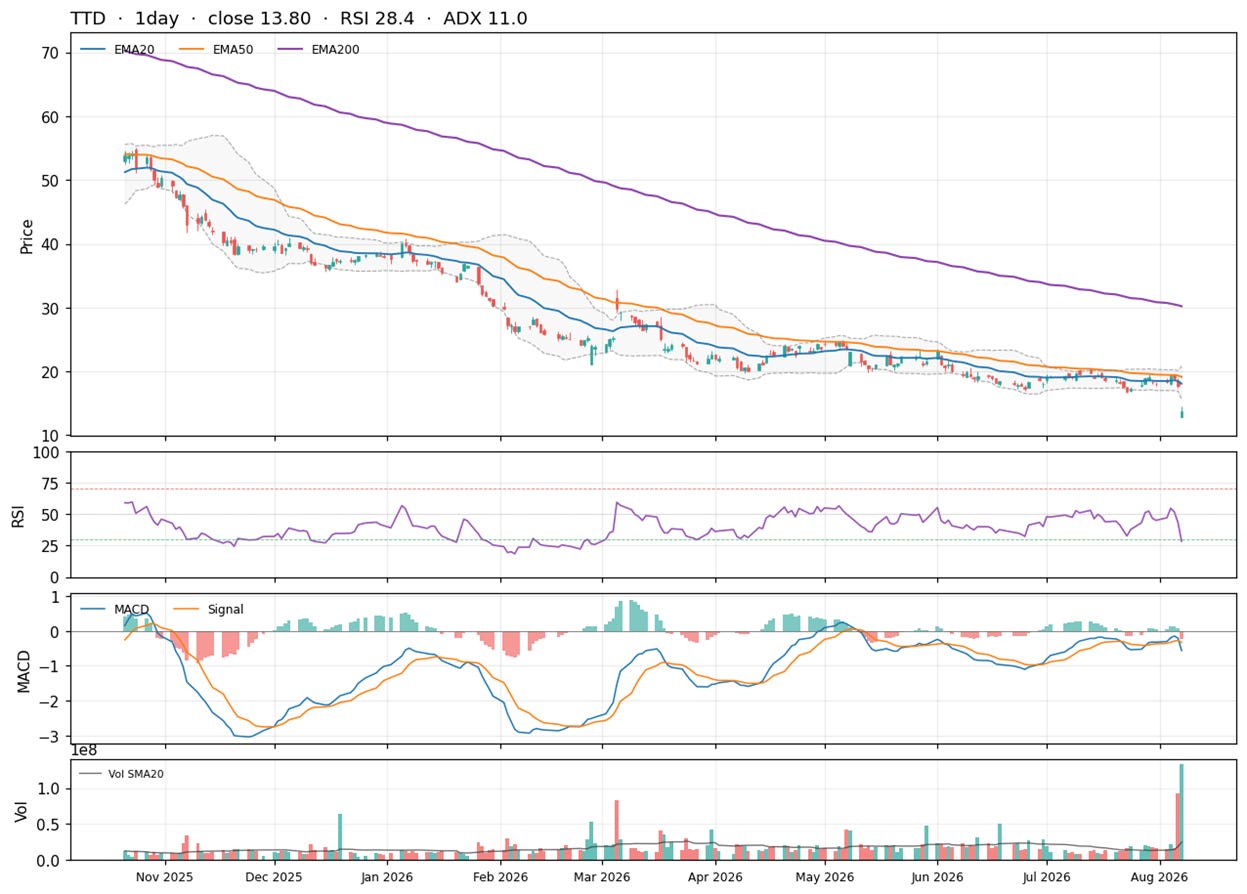
Technical levels below are based on the August 7 close, computed with standard settings and verified against TradingView defaults; readings elsewhere may differ slightly. Friday’s anatomy: the stock closed Thursday at $17.67, opened at $12.87, printed a fresh 52-week low at $12.83, and clawed back to $13.80 on more than 5x average volume. That leaves price 24% below its 20-day EMA at $18.07 and beneath the entire volatility envelope, under the lower Bollinger Band at $15.64.
Daily RSI at 28.4 is oversold, but the MACD line at -0.56 dropped below its signal at -0.33 on Friday itself, momentum flipping negative in a single session, and the directional readings are one-sided: -DI at 45.1 versus +DI at 18.0, sellers in complete control. The weekly timeframe removes any ambiguity about context, with ADX at 34.9 marking an established, strong downtrend and every weekly EMA stacked overhead from $21.11 to $60.05. Average true range has expanded to $1.30, close to a 10% daily swing at this price.
One detail argues the bulls aren’t extinct: Friday closed 7.2% above its open, so buyers did show up at the low. They just haven’t proven they can hold the ground, and oversold is a description, not a signal, the day after a guidance reset.
The map overhead is simple because Friday left a vacuum: the first hurdle is Friday’s $14.57 bounce high, then nothing but gap until $17.39, then the 20-day zone around $18.07 to $18.23. The next earnings report is currently expected on November 5, about 87 days out, though the company hasn’t formally confirmed the date. There’s no catalyst between here and there, only estimate revisions and whether the low holds.
The screen says cheap and the screen isn’t wrong. But every trend measure on the page says the market hasn’t finished repricing the growth reset, the first reclaim test at $14.57 hasn’t been attempted, and there’s no catalyst for roughly 87 days. Cheap plus falling is a watchlist entry, not a portfolio entry.
What would change that.
Post-Earnings Setup
Day-1 rules after a guidance crash: fresh lows have no memory, gaps act as ceilings until reclaimed, and time is on the buyer’s side when the next catalyst is a quarter away. They’re illustrative levels, not instructions.
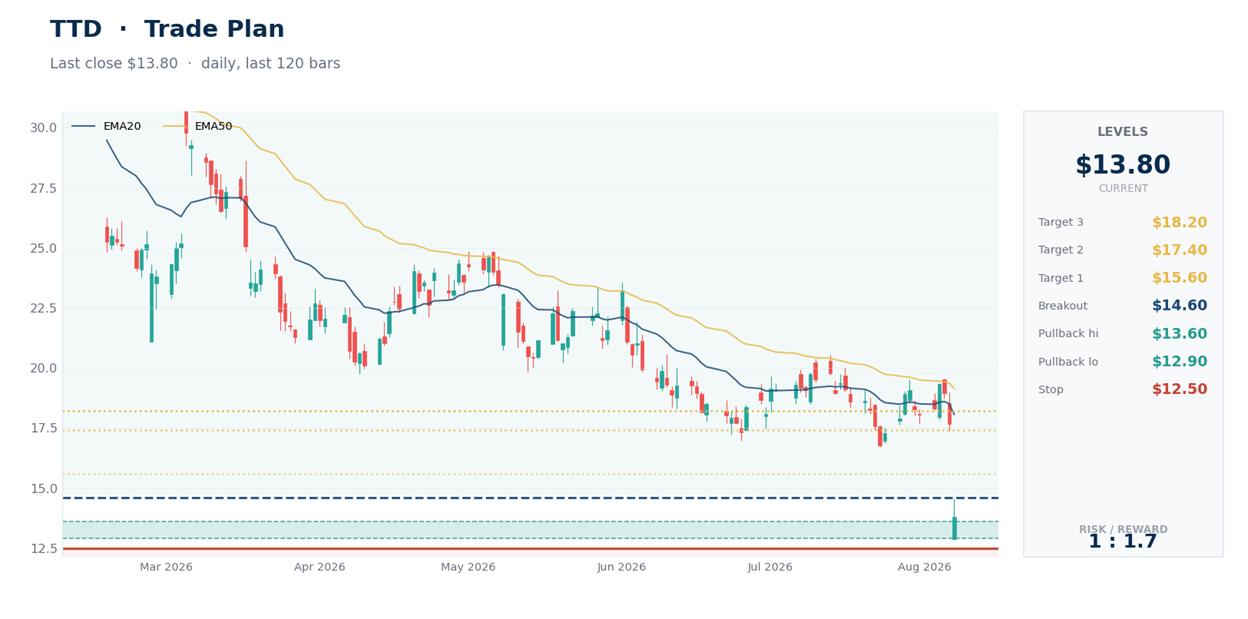
1. Base setup: $12.90 to $13.60, and only after the $12.83 low has held for at least a week or 2 of sideways trade. There’s no established support in that zone, only Friday’s low, so time is the confirmation. Invalidation: a daily close below $12.50, which puts price in territory with no visible support from the past year of trading.
2. Reclaim confirmation: a daily close above $14.60, over Friday’s bounce high. Objectives: $15.60 at the lower Bollinger Band, $17.40 at the top of the gap, then approximately $18.20 at the 20-day zone. On a reclaim entry, invalidation tightens to a daily close back below $13.60; risking $2 to the crash low for a $1 first objective isn’t a trade.
3. With roughly 18% of the float short and somewhere between 4 and 6 days of average volume needed to cover, any stabilization can travel fast, which is exactly why the reclaim trigger beats anticipation. Patience is a position here.
Bottom Line
The bargain case is half right, and the half it gets right matters: an effectively debt-free, cash-generating business at 16x trailing earnings and about 8x EV/EBITDA can fund its own turnaround. But a bargain requires the earnings to hold, and everything new from Friday, the 3.0% growth print, the $650 million floor, the margin compression, the downgrades, argues the estimates are still finding theirs.
The real decision is the fork: if this is macro plus Publicis plus cleanup, the price is a gift; if it’s share loss to closed ecosystems, trailing earnings overstate normal. You don’t have to answer that today. Watch for the reset to prove itself: estimates stabilizing, the $12.83 low holding for weeks rather than days, and a reclaim of $14.60 as the first mechanical confirmation.
If the guide turns out to be a kitchen-sink number, there will be time and room to act above $14.60 with the crowd still short. Cheap is a fact about the price. Bargain is a forecast about the earnings. Wait for the forecast to earn its evidence.
This is research and commentary, not personal investment advice. Levels and trade plans are illustrative; size positions to your own risk tolerance and time horizon. The author may hold positions in names discussed.