Advanced Micro Devices, Inc. (AMD) - The Chip Champion
A Durable Base Meets Long-Term Upside

AMD 0.00%↑ just finished a big reset after hitting highs earlier this year. It stopped falling right where it should’ve - like bouncing on a trampoline. Now it’s starting to move up again, and the pattern says it could go much higher.
AMD makes chips for AI and data centers - and that part of the business is about to double by 2027. It's also expected to make 3x more free cash. And right now? It’s still priced like nothing big is coming
AMD is lining up strength on both fronts - the business is growing fast, and the chart shows it’s ready to run. The next goal? $145–150. This is where strong moves begin: from a good plan, a strong base, and a little patience. Here's how to look at this..
1. Elliott-Wave & Weekly Technicals
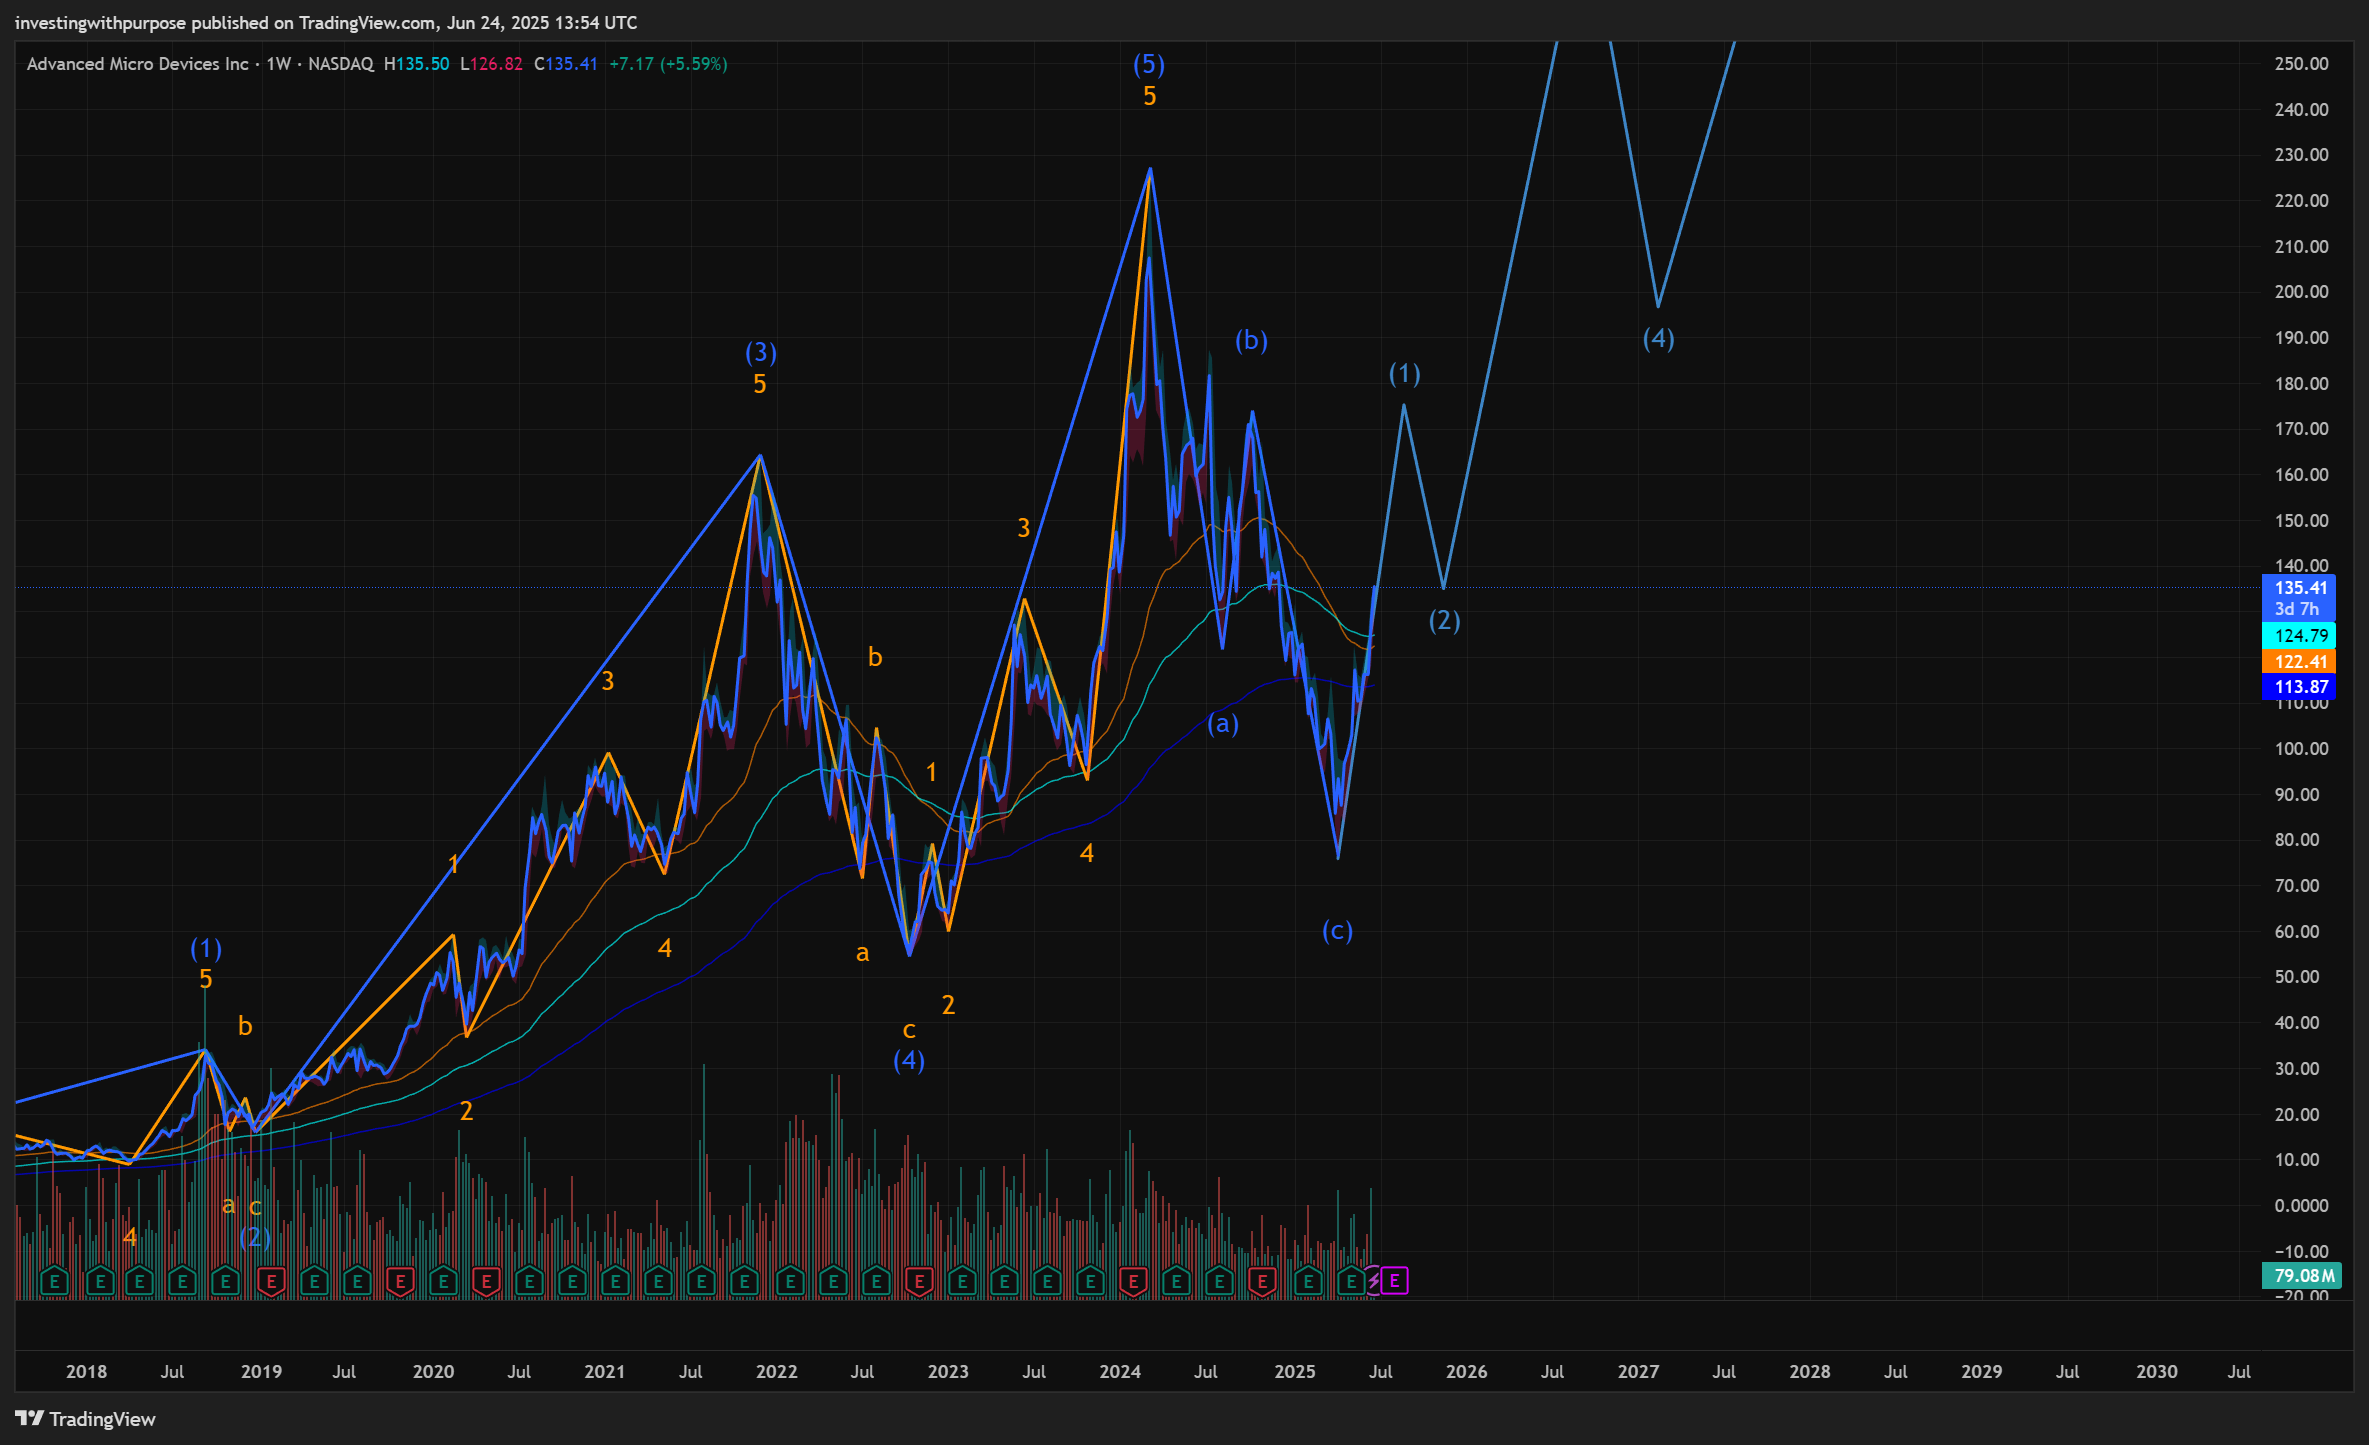
Wave Count: Complete 5-wave structure from 2020 to 2024; current decline is an (A)-(B)-(C) corrective pattern with (C) likely finished in May.
Retrace: Wave (C) bottomed at 73.6% of the impulse (approx. $76.5), aligning with 200W EMA - a classic long-term support zone.
Wave 5 Projection: 1.618 extension of prior impulse gives $234.35 target. Longer-term Fib extensions point to $320–490 as cycle extremes (2.618–4.236 levels).
RSI (14): Weekly RSI forming bullish divergence, bottomed near 35 while price made a lower low.
MACD (12,26): Histogram contracting, lines curling upward. Momentum shift underway.
Implication: The weekly chart signals the corrective cycle has bottomed. Ideal zone for building core exposure.
2. Fundamental Underpinning
Forward P/E: $AMD ~27× (2025), dropping to ~18× by 2027 - pricing in almost no upside.
FCF Expansion: Free cash flow expected to triple by 2027 on the back of margin leverage and AI/accelerator demand.
Data Center Outlook: This segment (~50% of revenue) projected to double by 2027 - driven by MI300 ramp and hyperscaler adoption.
Competitive Edge: While $NVDA dominates now, $AMD’s ROC and margin trajectory show improving fundamentals under the surface.
Valuation Edge: For a player in AI, server, and embedded, $AMD offers a rare combo of growth and undervaluation.
3. Daily Structure & Confirmation
EMA Cluster (20/50/100/200): Price reclaimed all daily EMAs post-April bottom. Bullish slope developing - early trend resumption.
Fib Levels: Recent high ($141.40) aligns with 0.786 retrace of the decline. Pullback to $122–124 (0.382–0.5 zone) would reset the structure for continuation.
MACD: Bullish crossover confirmed above zero - trend-strengthening signal.
RSI: Bounced off 30, now testing 65–70. Needs a clean breakout >70 for trend confirmation.
Implication: A controlled dip to $122–124 is a strong add zone. Daily momentum supports a higher low forming.
4. Intraday Signals (2H + 1H)
Ichimoku Cloud: Price broke above cloud with conviction. Kijun and Tenkan lines supportive - short-term momentum intact.
Fib Extensions (2H):
1.0 = $145.85
1.618 = $151.06
2.618 = $166.69
Expect chop near $140–145 followed by breakout attempts toward $150–155.
MACD (2H): Slight bearish divergence on wave 5, suggesting pullback or consolidation before next push.
RSI (2H): Overbought, cooling off. Watch for reset toward 50 on dip.
Implication: Short-term traders may see volatility near $135–140. Long-term holders should use dips for scaling, not chasing.
5. Phase-Based Entry & Risk Plan
Phase 1 – Base Exposure
Allocate: 30%
Entry Zone: $122–124
Stop Loss: Below $117
Phase 2 – Confirmation
Allocate: 40%
Trigger: Daily close above $141.40
Stop Loss: Below $130
Phase 3 – Trend Continuation
Allocate: 30%
Trigger: Weekly close above $151
Risk Management: Use trailing stop under $135
Upside Targets
Initial: $145–150
Medium-Term: $166–182 (1.618–2.0 Fib extension)
Long-Term: $230+ (weekly 1.618 extension)
Targets:
Initial = $145–150
Medium = $166–182 (Fib 1.618–2.0)
Long = $230+ (weekly 1.618 ext.)
6. Macro & Catalyst Calendar
Fed Outlook: Rate cut window opening in Q4; real yields compressing - tailwind for growth equities.
AI Spending Cycle: CSPs and hyperscalers expected to raise capex into H2. $AMD likely a beneficiary.
Earnings Dates:
Aug 1: Q2 earnings (watch for MI300 ramp detail + FCF guide)
Sept 13: Goldman AI Conference
Oct 31: Q3 earnings (margin inflection expected)
Final Thought:
This isn’t a short squeeze or hype play. $AMD just completed a multi-year correction - technically complete, fundamentally sound. When structure and story align, so does the return.