
After a 30% Pullback, Is Molina Healthcare Setting Up for a Long-Term Recovery?
Assessing downside risk, upside potential, and the path back to stability.

Molina Healthcare MOH 0.00%↑ has entered a very different phase of its market life.
After years of being treated as a reliable managed care compounder, the stock experienced a decline of about 30% following its February earnings update. The reaction was not subtle. Price fell hard, volatility expanded, and confidence was shaken.
For medium to long-term investors, the right response is not urgency. It is clarity.
This piece steps back and does three things. It explains what actually changed in the business, how expectations were reset, and what the current price structure is signaling about risk and opportunity. The goal is not to predict a bottom. The goal is to assess whether Molina is becoming investable again, and under what conditions.

Key Takeaways
Molina remains a large, relevant managed care operator, but 2025 marked a clear deterioration in profitability and cash generation.
Revenue continued to grow, yet margins compressed sharply, driven by medical cost pressure and unfavorable program mix.
Free cash flow turned negative, which materially changes the risk profile during a guided trough year.
The stock is deeply oversold, but oversold does not equal repaired.
From a risk-adjusted perspective, patience is still required. The stock becomes actionable only after clear stabilization and confirmation.
Business, and Latest Earnings
Molina’s business does not have a traditional backlog. Visibility instead comes from enrollment levels, contract structures, and rate adequacy across its core programs.
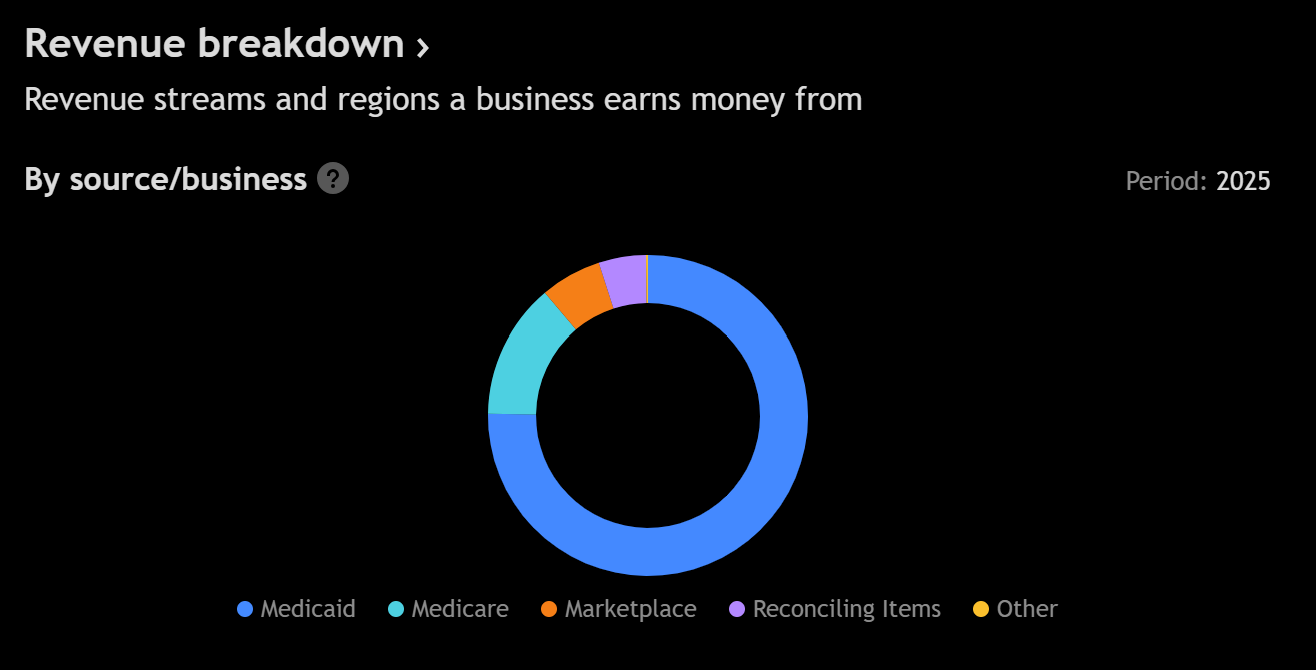
The company is primarily exposed to Medicaid, with additional participation in the ACA marketplace and Medicare-related products. Medicaid remains the economic engine, while the other segments introduce higher volatility.
What changed with the latest earnings was not demand. Membership and premium revenue did not collapse. What changed was the cost side of the equation and management’s confidence in near-term profitability.
The company framed 2026 as a trough year. That language matters. It implies that current margins do not reflect normalized earnings power, but it also admits that the path back is not immediate.
The strategic response includes shrinking underperforming lines, particularly within the ACA marketplace, and repositioning capital toward core Medicaid operations. That may improve quality of earnings over time, but it reduces near-term revenue visibility and raises execution risk.
Fundamental Analysis
The numbers tell a very clear story. Growth persisted. Profitability did not.
Revenue and growth
2024 revenue was approximately $39.2B.
2025 revenue increased to roughly $43.6B, representing about 11% year-over-year growth.
Quarterly growth decelerated into the second half of 2025, but remained positive.

Revenue was not the problem.
Margins and earnings
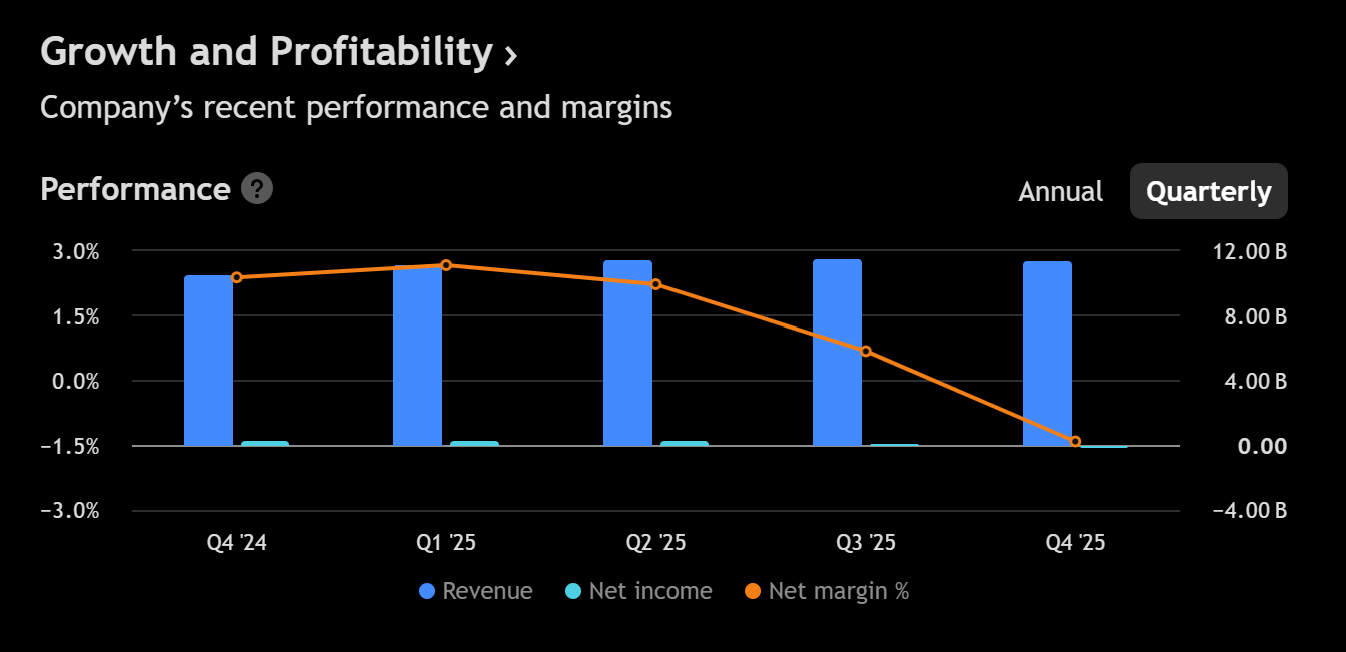
Operating income declined from about $1.7B in 2024 to roughly $0.8B in 2025.
Operating margin compressed from about 4.4% to approximately 1.8%.
Net income fell from around $1.18B to about $0.47B.
Full-year EPS dropped from 20.42 to 8.55.

This is a material reset, not a rounding error.
The driver was medical cost pressure. Even modest increases in cost ratios have an outsized impact in managed care. A deterioration of just a few points effectively erased the earnings engine that investors had been underwriting.
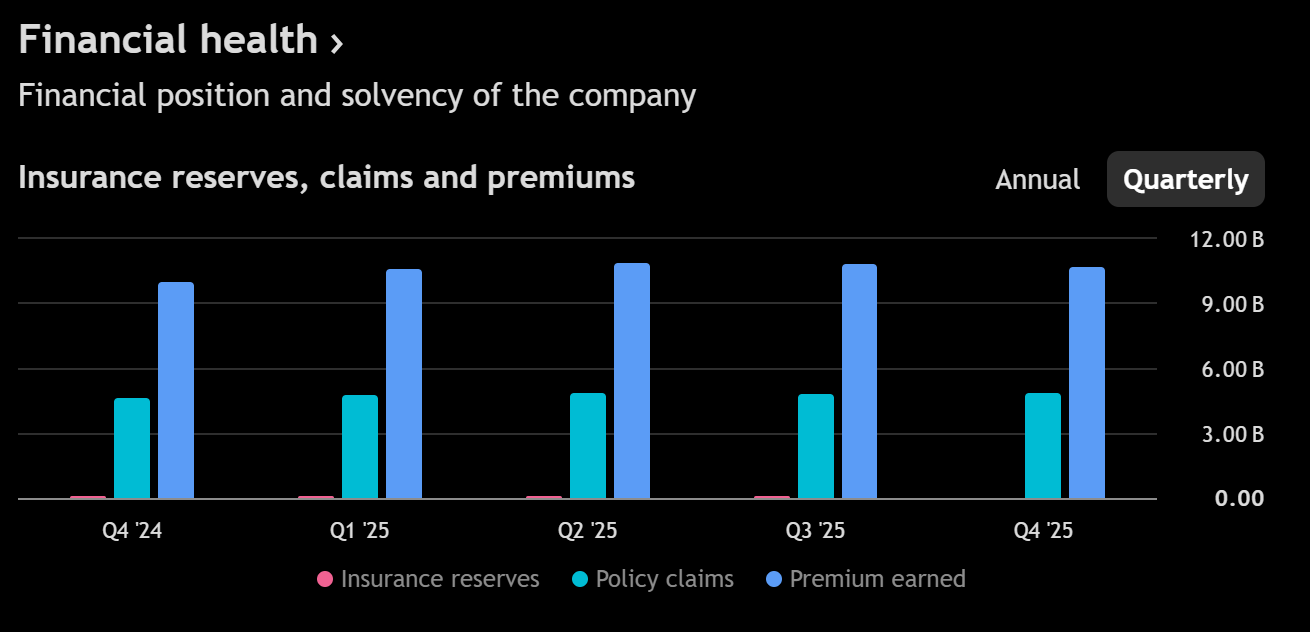
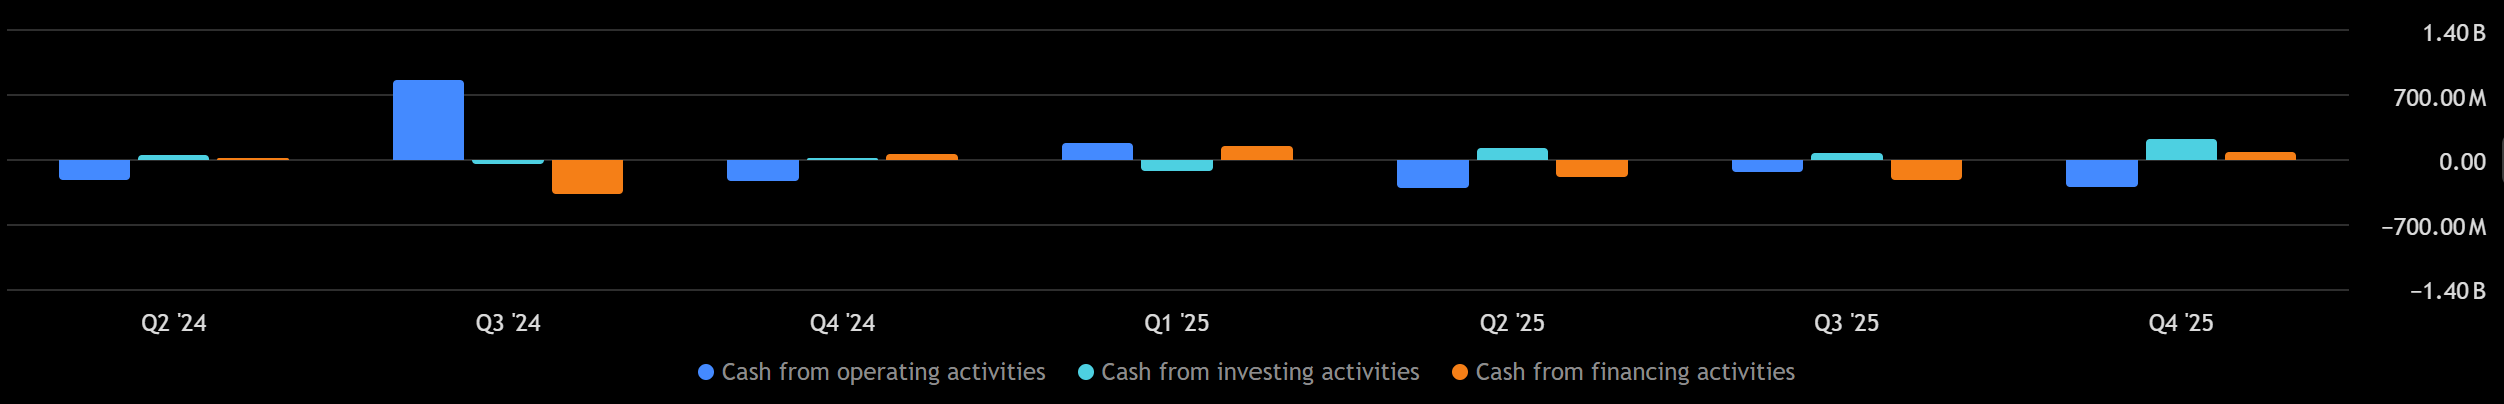
Cash flow
Operating cash flow declined from about $0.64B in 2024 to negative $0.54B in 2025.
Levered free cash flow moved from positive $0.54B to negative $0.64B.
This is critical. When margins compress and cash generation weakens simultaneously, the margin for error shrinks quickly.
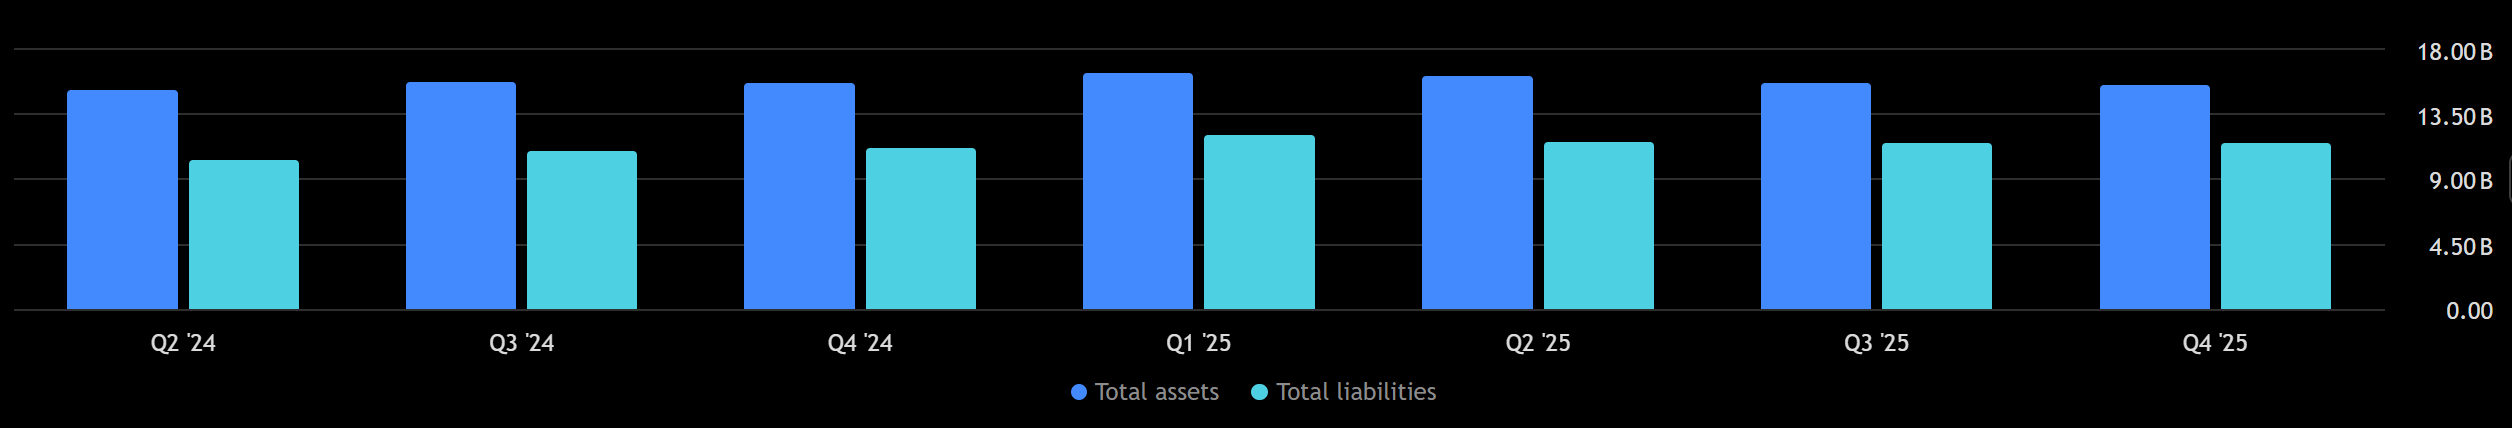
Capital allocation and balance sheet
Share repurchases remained near $1B in 2025 despite negative free cash flow.
Long-term debt increased to roughly $3.8B.
Net cash declined sharply, reducing balance sheet flexibility.
Molina is not distressed, but it is no longer insulated from prolonged pressure.
The business is still viable and relevant. However, expectations must reset to reflect lower near-term earnings power, weaker cash conversion, and higher uncertainty. The stock is no longer priced as a steady compounder, and it should not be analyzed as one until margins and cash flow normalize.
Technical Analysis
Price behavior confirms the fundamental reset.
The stock broke decisively below prior support zones on heavy volume. That matters because it signals acceptance of a new valuation regime, not just temporary fear.
Trend structure
Long-term trend has shifted from neutral to bearish.
Price is well below key long-term reference levels that previously defined value.
Medium-term momentum remains negative despite extreme oversold readings.
Support and resistance logic
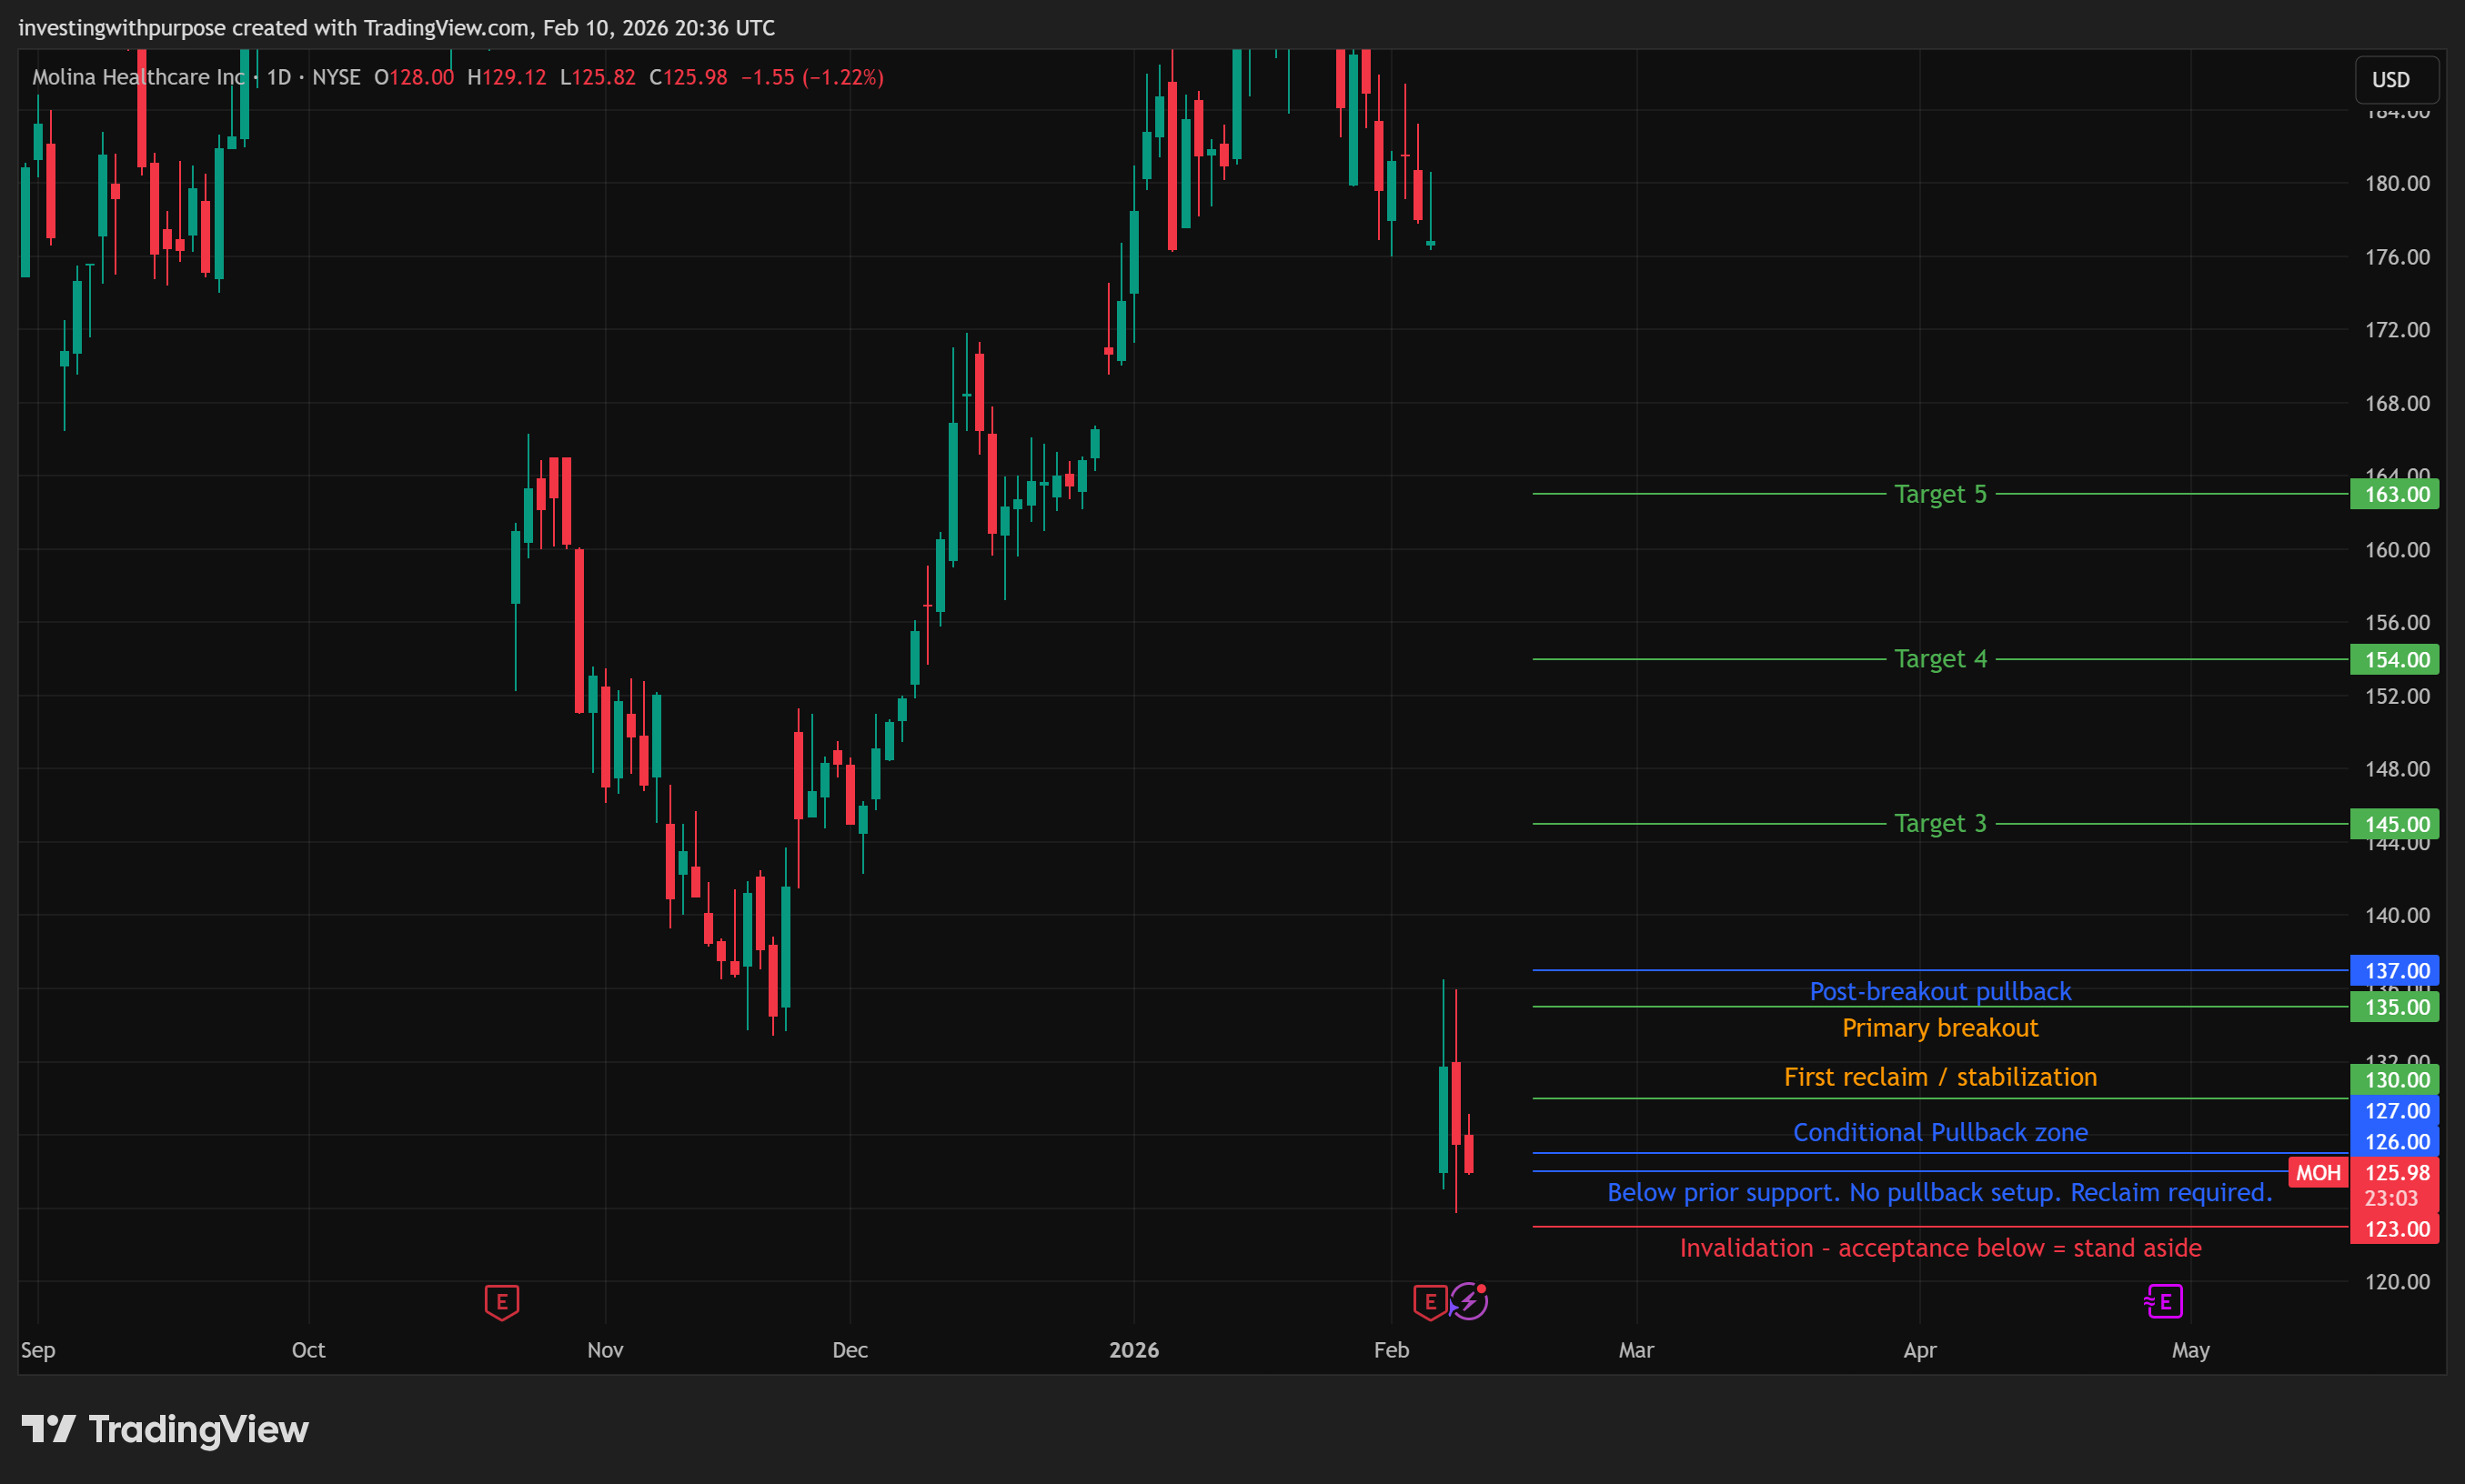
The 127 to 130 area represents the first meaningful demand zone. It aligns with prior consolidation and psychological support.
Failure to hold this zone would suggest continued price discovery lower.
The 134 to 135 region is the first reclaim level. It marks former support that now acts as resistance.
Above that, 145 represents a larger structural pivot where prior balance existed.
The 155 to 170 zone is the true trend repair area. Acceptance there would signal a meaningful change in character.
Momentum
Short-term momentum is deeply oversold, which increases the probability of a bounce.
Medium-term momentum remains bearish, which reduces the probability that the first bounce is durable.
Long-term momentum has rolled over, consistent with a regime change rather than a routine pullback.
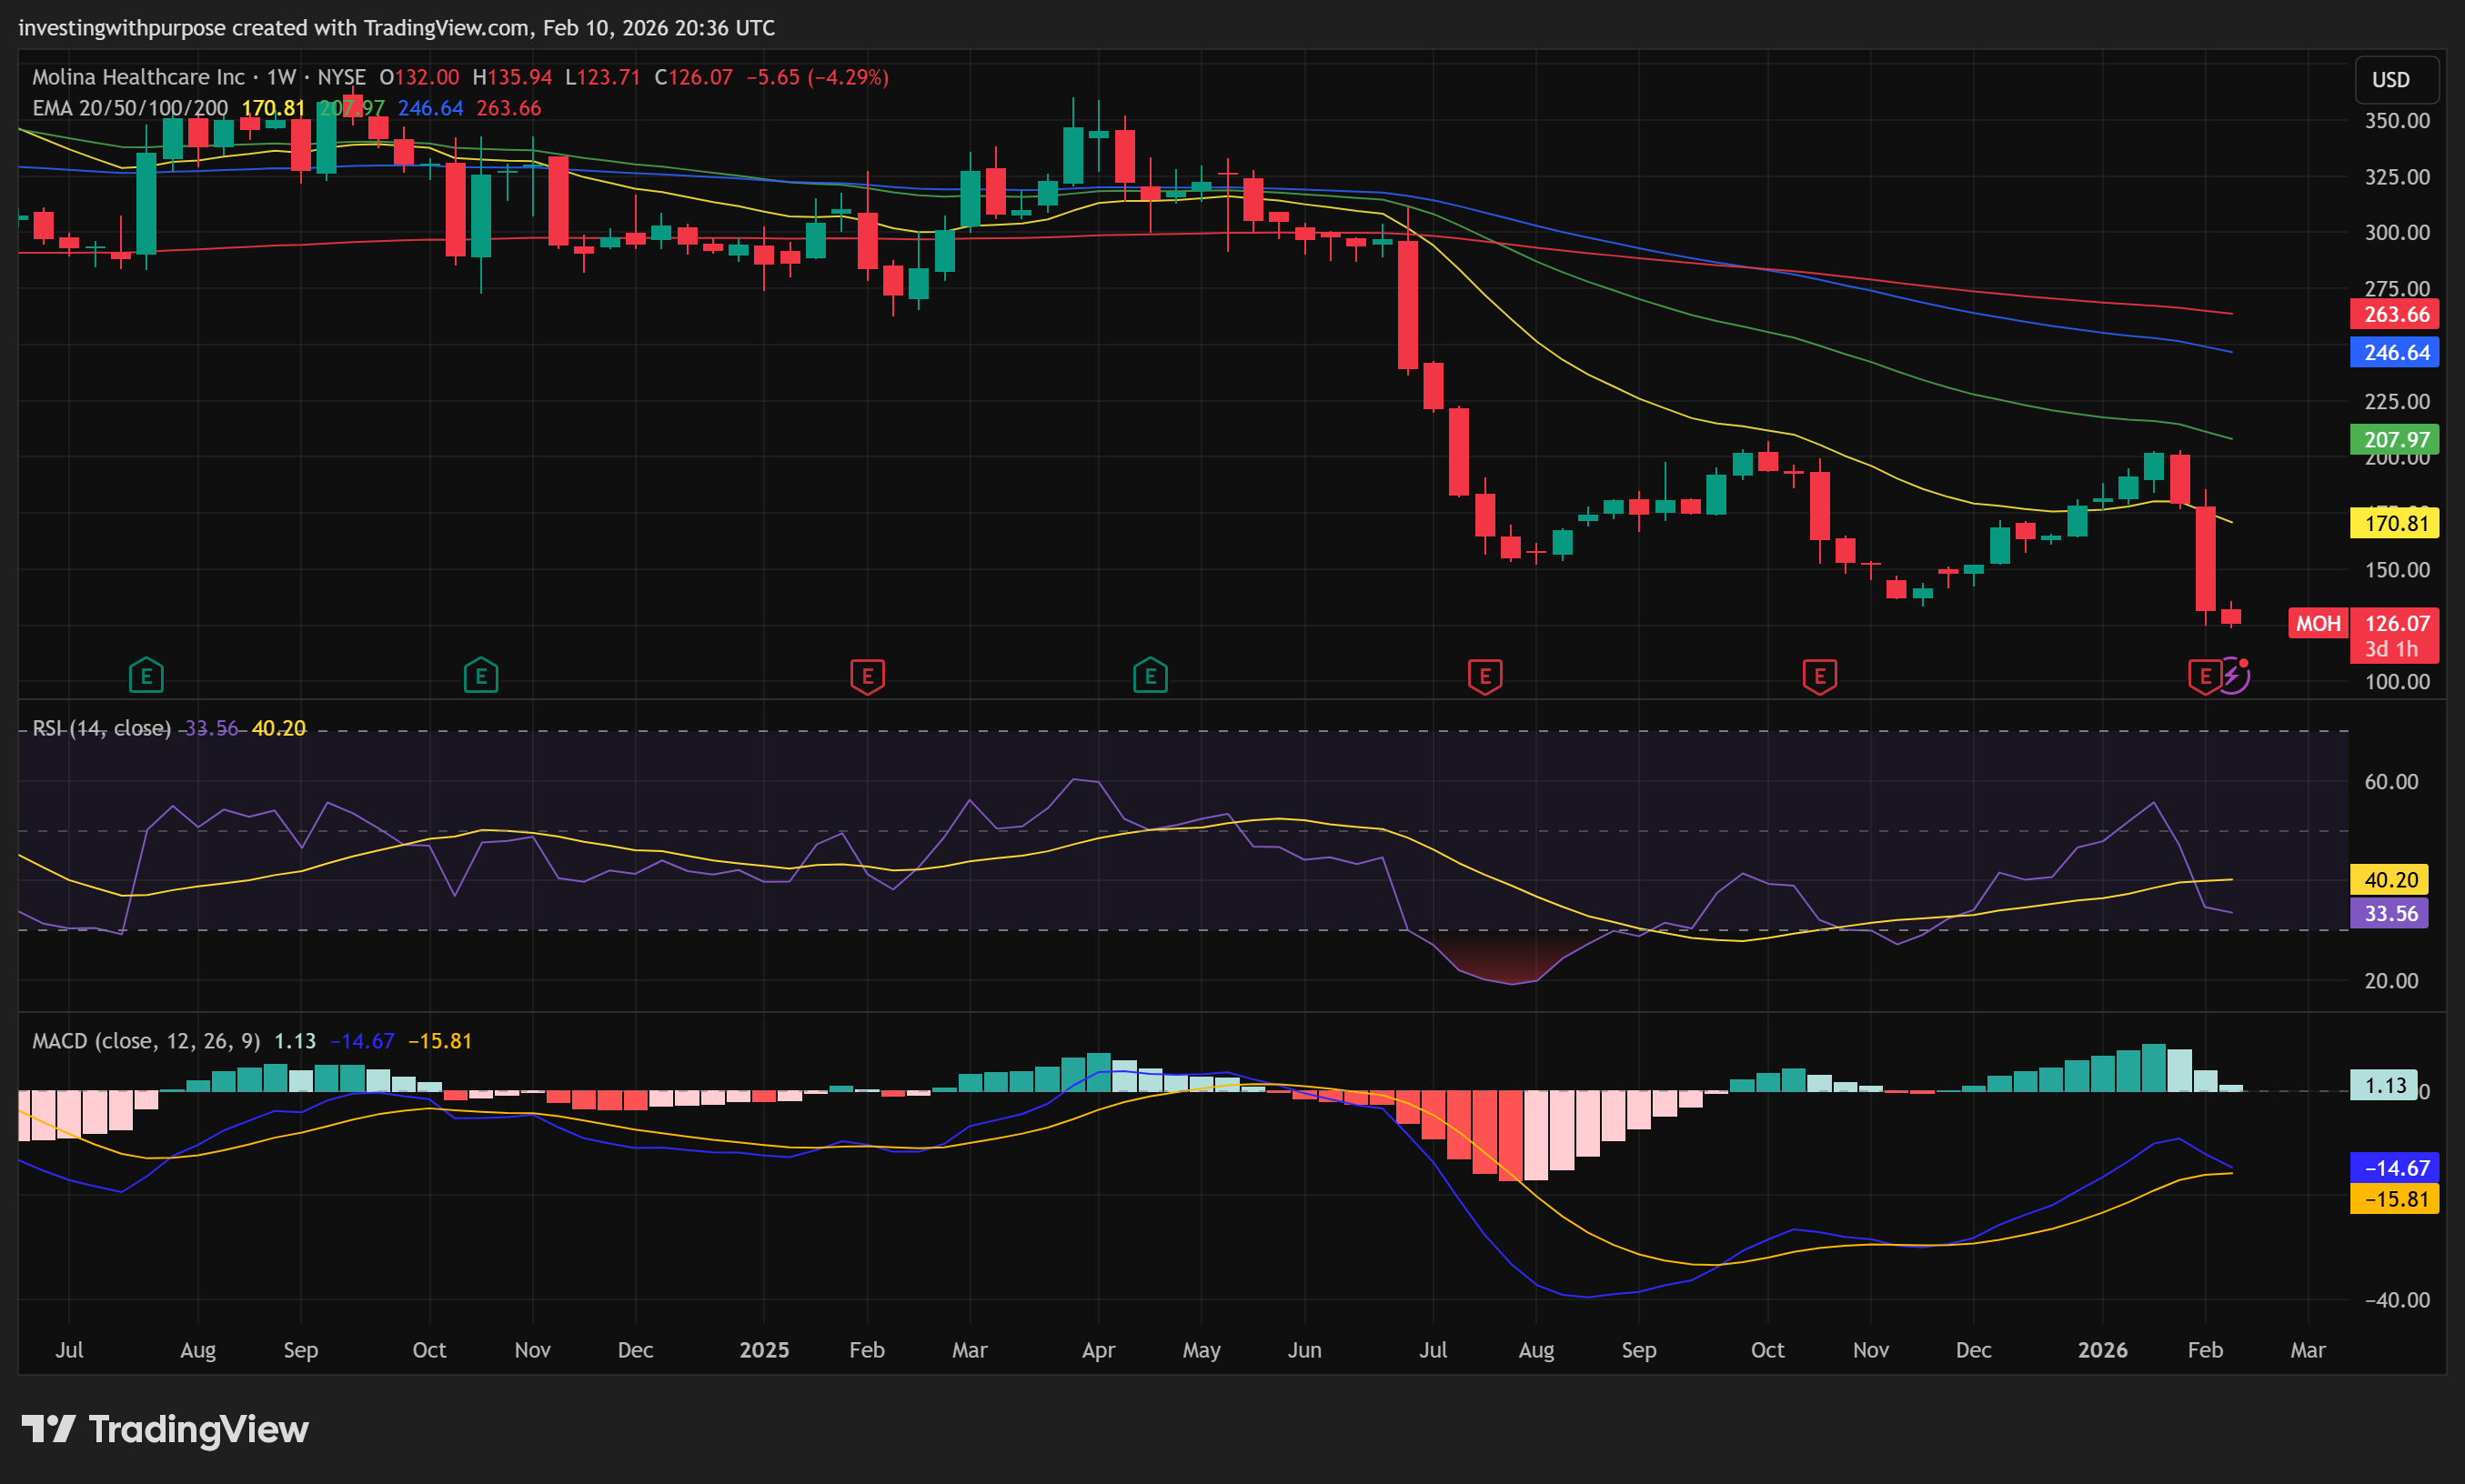
The stock is oversold but not repaired. Bounces are likely. Sustainable upside requires confirmation through reclaiming and holding key levels, not just reacting to oversold conditions.
Our Trade Plan
The 3 levels that matter most
127 is the line in the sand. If price accepts below it, the market is still in discovery.
135 is the first real reclaim. Getting back above it is the earliest sign the shock is being digested.
145 is the first major supply wall. If price clears it, you can start talking about a bigger mean reversion.
Pullback zones
Pullbacks only exist after price reclaims a level. From 126, that means pullbacks are conditional.
First valid pullback zone: 127 to 130 (conditional) This zone only becomes a pullback after price reclaims it from below and then comes back to test it.
Until that reclaim happens, this area is resistance, not support.Second pullback zone: 135 to 137 (post-breakout) This zone only matters after a confirmed breakout above 135. A pullback that holds here would be a higher-quality, more risk-adjusted entry.
Breakout zones
Because price is below former support, breakouts matter more than pullbacks right now.
First breakout zone: reclaim and hold above 130 This is the minimum requirement to stop active downside pressure. Without this reclaim, there is no technical base.
Primary breakout zone: daily close above 135 This is the real confirmation. It tells you the market has absorbed the shock and is willing to transact back above prior support.
Secondary breakout zone: acceptance above 145 Clearing 145 shifts the setup from “bounce risk” to “multi-week mean reversion.”
Invalidation
A daily close below 127 that fails to recover invalidates the stabilization thesis.
This level matters because it defines whether the market is building value or continuing discovery.
Hard invalidation: daily close below 123. A close below this level signals acceptance lower and continuation of price discovery. Any long exposure should be exited.
Targets
Targets are zones where supply is likely to appear, not promises.
Target 1: 130 First reaction level if price bounces. Expect resistance here.
Target 2: 135 Major decision point. This is where failed rallies often die.
Target 3: 145 Structural supply. Clearing this level meaningfully improves the risk-reward.
Target 4: 154 to 163 Upper resistance band. Reaching this requires sustained acceptance above 145.

Rolling stop logic
As price moves through each target zone, stops should trail to the prior support area.
This locks in progress while allowing room for volatility.
Risk-based sizing
Wider stops require smaller initial position sizes.
Increase exposure only as stop distance narrows and confirmation improves.
Never size based on conviction alone. Size based on risk.
At 126, Molina is not in a pullback. It is in price discovery. The first job is reclaiming 130. Until then, patience is the correct position.
Bottom Line
Molina Healthcare is not broken, but it is not ready either.
Fundamentally, earnings power and cash flow need time to recover. Technically, price needs to prove that it can stabilize and reclaim lost ground.
At current levels, this is a patience stock, not an aggressive buy. The risk-reward improves meaningfully only after confirmation above 134 to 135. The single most important invalidation level is 127.
For disciplined investors, the opportunity may come. It just has not arrived yet.
This analysis is for educational and informational purposes only and reflects personal opinions based on publicly available information. It is not investment advice, a recommendation, or an offer to buy or sell any security.
I’m a new subscriber and like all the data. Information can make one smarter. I’d love to see an analysis of SHOP