


Alibaba BABA 0.00%↑ has become 2 companies that want opposite things from the same balance sheet.
First, it’s a marketplace generating USD 5.86 billion of quarterly profit. The second company is an AI buildout that burned through USD 9.97 billion of capital in 3 months and produced a loss in the division meant to sell the output.
The first is paying for the second, and the math stopped working this year.
BABA closed Monday at USD 115.75, 39% below where it was last October and 62% below its 2020 peak. Analysts have a mean target of USD 185.90 on it, 61% above here.
Key Takeaways
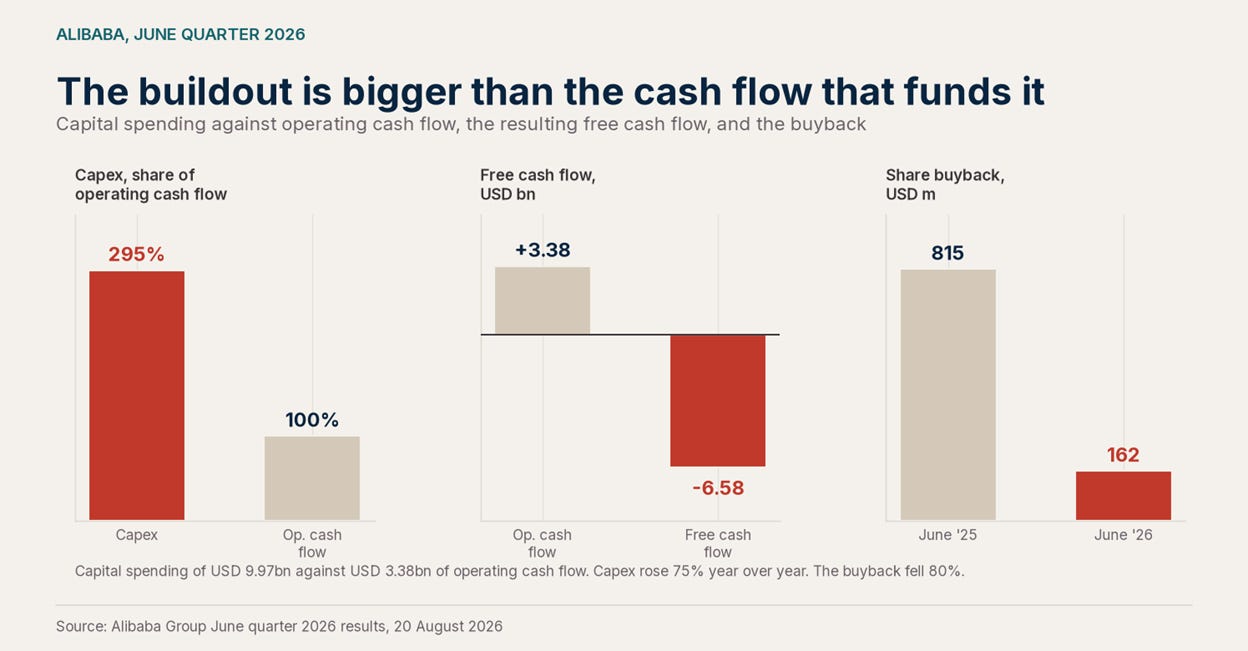
The buildout is bigger than the cash flow funding it. Capex of USD 9.97 billion (up 75% year over year) vs USD 3.38 billion of operating cash flow, with free cash flow of negative USD 6.58 billion.
China e-commerce is still strong at 41% of revenue, but it fell 8%. Quick commerce and AI cloud both grew 45%. The headline 9% blends those, and the half that's shrinking is the biggest and highest-margin part of the company.
The AI division loses money. AI Cloud earned USD 0.83 billion. AI Labs lost USD 2.04 billion, which is USD 4.15 of loss per dollar of its own revenue.
Buyback was cut by 80% to USD 162 million from USD 815 million.
Adjusted EBITA fell 30% and operating income fell 57% on revenue that grew 9%.
USD figures use 6.785 RMB/USD, the rate in the company’s own release.
BABA 0.00%↑ runs China’s largest online marketplaces, its largest public cloud, and a set of AI models that compete with other global players. Gartner ranks it fourth worldwide in infrastructure-as-a-service and first in Asia Pacific. Omdia put its share of China’s AI cloud market at 38.1% for 2025, up from 35.8%.
There’s also an ongoing lawsuit to consider. A securities fraud class action is pending that alleges Alibaba misstated its status under the 2025 defence authorisation act as a company tied to China’s industry ministry.
Fundamental Overview
Capital allocation
Alibaba spent USD 9.97 billion on PPE last quarter, while it generated USD 3.38 billion of cash from operations, about 1/3 less than it spent. CAPEX was also around 25.2% of revenue. 1 year ago, CAPEX was about USD 5.70 billion. Spending grew 75% while the cash paying for it grew 11%.
FCF also came out at negative USD 6.58 billion.
Something had to bridge that gap. The buyback did, falling to USD 162 million from USD 815 million (an 80% cut). Shareholders used to have the priority claim on this cash, but have since taken a back seat to AI spending.
Building the fourth largest cloud on earth is expensive, and those expenditures are starting to materialize. T-Head Semis had shipped over 560k AI chips by April, there’s around 100k Zhenwu accelerators that run on Alibaba’s own cloud, and external cloud revenue grew to 45%.
All this changes what it means to own BABA 0.00%↑. A year ago Alibaba was a cash-returning franchise with a cloud option attached. Today it’s a capital project with a side retail business.
Revenue segmentation
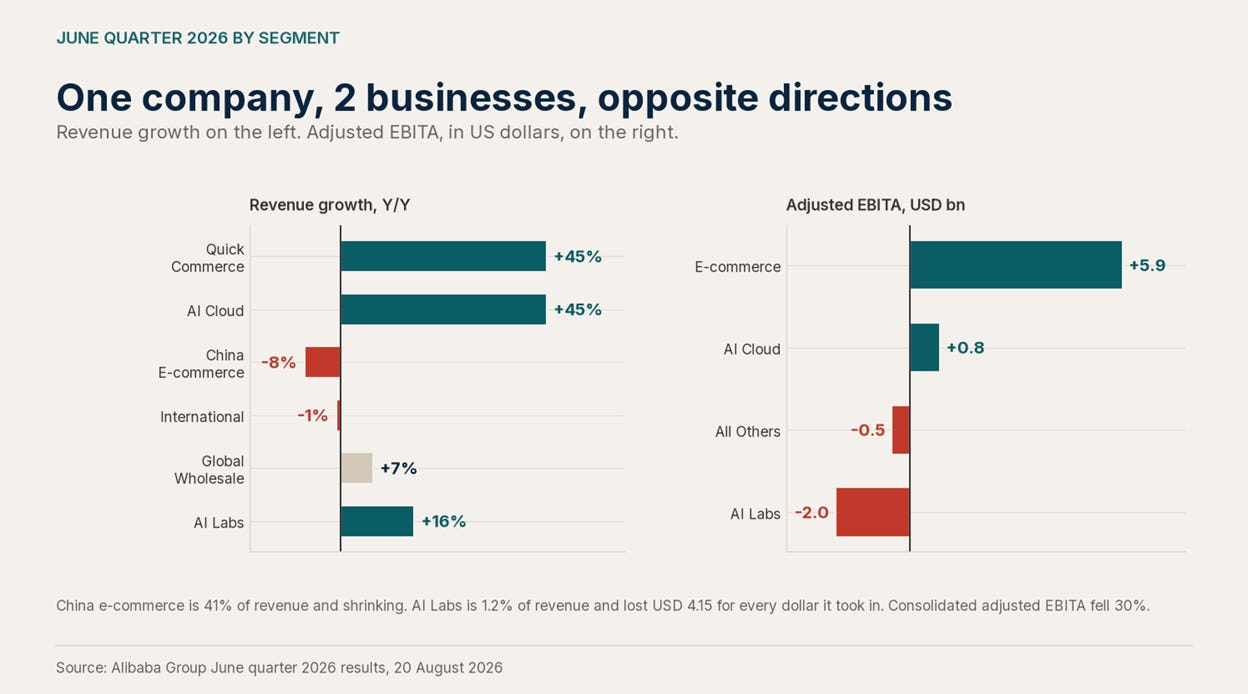
China e-commerce: USD 16.34 billion, down 8%. Still 41.2% of the company and the single biggest line.
China quick commerce: USD 7.85 billion, up 45%. Instant retail, a land grab with real prize money and negative unit economics nearly everywhere it’s been tried.
AI Cloud: USD 7.14 billion, up 45%, with AI products inside it at USD 1.82 billion, about 26% of the segment.
International: USD 4.09 billion, down 1%. Global wholesale: USD 2.05 billion, up 7%.
The e-commerce group grew revenue 4% and its adjusted EBITA fell 1%.
Growth that shrinks profit is a mix problem. The shrinking piece is the high-margin piece and the growing piece is instant retail, so nothing holding up the 19.3% margin is the part expanding.
What AI Labs costs
AI Labs and Applications made USD 0.49 billion of revenue and lost USD 2.04 billion at the adjusted EBITA level. A year earlier it lost USD 0.48 billion. Revenue grew 16% while loss grew more than 4x.
Alibaba reports AI in 2 pieces, and every report quotes the profitable one. AI Cloud made USD 0.83 billion. Put the 2 together and the AI division lost USD 1.21 billion in the quarter, with the applications loss running at ~2.5 times the cloud profit.
Qwen is part of that segment, and the models are good. Qwen3.8-Max runs to 2.4 trillion parameters and Omni-Flash takes text, image, audio and video across a million-token context. But that doesn’t make the AI business profitable.
Relative valuation
At USD 287.7 billion, what you’re paying depends entirely on which earnings you’re looking at.
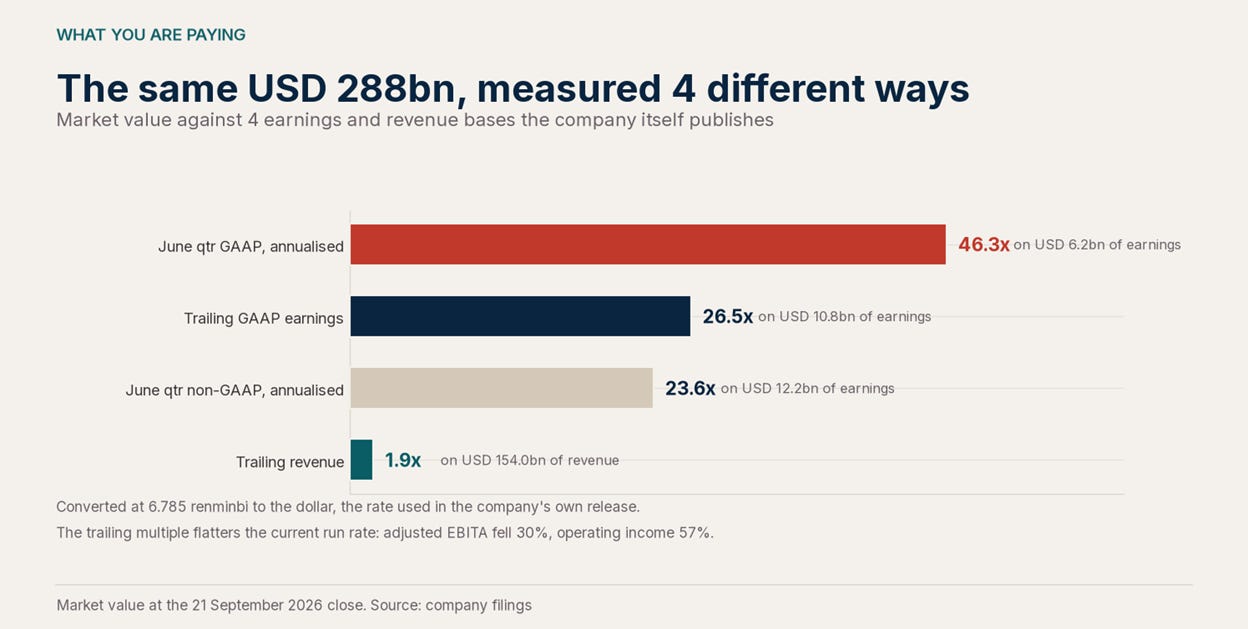
Trailing revenue of USD 154.0 billion gives 1.9x
The June quarter’s non-GAAP earnings annualised gives 23.6x.
Trailing GAAP earnings, 26.5x.
The June quarter’s GAAP earnings annualised, 46.3x.
The flattering one is trailing earnings, and it’s the most quoted metric. It contains quarters this company no longer produces. Adjusted EBITA is down 30%, operating income down 57%.
Annualise the outflow against the market value and the free cash flow yield is negative 9.2%.
Fundamental conclusion: the spending is defensible and the balance sheet can carry it. Debt to equity 0.25, current ratio 1.36, and cloud adjusted EBITA up 133%, so operating leverage is arriving where Alibaba is spending. What’s changed is the claim order. The core marketplace is shrinking, the growth inside the profitable division is margin-dilutive, and the AI division loses money once you count both halves.
Technical Overview
Weekly chart
The long picture is a broken uptrend that hasn’t repaired yet.
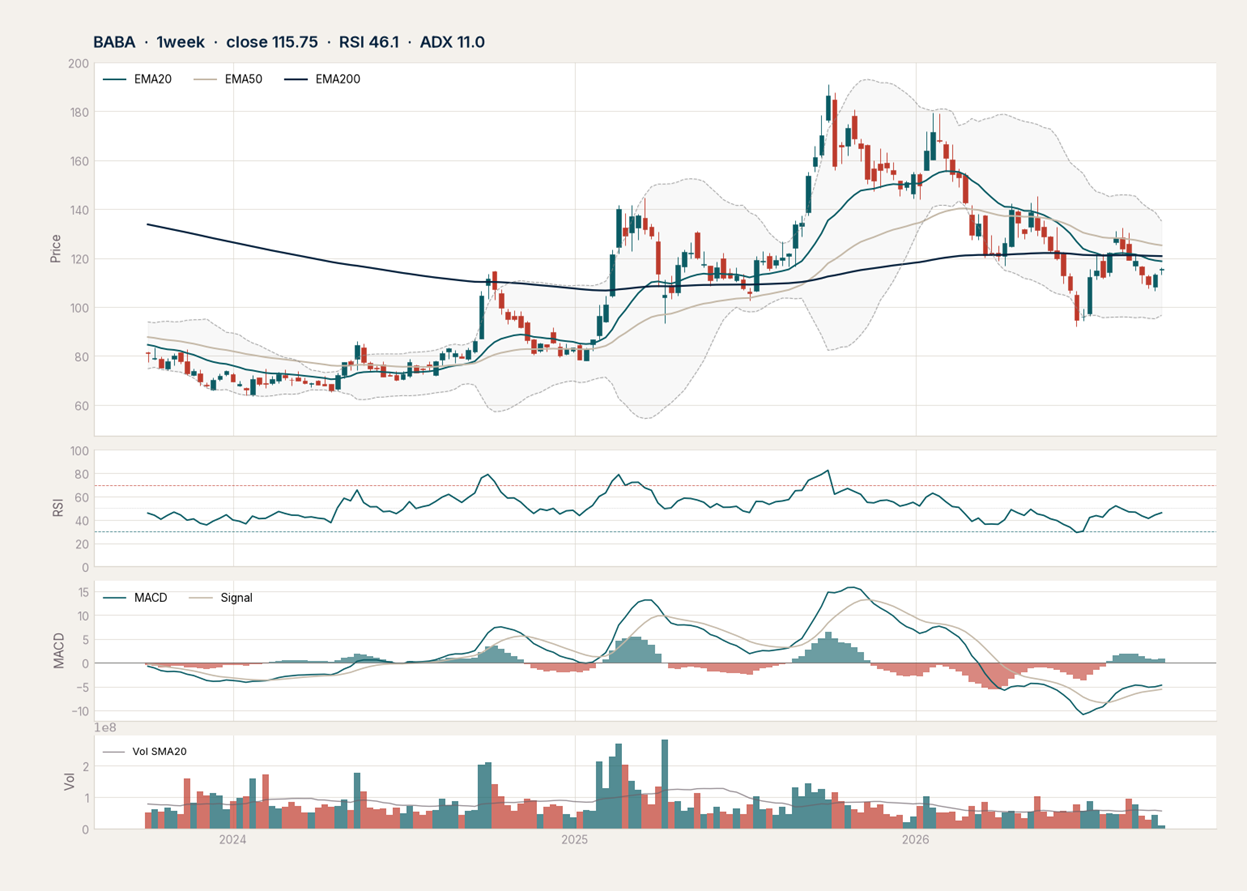
The week ended September 18 closed at USD 113.24, below all 3 weekly averages: the 20-week at USD 119.04, the 50-week at USD 125.63 and the 200-week at USD 120.36. It was the 5th consecutive week closing under the 20-week.
One thing still positive is that the 50-week is above the 200-week, so the multi-year structure hasn’t inverted.
Weekly RSI is 44.2. Weekly ADX, which measures how hard a trend is running, is 11.4. Under 15 means no trend at all on this timeframe, so this is more of a range than a downtrend.
The weekly Kijun, a midpoint of the last 26 weeks that often marks the floor of a trend, sits at USD 118.76.
Daily chart
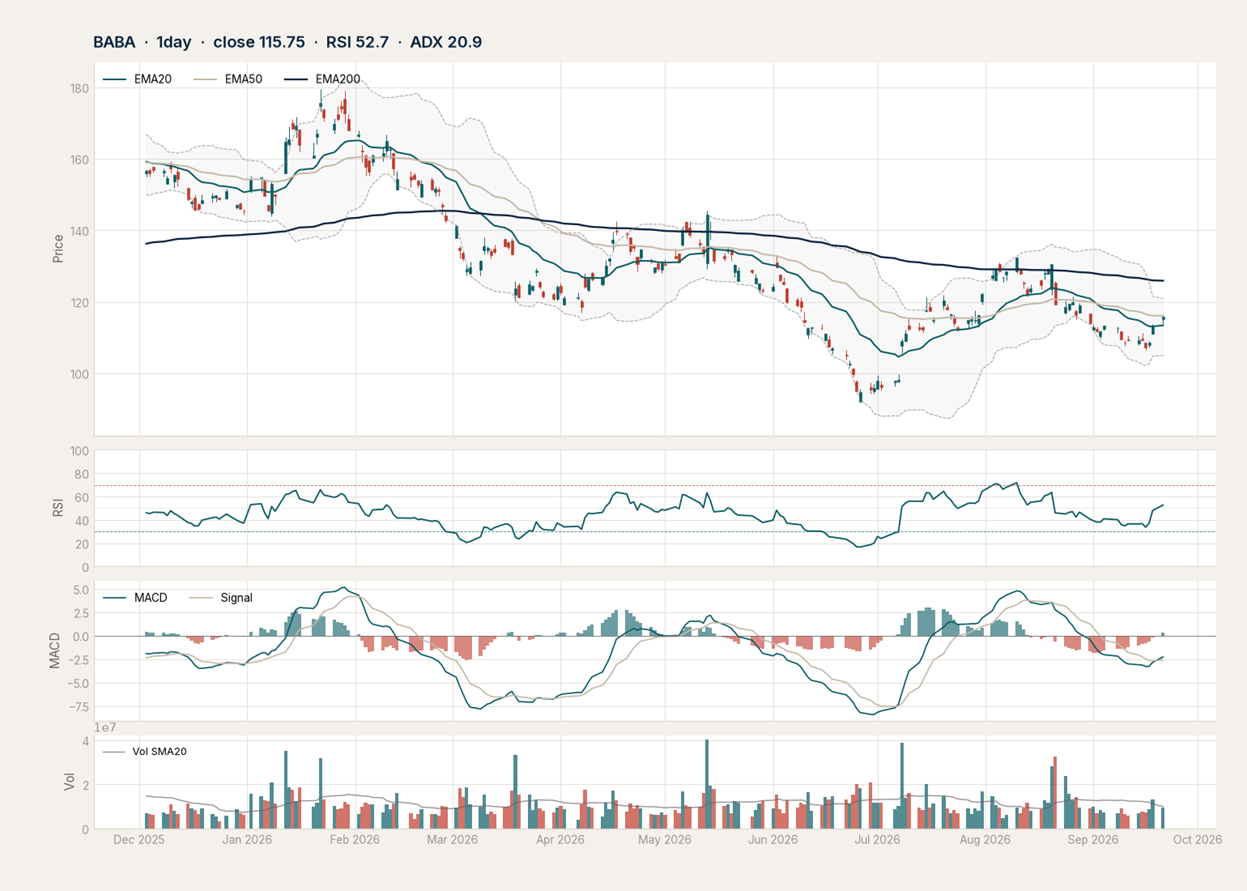
Friday ran 4.33% to close at USD 113.24, reclaiming the 20-day. Monday added 2.22% to close at USD 115.75. Price now sits USD 2.36 above the 20-day of USD 113.39.
RSI is 52.7, back above 50 for the first time since end of August.
ADX is 20.9, and the directional lines have crossed. +DI at 32.8 now sits above -DI at 31.6. Buyers have the edge for the first time since August 21.
MACD has crossed above its signal, -2.27 against -2.60. It’s still negative in absolute terms, so this means momentum is turning, but not good yet.
ATR is USD 3.16, about 2.7% of price, modest for BABA, so a stop sits further away than the chart makes it look.
Also the 21st straight session below the 200-day at USD 125.90, so nothing structural is fixed.
As for the levels, the 61.8% retracement of the run from June’s low to the USD 145.53 swing high sits at USD 112.44. Alibaba closed below it for 7 sessions straight and bottomed at USD 106.64.
Monday’s high was USD 116.20, the gate, tagged to the cent. The close was 45 cents underneath at USD 115.75. Every rally since July has died below that line, and this one walked up to it and stopped.
Since the June low, 32 of 60 sessions have traded down to the 20-day at some point.
Technical conclusion: a repair in progress, and 2 sessions further into it than last week. Weekly ADX at 11.4 still says no trend on the higher timeframe and price sits below every weekly average. The daily has reclaimed 1 moving average out of 4, though RSI, ADX and MACD all turned at once. What makes it tradeable is the reclaim of the 61.8% retracement at USD 112.44. What stops it being a buy here is the USD 116.20 gate, which Monday touched and failed to close through, on less volume than an average day.
The Trade Plan
Alibaba hasn’t set a date for the September quarter yet. It reported the same quarter on November 25 last year, so we can expect next earnings to be in around 2 months.
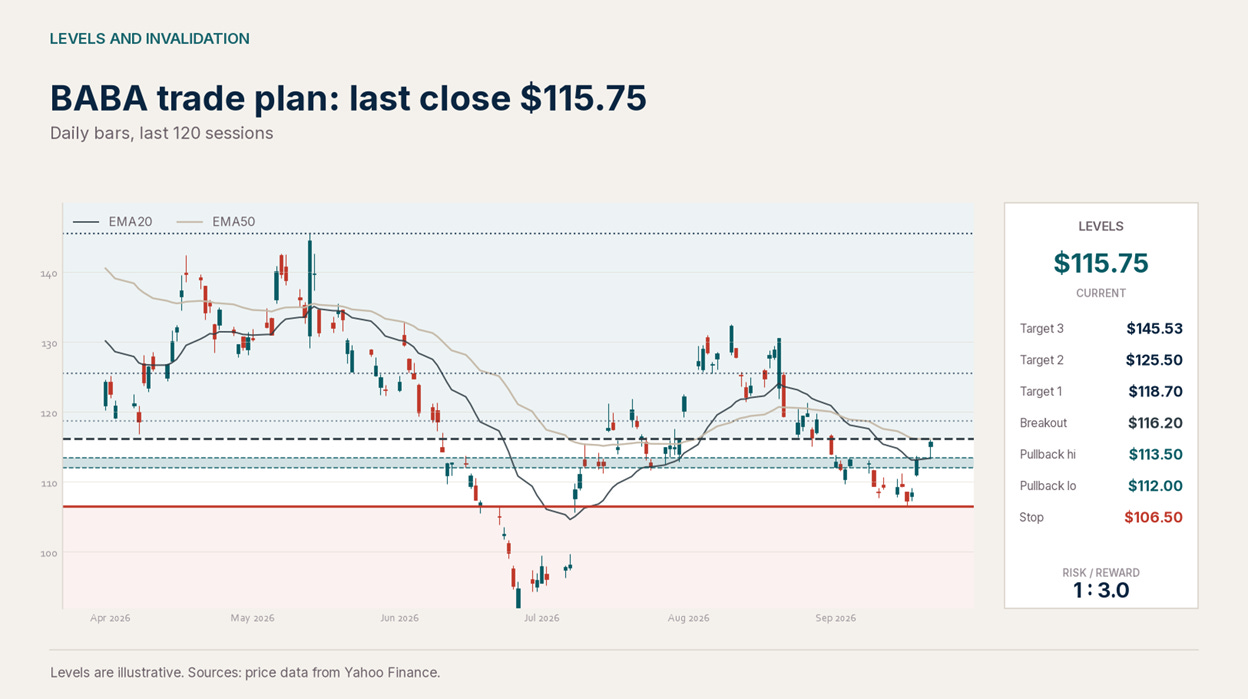
Entry zone: USD 112.00 to USD 113.50. Filled Monday morning, then vacated.
Hovers around the 20-day and the 61.8% retracement. This is a level to wait for.
Stop: a daily close below USD 106.50.
Just below the September 16 low of USD 106.64. From the middle of the zone that risks USD 6.25, or 1.98 ADR. This stock fell 52% between last October and June, so size for that.
Targets:
T1 USD 118.70, where the daily Kijun at USD 118.63, the weekly Kijun and the 50% retracement all cluster.
T2 USD 125.50, where the 200-day at USD 125.99 meets the 38.2% retracement at USD 125.08.
T3 USD 145.53, the swing high.
The level to watch is USD 116.20, and Monday touched it. The high was USD 116.20 to the cent and the close was USD 115.75, so price came to the line and got turned away on below-average volume. A daily close through it turns this from a bounce into something you can hold. That close is the trigger.
So there are 2 honest ways in from here, and buying Tuesday’s open isn’t either of them. Wait for a daily close above USD 116.20 and take the breakout with the 50-day underneath you. Or wait for price to come back to the zone, which 32 of the last 60 sessions have done at some point.
What the fundamentals change here. With free cash flow negative there’s no cash yield underneath to cushion a disappointment, and no buyback bidding for the stock the way there was 2 years ago. Smaller size, and take T1 and T2 when they come.
Conclusion
The cloud business is working. Alibaba has a defensible claim to being the AI infrastructure of the world’s second largest economy.
Right now the marketplace is paying for that, which shrank 8%, as well as shareholders who gave up 80% of their buyback. Free cash flow runs near negative USD 26 billion a year, and the applications arm is losing faster each quarter.
At 26.5 times trailing earnings none of that is priced as a disaster, and it shouldn’t be. It also isn’t priced as the largest capital program in the company’s history with nothing to show for it yet.
2 levels decide this, and Monday touched both. On the bottom side, 112.44, lost for 7 sessions this month and taken back on Friday. Monday’s gap fill retested it and held. On the upper side, 116.20, which has capped every rally since July. Monday’s high was exactly that, and it closed below it.
All content provided is for informational and educational purposes only and does not constitute investment advice, a recommendation, or an offer to buy or sell any security. The trade plans, levels, and scenarios discussed are illustrative frameworks based on market structure and are not guarantees of performance. Markets involve risk, and losses are possible. Past performance is not indicative of future results. Each reader is responsible for their own investment decisions, position sizing, and risk management.