


GOOG sits 13% below its record high after a violent June washout. Revenue grew 21.8% year over year in the March quarter, the average analyst target is 22% above the price, and the next earnings lands July 22.
The market’s biggest cash machine just got marked down. The question is whether the markdown is done.

2 months ago Alphabet was a momentum story pressing $404. Then late June happened: a washout week that dropped the stock to $334 on capitulation volume, a next-session reclaim, and now a quiet drift near $351 into the July 22 report.
Here’s the thesis in one breath: operating growth has caught up with the valuation, the multiple is reasonable rather than cheap, and the return on Alphabet’s enormous AI capex is the central risk that every earnings report has to keep answering. The stock is up 94% over the past 12 months yet trades at 24 times forward earnings, because profits grew into the price. And the June flush added the piece the rally never provided: a well-defined level to trade against.
Key Takeaways
The March quarter delivered Alphabet’s fastest year-over-year revenue growth in at least 3 years: $109.9B, up 21.8%, with operating income up 30% to $39.7B and operating margin at 36.1%.
Headline net income jumped 81%, but a large slice of that came from investment gains below the operating line. Judge the quarter on the 30% operating growth, not the 81%.
The multiple: 26.8x trailing (flattered by those gains), 24.0x forward, 10.1x sales. Fiscal-2025 EPS grew 34.5%, and the 3-year revenue trend runs about 12.5% a year.
AI capex is enormous and still climbing: $35.7B in the March quarter alone, $109.9B over the trailing year, compressing trailing free cash flow to $64.4B, a 1.5% yield.
The June flush to $334 was bought back the very next session. Support stacks at 336 to 346, hard invalidation sits below 328, and earnings land on Wednesday, July 22.
The Quarter, the Capex, and the June Air Pocket
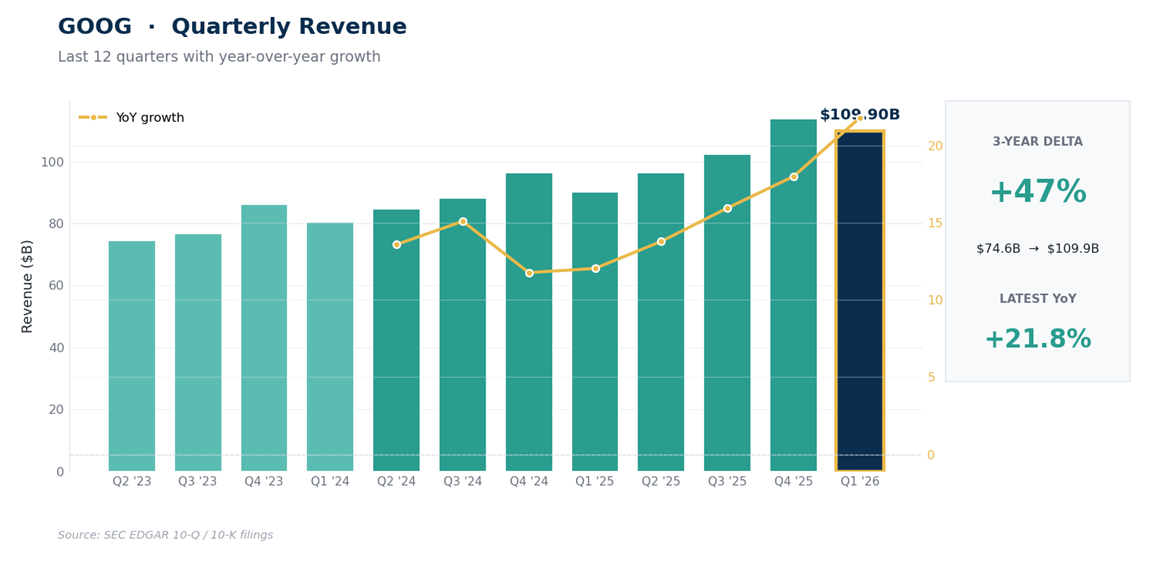
Start with the trajectory, because it’s the reason this stock nearly doubled. Quarterly revenue has climbed from $74.6B 3 years ago to $109.9B in the March quarter, a 47% expansion, with growth accelerating from around 12% in early 2025 to 21.8% in the latest print. Operating income rose 30% year over year to $39.7B, faster than revenue, so the core business is still gaining leverage even while funding the heaviest investment cycle in its history. Calendar-2025 revenue came in around $403B, up 15% on the year.
The investment cycle is the other half of the story. Alphabet spent $35.7B on property and equipment in the March quarter, more than double the $17.2B it spent a year earlier, and $109.9B over the trailing year. Nearly all of it is AI infrastructure: data centers, custom silicon, networking, power.
The whole hyperscaler group is in the same arms race (Meta just took a single Louisiana data center’s budget from $27B to $50B). Capex anxiety, a tech-wide selloff, and a 10-year Treasury at 4.6% likely all fed the late-June air pocket: on June 26 the stock closed at $334.69 on about 82M shares, nearly 4 times its average volume. The very next session it closed back at $351, then ground to $365 in early July before drifting back.
That immediate reclaim suggests larger buyers were willing to absorb supply near $334. One successful defense doesn’t establish a permanent floor, but it marks the level everyone is now watching.
The Fundamentals
Over the trailing 12 months Alphabet produced $422.5B of revenue at a 60.4% gross margin, generated $174.4B of operating cash flow, and earned a 39% return on equity while carrying almost no leverage (debt to equity of 0.20, current ratio of 1.9). The March quarter’s 36.1% operating margin was the best of the last 5 quarters.
One asterisk belongs on the profit line. Reported net income of $62.6B in the March quarter exceeded operating income of $39.7B, which tells you more than a third of the headline profit came from below the line, mostly gains on equity investments getting marked up.
That’s real value, but it isn’t repeatable operating profit, and it flatters both the 81% net income growth and the trailing P/E of 26.8. The forward multiple of 24.0, built on estimates that ignore those marks, is the honest anchor for the valuation debate.
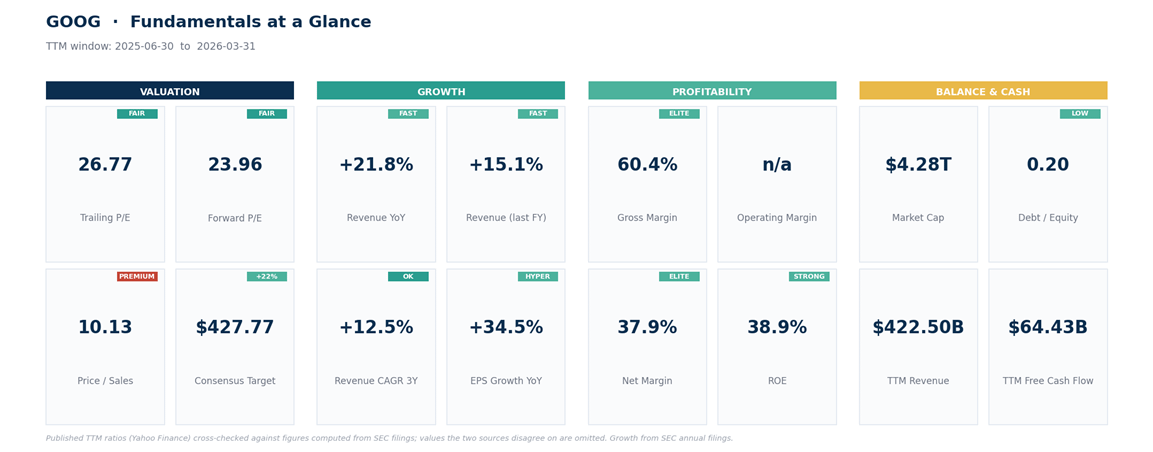
So, is it cheap? Cheap is the wrong word; reasonable is. The honest comparison is forward against forward: 24 times next year’s earnings for a company whose revenue has compounded at about 12.5% a year over the past 3 years and just accelerated to 21.8%. If the acceleration holds, the multiple is undemanding.
If growth settles back toward trend, it’s full but fair. Street positioning is heavily bullish, with 58 of 65 ratings at buy or strong buy and a mean target of $428. That supports the quality narrative, but it cuts both ways: it leaves limited room for incremental upgrades, and it says bullish expectations are already embedded in the price.
The real bear case runs through cash flow. Free cash flow of $64.4B over the trailing year is a 1.5% yield on the market cap, compressed by capex that has roughly doubled in 2 years. How worrying that is depends on a split you can’t see from outside: how much of the $110B is required to defend the existing business, and how much is discretionary investment in future revenue.
The more it’s the second, the more today’s yield understates the underlying economics; the more it’s the first, the more the old cash machine is simply gone. Either way the math only works while revenue keeps accelerating, and that’s the question every print has to answer, including the one 8 days from now.
The Technical Picture
The weekly trend is doing fine. Price sits at $350.67, still above the 20-week average near $346 and far above the 50-week near $307, and weekly RSI, a 0-to-100 momentum gauge, reads 54: cooled from the May highs but still bullish. Weekly MACD has slipped below its signal line, meaning the rally’s pace is fading, while ADX 27, a measure of trend strength, still points up: the larger trend hasn’t broken.
The most telling stretch of the tape is the late-June pair: a huge-volume plunge week to $334, answered by a recovery week that took back nearly the whole drop. That pattern usually reads as absorption rather than distribution, though one episode doesn’t settle the question.
The daily timeframe is where the indecision lives. GOOG has spent 2 months inside a 334-to-404 range. The 20-day and 50-day averages have gone flat and converged right on top of each other near $357, price closed just below both, daily RSI is a soft-neutral 44, and the trend-strength gauge is at 13, a reading that says there’s no daily trend, just range. The daily MACD histogram has ticked positive, meaning the downward momentum from the May top is fading, but the line itself is still below zero.
The short-term dip looks stretched. On the 4-hour timeframe sellers have had the recent edge, the fast StochRSI oscillator is pinned near 10, deeply oversold, the kind of reading that usually precedes a bounce, and price is sliding into a shelf of support: the 100-day average at $344.6 and the 20-week average at $346.1 sit between 344 and 346, with the June flush zone at 336 to 340 and the June low at 334 underneath. Overhead, the flat daily averages at 356 to 360 are the first hurdle, the July recovery high near 365 and the weekly ceiling at 368 are the second, and beyond that the road opens toward 385 and the 404 record.
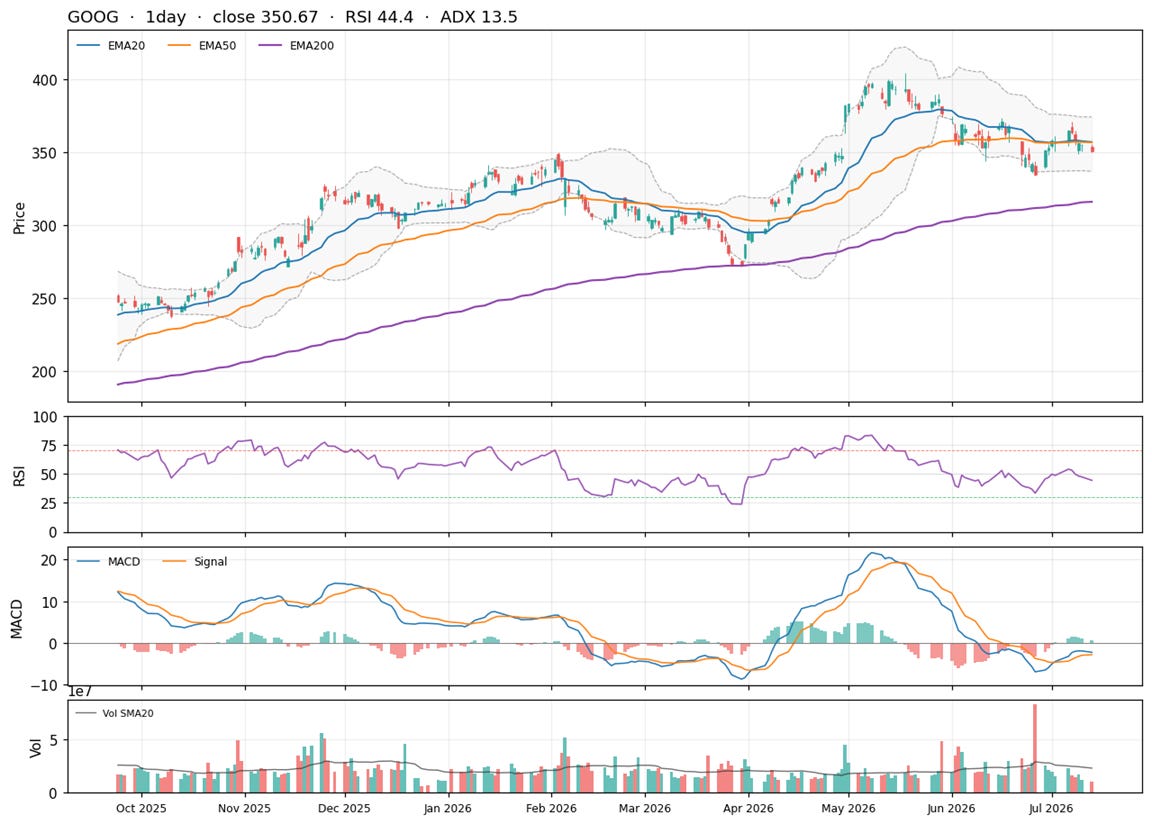
Net read: the long-term uptrend is intact, the medium term is a wide range with a defended low, and the short term is stretched into layered support with a binary catalyst 8 days out. That’s a buy-weakness-at-levels setup, not a chase.
How to act on it.
The Trade Plan
GOOG
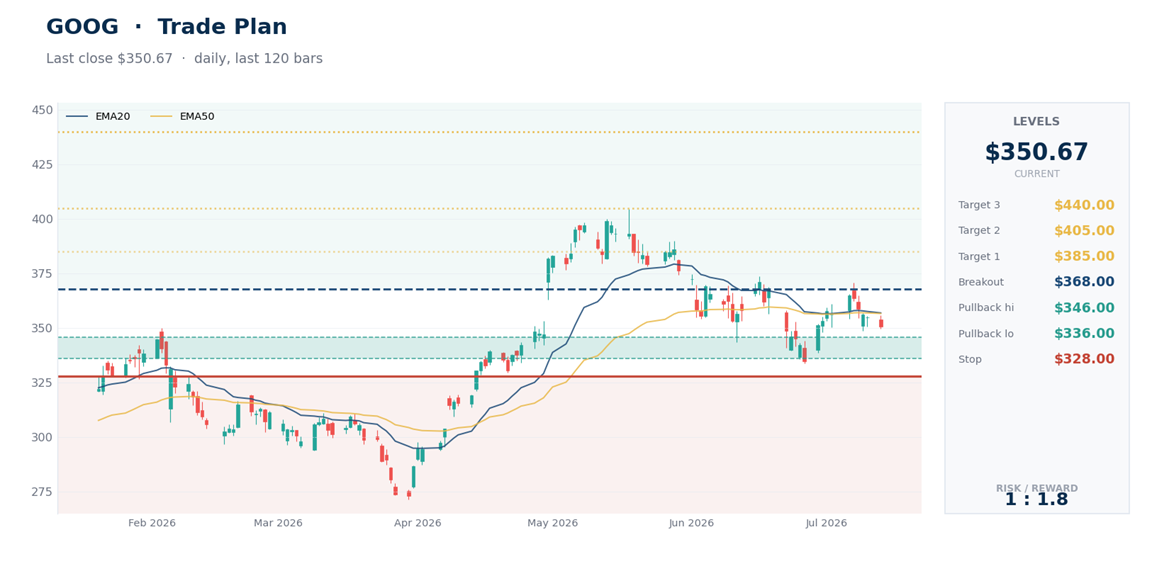
Starter entry: 344 to 346. The 100-day and 20-week averages both live here, and price is only about 5 points above it. First touch gets a starter position, not a full one.
Add zone: 336 to 340. The shelf where the June flush was absorbed. A retest that holds is the better-priced entry with the tightest distance to invalidation.
Breakout alternative: a daily close above 368. That clears the July recovery high and the weekly ceiling, for those who’d rather pay for confirmation than catch a dip in front of earnings. If it triggers, the stop is a close back under 356, not 328.
Warning level: 334, the June low. A daily close below it isn’t the stop, but it means the defense is failing: stop adding and tighten up.
Invalidation: a daily close below 328. That takes out the June low and the April shelf at 330 with room for an undercut, and it’s the exit for both buy zones.
Targets: 385 first (the late-May supply shelf), then 405 (the record high), then 440 (the range height added to the 368 trigger, just past the Street’s $433 median target).
Rolling stop: when 385 trades, lift the stop to your entry zone. If 405 breaks, trail the stop under each higher weekly low. Every target reached builds structure the stop can lean on.
The calendar is part of the plan. Alphabet reports the June quarter on Wednesday, July 22, 8 days from now, and with a daily trading range that has averaged about 10 points, the print will move the stock more than any level will. Half-size entries before the report or waiting for the zones to be retested after it are both defensible. Oversizing in front of a binary print is not.
On sizing: the roughly 5% between a $345 entry and the $328 stop is position risk, not portfolio risk, and the difference matters. Decide first how much of your portfolio a failed trade is allowed to cost, then divide that by the trade’s risk to get the position size. A 0.5% portfolio budget against 4.9% trade risk caps the position near 10% of the portfolio; a 1% budget allows about 20%. Wider stop, smaller position.
Bottom Line
The premise that Alphabet looks cheap is half right, and the half that’s right matters more. It isn’t cheap in absolute terms, and the trailing multiple is flattered by investment gains. But 24 times forward earnings for this growth, margin structure, and balance sheet is a reasonable price for one of the best businesses in the AI buildout. What would prove the thesis wrong isn’t only a price level: a July 22 report that shows revenue decelerating while capex guides higher still would be margin compression without the growth to pay for it, and the multiple would deserve to shrink.
Until then, while 334 holds, weakness remains technically constructive; a decisive break below it would materially weaken the setup, and a close below 328 ends it. Keep the first bite small and let the report speak.
This is research and commentary, not personal investment advice. Levels and trade plans are illustrative; size positions to your own risk tolerance and time horizon. The author may hold positions in names discussed.
Alphabet’s 22% growth at reasonable valuations positions it as a compelling core holding for long term wealth accumulation