


Revenue accelerated to 24% growth, Google Cloud grew 82% with segment operating income more than tripling and a $514B backlog, and the stock fell anyway, because the same release raised 2026 capex guidance to $195B to $205B and printed a rare negative free cash flow quarter. Premarket trading is testing our July 14 framework’s support zone as this publishes.

The quarter proved the machine. The reaction priced the bill.
Start with what happened to the stock, because our July 14 piece is on the record. That article, written at $350.67, called the July 22 report the decider and drew a map: a starter zone at 344 to 346, an add zone at 336 to 340, a breakout trigger at a daily close above 368 with its own stop at 356, a warning at a close below 334, and a hard invalidation below 328. The market then ran most of it.
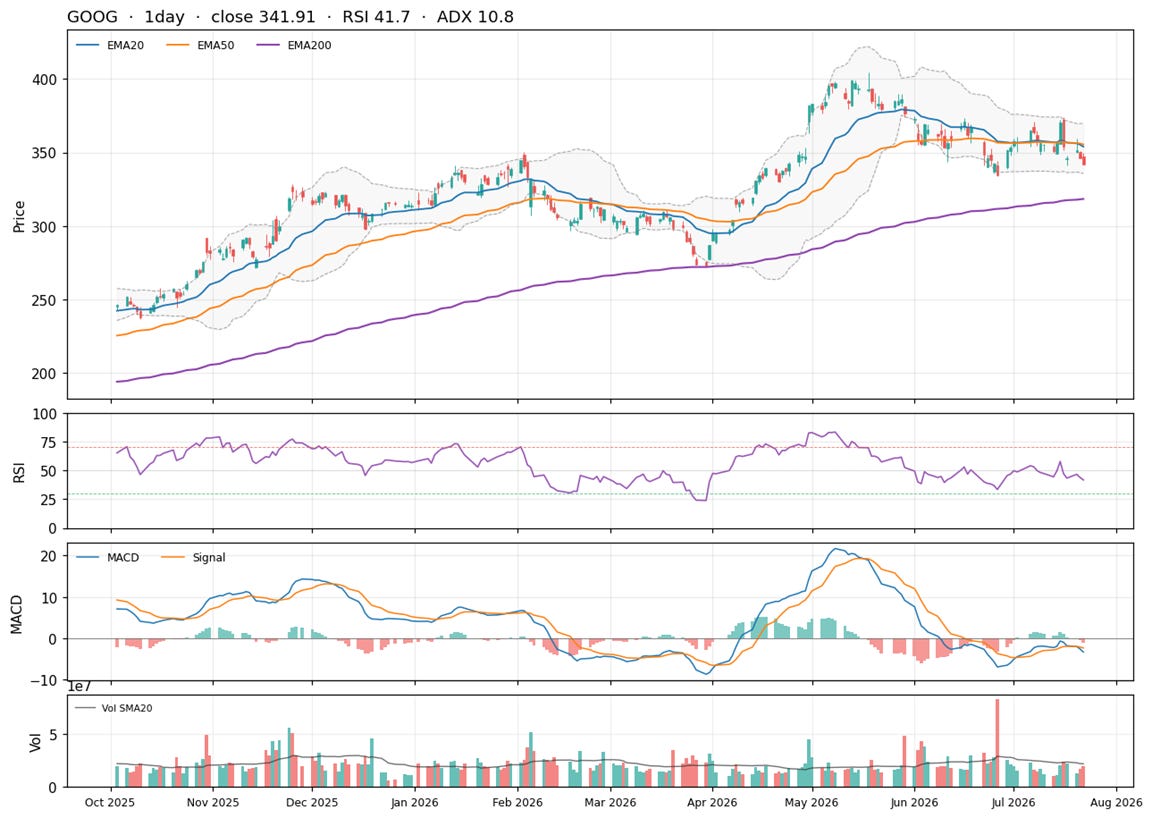
The stock closed above the trigger at $370.20 on July 15, failed it the next session (the breakout tier’s own 356 stop exited that attempt for about a 4% loss instead of an 8% ride), drifted down through the starter zone, and closed at $341.91 on July 22, just ahead of the print.
Then Alphabet reported, and the stock fell further: about 3% lower in premarket trading as I write, which puts it on the June double bottom and inside our 334 to 338 support zone. The formal warning remains a daily close below 334; premarket prices don’t trigger it. Prices below are based on the July 22, 2026 close; results are from Alphabet’s release as carried by press summaries the same evening.
Key Takeaways
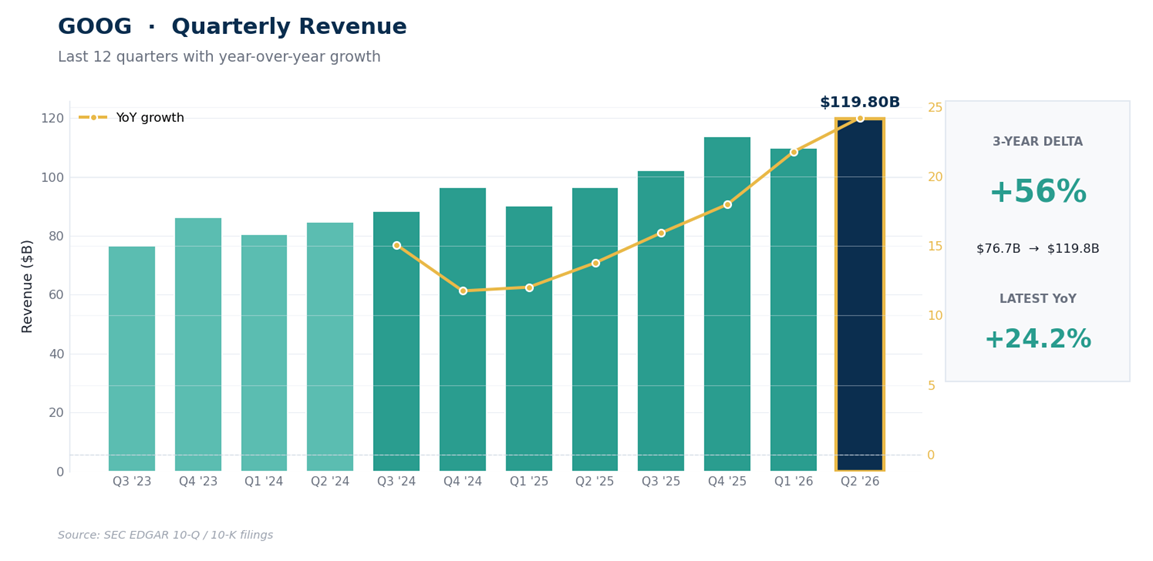
The quarter accelerated: revenue of $119.8B grew 24%, up from 22% last quarter, with Search up 17%, YouTube up 13%, and operating income up 30% to $40.8B.
Cloud was the event: revenue up 82% to $24.8B, segment operating income more than tripling as the margin expanded from 20.7% to 35.6%, and backlog swelling past $514B, up more than $50B in a quarter.
The bill was the counter-event: quarterly capex of $44.9B (up 107%), full-year guidance raised to $195B to $205B, 2027 guided to “increase significantly,” and quarterly free cash flow of negative $5.9B versus positive $10.4B a year ago.
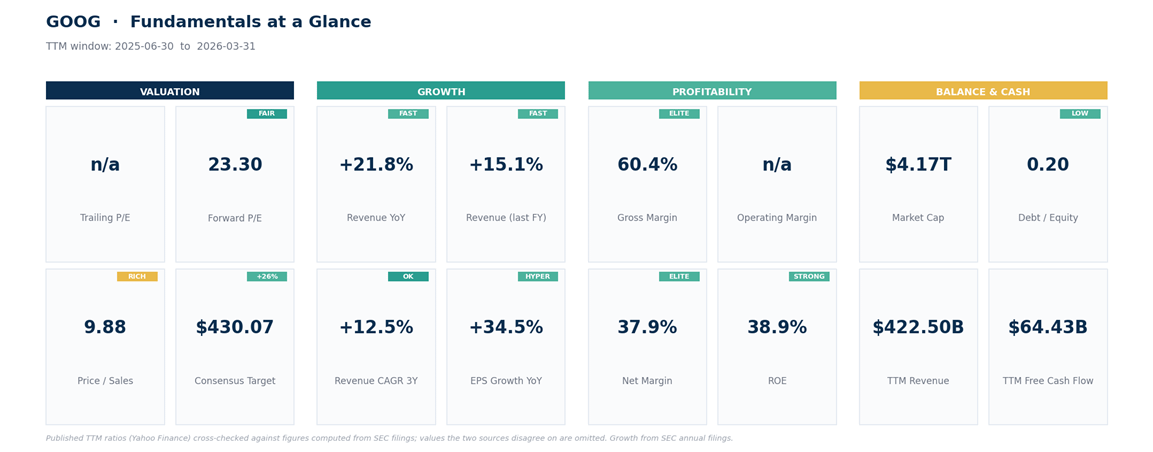
The accounting asterisk is at maximum volume: headline net profit growth near 300% was driven overwhelmingly by investment gains flowing through other income. Those gains push the trailing P/E to a screen near 17x, but they make it a poor representation of recurring earnings power; the 23.3x forward multiple is the cleaner anchor.
The framework state: premarket is testing the 334 to 338 support zone, the formal warning is a daily close below 334, invalidation 328, repair above 357. Next report: expected late October.
The Machine: Better Than the Thesis Needed
Our July 14 case was that 24x forward for 22% growth was reasonable if the growth held. The growth didn’t hold; it accelerated. Revenue of $119.8B rose 24%, the fastest quarter of this cycle, and the mix improved with it: Search still compounding at 17% off an enormous base, and Cloud, the segment the capex is supposedly for, growing 82% while segment operating income more than tripled and the margin expanded from 20.7% to 35.6%.
The backlog detail matters most: $514B of contracted future Cloud revenue, up more than $50B sequentially, is the closest thing Alphabet discloses to proof that the data centers being poured today have demand attached. Management’s posture matched the numbers, with Pichai calling the shift “very early innings.”
The Bill: Bigger Than the Bear Case Said
Our July 14 bear case worried that “$110B-plus of annual capex becomes permanent.” Reality outbid it. Quarterly capex hit $44.9B, up 107% from a year ago; full-year guidance moved to $195B to $205B, raised from $180B to $190B; and 2027 was guided to “increase significantly” beyond that. The consequence printed in the same release: free cash flow for the quarter was negative $5.9B, against positive $10.4B a year ago, a rare negative print for one of the index’s largest cash generators. Alphabet spent more building than it collected.
That’s why the stock fell on an accelerating quarter, and the reaction isn’t irrational: a company spending roughly $200B a year has converted the valuation debate from “what are the earnings worth” to “what is the spending worth,” and the market charges for that conversion in multiple points.
The honest counterweight comes from inside the same report. The Cloud margin expansion is direct evidence that the last capex cycle earned its keep, and a substantial portion of the future demand is already contracted, although the duration, conversion schedule, and economics of that backlog still matter.
The risk is the one that follows from the size of the bill: if backlog conversion or Cloud margins stumble while $200B a year is going into the ground, the multiple has a long way down. Nothing in Cloud demand, growth, or segment margins showed an operational stumble in this print; the deterioration lives on the cash flow line, and that’s a spending question, not yet a demand question.
The Accounting Lag
This quarter carries 2 accounting distortions pulling in opposite directions, and both matter more than usual.
The first inflates the bottom line. Filed net income was $112.19B, up 298% and far above operating income, because unusually large investment gains flowed through other income (per the quarterly filing). Those marks are real, but they aren’t the advertising and Cloud engine, and they reset the trailing P/E to a screen near 17x that makes Alphabet look cheaper than its recurring earnings power justifies. The forward multiple of 23.3x, built on estimates that exclude the marks, remains the cleaner anchor, exactly as it was in July.
The second flatters current margins. Most of the infrastructure spending is capitalized rather than immediately expensed, so today’s Cloud margins don’t yet reflect the full depreciation burden of the current buildout.
The real test is therefore not only whether backlog converts, but whether incremental Cloud gross profit grows faster than the depreciation, power, and operating costs that follow the capex into future periods. Both of these can be true at once: Cloud margins improving today, and the current spending wave pressuring margins for years even if demand holds up.
The Framework Audit, and the New Map
Score the July 14 plan honestly. The breakout tier fired on July 15’s close at $370.20 and failed within a session; its separate 356-close stop, added after an editor asked why a breakout buyer should carry an 11% stop, turned an 8% round trip into roughly a 4% controlled exit. The starter zone at 344 to 346 filled and closed the pre-print session about 1% underwater.
The warning at 334 and invalidation at 328 were never touched before earnings. Premarket trading is now testing the 334 to 338 support zone, but the formal warning remains a daily close below 334, and no such close has happened. The design is doing its job so far, which is all a framework can promise on the wrong side of a news gap.
The updated map, daily timeframe, all triggers meaning daily closes:
Support: 334 to 338, the June double bottom (333.69), the halfway retracement of the spring rally ($338), and the lower volatility band. The premarket is testing it now.
Invalidation: a daily close below 328, unchanged from July 14. Below it, the 61.8% retracement at $322 and then the springtime shelf near $300 are the references, and the story would have changed from digestion to repricing.
Repair: a daily close above 357 reclaims the flattened 20-day and 50-day averages, with references above at 368 (the failed trigger), 386, and the $404.47 record.
An accelerating business, a de-rated multiple, and a stock returning to the floor that defined its summer, this time on a bill everyone can now see. Whether 334 holds on a closing basis this week is the referendum the earnings didn’t settle.
One possible framework, not a promise.
