


A dominant business’s first real pullback usually deserves a second look.
Alphabet is spending more on AI than anyone, and it’s still printing more cash than almost anyone. That’s the whole pitch in one sentence. The market cheered the combination right into a $404 record, then gave back about 7%, and now the conversation gets more interesting.
Is this the first real cooling of a trend that’s been straight up since the spring, or a routine test of the rising 20-day average that lets longer-term holders add at a better price? Most of the answer is in the numbers, with 2 asterisks worth knowing before you draw the trendline.

Key Takeaways
Revenue is accelerating. Alphabet booked $109.9B of revenue in the March quarter, up 22% YoY, with operating income climbing about 30%. The reported net-income line jumped roughly 81%, but most of that came from a one-time $37B gain on equity-investment marks, so the real operating number is the 30%.
The capex story is the story. Spending on property and equipment ran $35.7B in the March quarter and roughly $110B over the trailing year, up from about $55B 2 years ago. Alphabet also closed its $33.6B Wiz acquisition during the quarter.
The cash machine still prints. Operating cash flow ran $174B over the past year, free cash flow stayed positive at about $64B even after record capex, and cash ($127B) exceeds total debt ($96B).
Valuation is fair, not cheap. At $376 the stock trades near 29x trailing earnings and 26x forward, on a 60% gross margin and 39% return on equity. The desk leans heavily positive, with 58 of 65 covering analysts at buy or strong buy and a mean target near $415.
The setup is constructive. Weekly trend intact, daily momentum cooling, intraday oversold, and a tight support cluster near $373 to $380. The first defined-risk entry since April.
What Alphabet Is Actually Doing With All That Money
Alphabet’s spending profile has no precedent in its own history. 2 years ago annual capex ran around $55B. The trailing-year figure is now near $110B, and the March quarter alone was $35.7B. Almost all of it is going into AI infrastructure: data-center capacity, custom silicon, networking, and the power deals to feed them. On top of organic spend, the company closed its $33.6B Wiz acquisition during the quarter, the biggest deal in Alphabet’s history, folding enterprise cloud security into Google Cloud at scale.
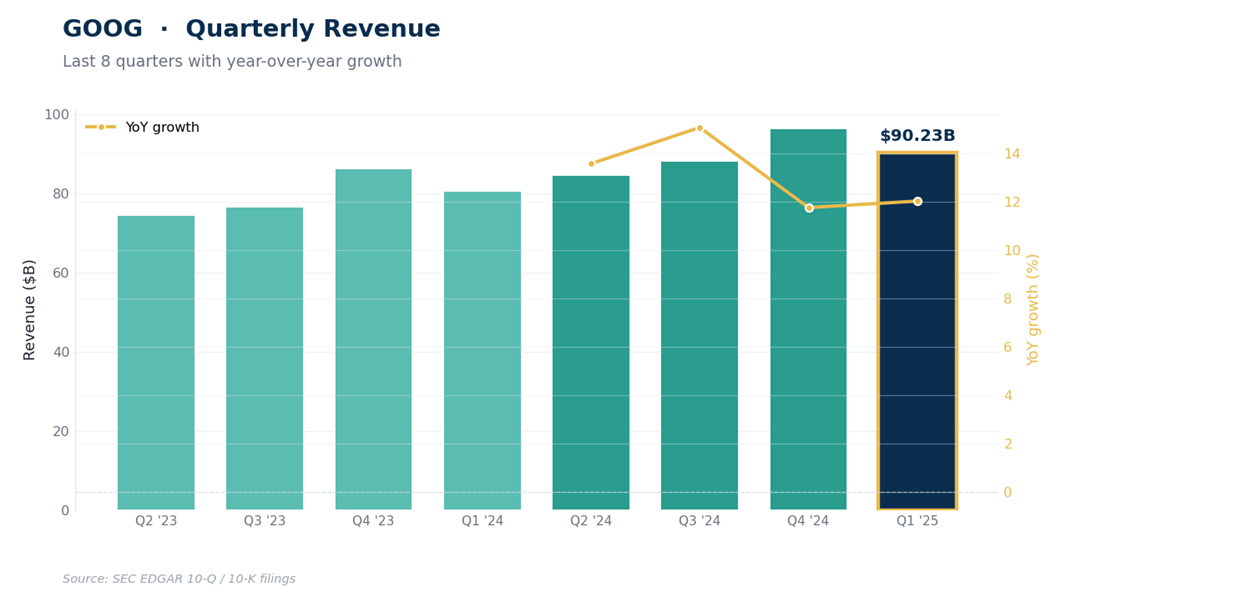
The market is willing to underwrite the spend because the underlying business is still compounding. Quarterly revenue went from $90B a year ago to $96B, $102B, $114B, and $110B in the March quarter, the highest growth rate the company has posted in over 2 years. Search remains the cash engine.
YouTube ad revenue keeps growing. Google Cloud is now contributing meaningful operating profit instead of soaking it up, with a recent multi-year EQT deal the kind of enterprise win that didn’t happen at Alphabet 5 years ago.
The sharper bear case is worth naming explicitly. It isn’t simply “capex stays high.” It’s this: what if $100B-plus of annual AI capex becomes the new permanent baseline, but incremental revenue growth doesn’t keep accelerating fast enough to justify it?
Today the spend is being matched by a 22%-growing top line and a faster operating line, so the math works. Stretch it 3 years out, and the question is whether the buildout earns its keep or compresses the cash machine for good.
The Fundamentals: A Cash Machine Spending Like One
The profit profile is almost absurd at this size. Over the past year Alphabet earned roughly $160B of reported net income on $422B of revenue. Gross margin runs above 60%, operating margin near 36%, and return on equity sits at 39%.
Even after stripping out the one-time securities gain that lifted the March quarter, this is a business that earns more on each marginal dollar than almost anything public.
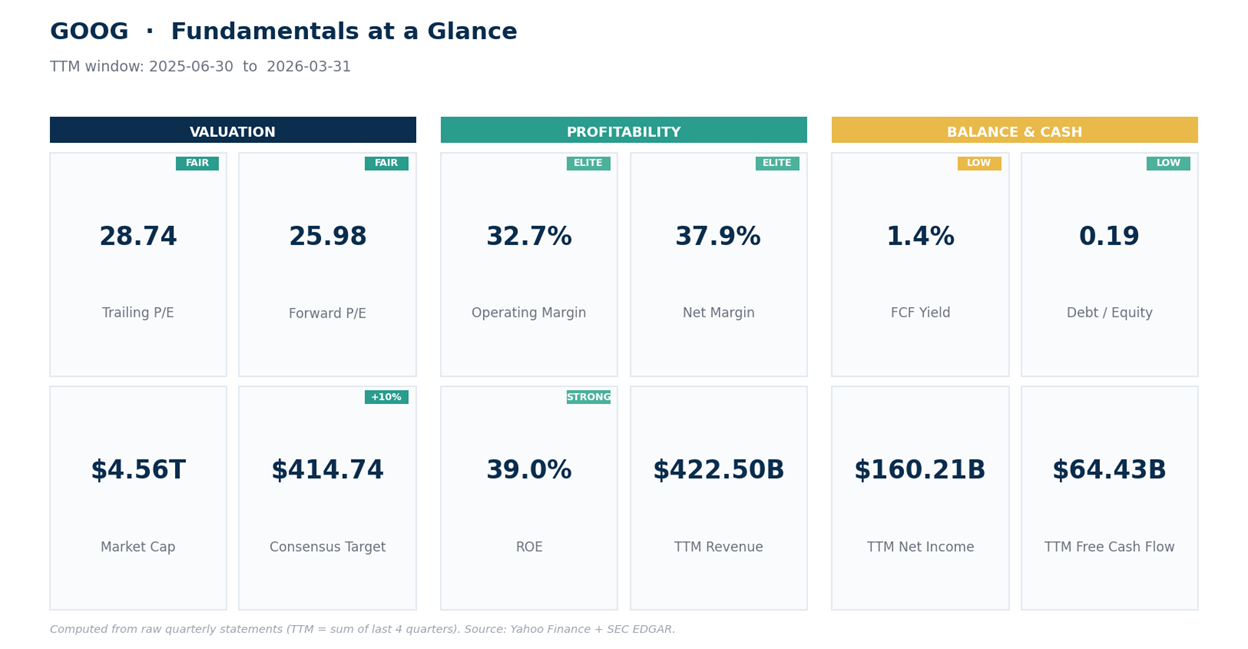
The balance sheet stays a fortress through all of it. Cash near $127B against total debt of roughly $96B leaves the company net-cash by about $31B, with a current ratio near 2 and debt-to-equity of 0.20. Even with the $33B Wiz bite, Alphabet didn’t have to lever up; it paid in cash and stock. On valuation, the multiple is fair rather than cheap: 29x trailing earnings, 26x forward, 11x sales.
For a business growing revenue at 22% with these margins and this balance sheet, none of that is demanding. Price targets aren’t an argument on their own, but the mean near $415 and median near $430, stacked on top of the operating numbers, read as confirmation rather than aspiration.
The wrinkle worth naming: free cash flow is positive but heavily compressed by capex. 2 years ago Alphabet generated more than $70B of free cash without breaking a sweat. Now the same company runs at a much higher revenue base but produces less free cash, because every available dollar is being routed into AI infrastructure.
The bet is that this spend creates more durable earnings power on the other side. The risk is that the spend becomes the new baseline and the cash line doesn’t recover.
The Technical Picture: A First Pullback in a Long Uptrend
The setup in one read: weekly trend intact, daily momentum cooling, intraday oversold, support clustered between $373 and $380. That’s where the opportunity lives.
On the weekly view the uptrend hasn’t even started rolling. Weekly RSI, a momentum gauge that runs 0 to 100, sits at 66, bullish without being overbought, and the weekly MACD line, a trend-following momentum read, is still above its signal.
On the daily, price at $376 sits just under the 20-day average near $379 after a fast run from $300 in April. Daily RSI is neutral at 52, daily MACD has rolled below its signal as momentum cools, and the shorter intraday timeframes are now stretched to the downside.
The lower Bollinger band, the line marking roughly 2 standard deviations below the recent mean, sits at $374, and the 23.6% retracement of the leg-up is at $373. Add the rising 20-day, and the support cluster is unusually tight. Below that, the next real shelf is the 50-day in the mid-350s.
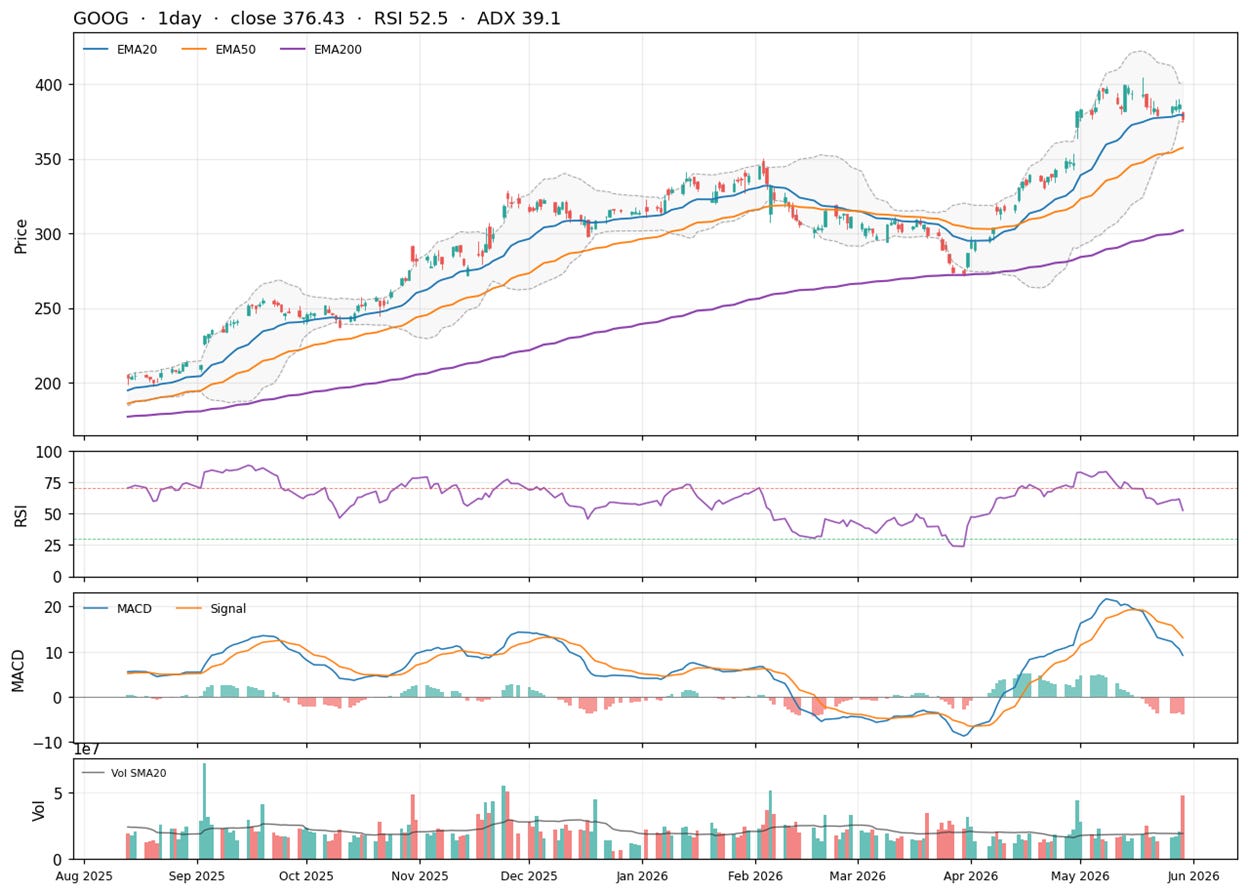
Net read: the larger trend is working, the short-term has cooled, and price is testing its first meaningful support since April. Not a guaranteed bounce, but the kind of place where a fresh entry has defined invalidation and the bigger trend is still on your side.
Our Trade Plan
Alphabet is a pullback-in-uptrend setup, not a chase and not an avoid. Tier the entries against support and let the stop do the rest.
Alphabet (GOOG) is pulling back into support, so buy weakness in tiers.
Starter entry: 373 to 380, the rising 20-day and lower Bollinger band cluster. Price already sits inside this zone.
Better-add zone: 354 to 365, near the 50-day and 38.2% Fib retracement. A deeper shake into here offers the cleaner long.
Invalidation: a daily close below 345 breaks the structure that has guided the rally. Move stops there once both tiers are filled.
Continuation trigger: a daily close back above 405 reclaims the prior high and opens the next leg.
Upside reference zones: 415 (a round-number consolidation shelf just above the prior high), 430 (where analyst consensus clusters), and 460 (a measured-move extension of the April-May leg and the Street’s high target).
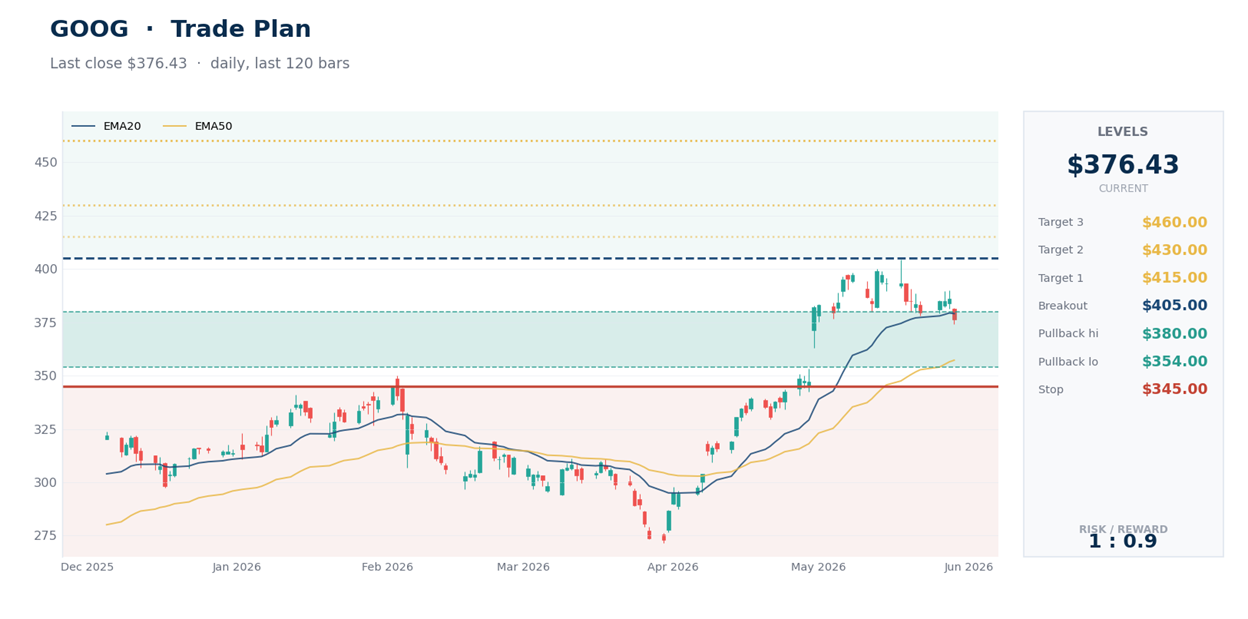
Size from the distance between entry and stop, not from a fixed share count. At the first reference zone, lift the stop to break-even, then trail it under each higher low.
Alphabet reports again on Thursday, July 23, which will be the next real read on whether capex is still translating into Search, YouTube, and Cloud growth at the rate the market is paying for.
Bottom Line
For now this looks more like a routine test of a strong uptrend than the start of a regime change. The 2 asterisks are worth keeping in mind: most of the splashy 81% net-income jump owes itself to a one-time gain, and free cash flow won’t return to its old run rate until capex normalizes. Neither changes the central case.
A 22%-growing business that earns above its weight, spends more on AI than anyone, and still prints more cash than almost anyone.
That combination doesn’t go on sale often. When it does, the right question isn’t whether to look. It’s where to stop out if you’re wrong.
This is research and commentary, not personal investment advice. Levels and trade plans are illustrative; size positions to your own risk tolerance and time horizon. The author may hold positions in names discussed.