
Amazon (AMZN)- Ecommerce & Cloud Giant
Riding AWS-driven growth and bullish multi-timeframe setups into the next leg up.

Amazon AMZN 0.00%↑ has been on a tear since bottoming in April, powered by AWS’s exceptional growth and a rebound in consumer spending. With shares up over 25% in the past quarter, but struggling to clear the $220 resistance, now is a prime moment to reassess both the fundamentals and the technicals. In this post, we’ll unpack why Amazon’s long-term prospects remain robust, how the charts are lining up for another move higher, and lay out a clear trade plan to capitalize on the next leg up.
In a Nutshell
Bullish bias multi‐timeframe technicals align for another leg higher if $218–220 clears.
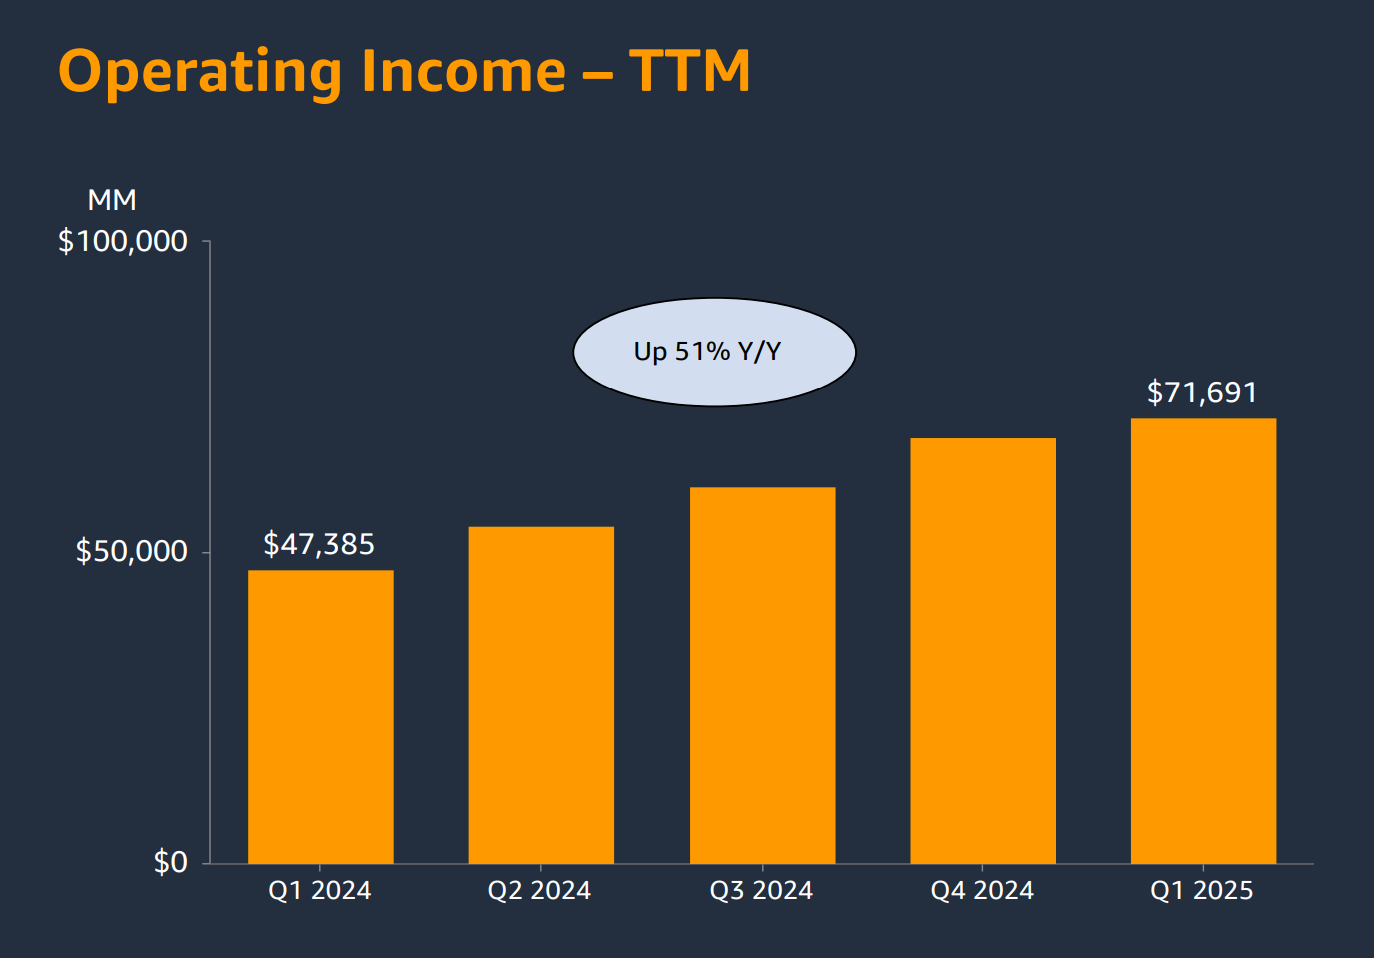
Fundamentals remain robust: double-digit revenue growth, expanding margins, strong free cash flow.
Trade plan: look for a pullback into $213–214 or $211–212 for new long entries, with initial targets of $225 and stops below $210.
Fundamental Analysis
Revenue growth: Low-double-digit year-over-year gains driven by AWS and advertising.
Profitability: Operating margins improving (north of 6%), net income growing faster than revenue.
Free Cash Flow: Generates $20–25 billion annually, funding capex and buybacks without debt strain.
Balance sheet: Comfortable liquidity (cash roughly offsets debt), strong asset base to fuel investments in AI, logistics, and cloud.
Valuation: Trading at ~50× forward EPS—rich vs. history, but justified by growth runway in cloud, ad and Prime ecosystems.
Risks: Macroeconomic slowdown could dent consumer spending; increased competition in cloud; margin pressure from fulfillment investments.

Technical Analysis
Elliott/Fibonacci: June’s 5th‐wave to $217–219 meets key 0.786–1.0 fib targets. A break above opens the $225 (1.618 ext) zone.
Moving Averages: Price has crossed above the 50 & 100 SMAs on daily/weekly, with the 20 SMA ribbon fanning up on intraday charts—classic bullish alignment.
Ichimoku: Price trading above the cloud at all major timeframes; Tenkan/Kijun bullish crosses in place.
ADX/OBV/Stoch: ADX around 15–20 on daily/weekly (trend intact); OBV flattening at highs—needs volume lift on pullback; intraday stochastics overbought, so expect a short-term retrace.
Our Trade Plan
Entry:
Primary: Scale in on dips into the $213–214 zone (30m fib + BB mid-band).
Secondary: Stronger support at $211–212 (daily Kijun / 50 SMA).
Targets:
$225 (1.618 fib extension)
$230–240 (weekly extension zone)
Stop:
Initial under $210 (daily 0.618 retrace).
Trail stops below evolving 30m/2H swing lows as price advances.
Conclusion
Amazon’s core franchises AWS, advertising, Prime ecosystem, are generating healthy growth and cash flow, supporting a premium valuation. Technically, all major indicators across weekly, daily and intraday charts suggest the next upside leg is imminent once short-term overbought readings unwind with a pullback into $213–214. A decisive break above $218–220 would clear the way to $225 and beyond, while a drop back under $210 would invalidate the immediate bullish thesis. Stay nimble, buy the next dip, respect stops, and let momentum carry you toward the fib targets.