


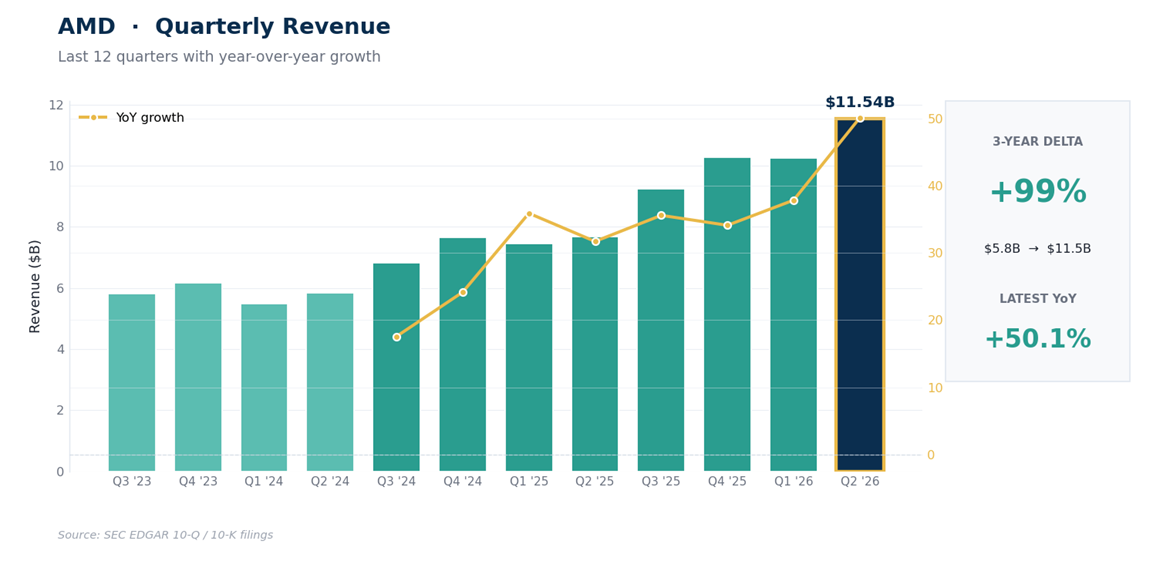
AMD’s second quarter delivered the challenger thesis: revenue up 50% to $11.5B, data center more than doubling to 58% of the business, and a third-quarter guide implying roughly 41% growth. The stock still fell 7% the next day. The problem wasn’t a margin miss, there wasn’t one: AMD delivered a 56% adjusted gross margin and guided to about 56% again. The problem was that a 21% rally into the print had priced in faster conversion from growth to margin expansion, and the guide said not yet. We also score our July map, which the month whipsawed in both directions, and the sizing rule we adopted because of it.

The challenger is winning share. The market is charging it for the cost of winning.
AMD reported Tuesday, August 4 after the close, into a rally: the stock rose 7% that session to $518.58, capping a 21% rebound over 4 sessions, then gave it back on Wednesday, closing at $482.05, down 7% on the reaction. That lands it exactly at the top of the thesis zone our July 18 trio piece drew, after a month in which the stock first broke out above that piece’s 535 trigger, then crashed through its 432 failure line, then V-recovered into the print, a round trip that deserves an honest accounting below. Prices are based on the August 5, 2026 close, a complete reaction day; results are from the release, the call, and the filed quarter.
Key Takeaways
The quarter delivered the challenger thesis: revenue of $11.5B grew 50%, data center revenue of $6.7B more than doubled year over year and is now 58% of the company (42% a year ago), adjusted EPS of $1.66 beat the $1.62 consensus, and the Q3 guide of $13.0B at the midpoint, against a $12.5B consensus, implies roughly 41% growth.
The disclosed commitments are specific: Anthropic up to 2 gigawatts of MI450 compute in Helios racks, Meta up to 6 gigawatts, OpenAI 6 gigawatts, and Microsoft deploying Helios and 6th-generation EPYC at scale across Azure, without a public gigawatt figure.
The margin story, stated precisely: non-GAAP gross margin came in at 56% (54% on a GAAP basis) and the September quarter is guided to roughly 56% again. Nothing missed; nothing expanded. Against a rally priced for incremental margin leverage, flat was the disappointment.
Scoring our July map: the 535 breakout fired and briefly paid, the sector crash then forced exits at the 432 failure line, and the stock V-recovered into the print. The stop did its job against an unknowable decline; the rebound made it expensive in hindsight. The process change we adopted: half size on breakout entries in names this volatile.
The new map: pullback zone 455 to 470, invalidation at a daily close below 424, breakout 531, references 548, 585, and 650.
The Quarter: What Winning Share Looks Like
Strip the reaction away first. Revenue of $11.5B grew 50% on the EDGAR-filed numbers, and the mix shifted decisively: data center, at $6.7B, more than doubled year over year and is now 58% of AMD, versus 42% a year earlier and less than a third of the company 3 years ago. The product cycle behind it is the broadest AMD has shipped, Helios rack-scale systems, MI450-series accelerators, 6th-generation EPYC, and Pensando networking, and the disclosed commitments now read: up to 2 gigawatts from Anthropic, up to 6 gigawatts from Meta, 6 gigawatts from OpenAI, and Azure-scale deployment from Microsoft. The guide put the next marker down: $13.0B at the Q3 midpoint, half a billion above consensus, implying roughly 41% year-over-year growth. One bookkeeping note: GAAP EPS was $1.38 against the $1.66 adjusted figure, the gap being the usual non-GAAP exclusions.
The Margin Question
The reaction wasn’t about a miss, because there wasn’t one. AMD delivered a 56% non-GAAP gross margin and guided the September quarter to roughly 56% again. That’s the issue, stated precisely: flat. Into a stock that had rebounded 21% in 4 sessions, investors were positioned for evidence that the revenue ramp had started producing incremental margin expansion, and the guide said not yet.
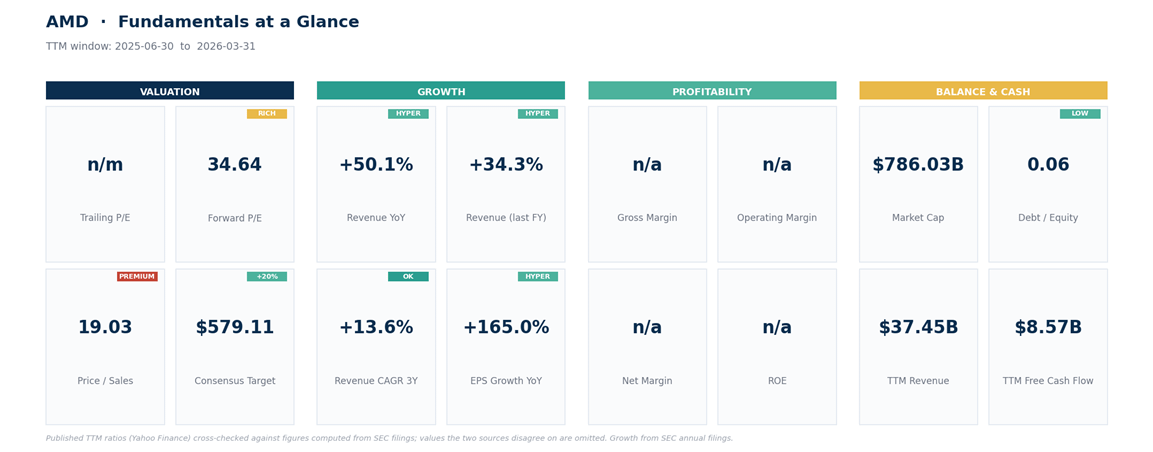
Management acknowledged on the call that data-center AI margins remain slightly below the corporate average, with the path from here depending on product and customer mix, which is the careful version of: the early Helios and MI450 ramp dilutes until scale and mix mature. The long-term frame is unchanged and ambitious, more than 35% revenue growth compounded, non-GAAP operating margin above 35%, and EPS above $20, all within 3 to 5 years; at $482, that endpoint is 24x. The market’s question, as it has been all season, is the path.
This is the third variation of the pattern on our pages this summer: GE Vernova fell on margin conversion inside a record demand quarter, Meta fell on costs arriving before returns, and AMD now falls on margins arriving flat when the rally had priced them rising. Futurum’s Shay Boloor put the positioning plainly: “It was priced for something much closer to a blowout... this was not an exceptional result.”
Scoring the July Map
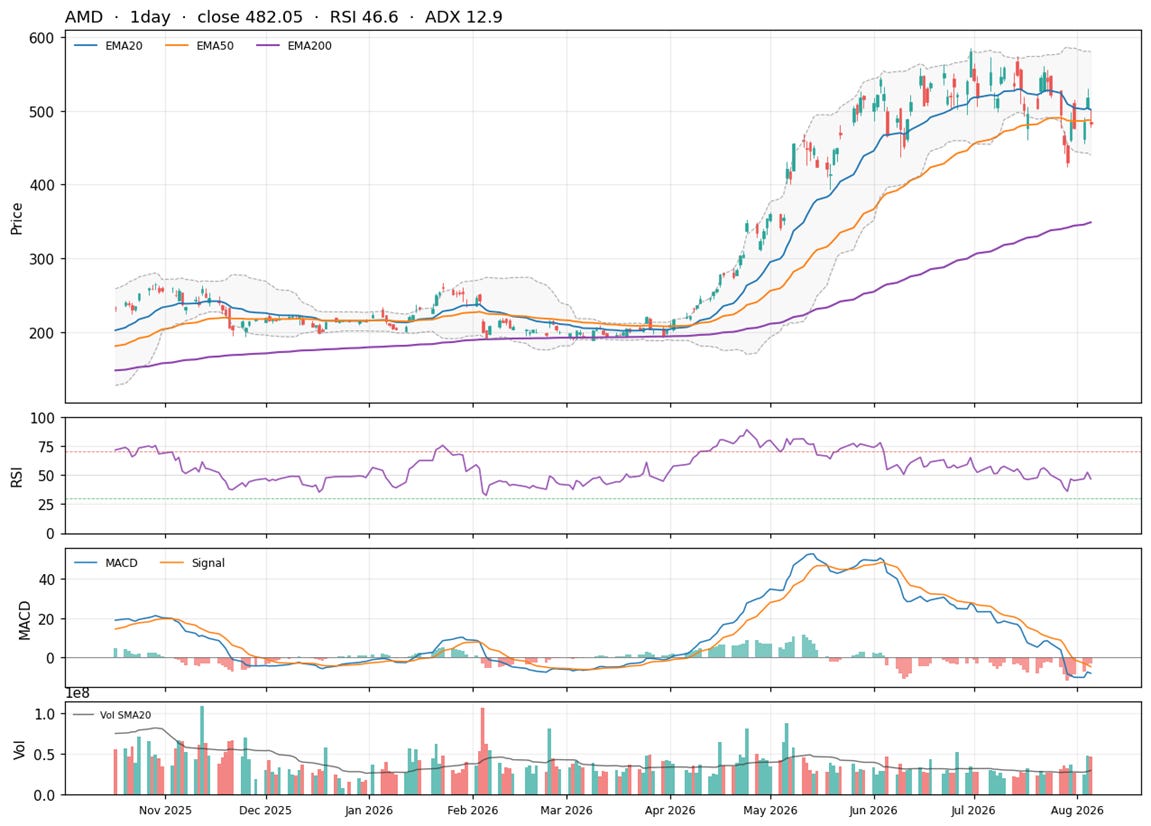
The July 18 trio piece mapped AMD at $495.76: thesis zone 465 to 482, breakout above 535, structural failure below 432. The map’s first call worked: the breakout fired on July 21 and paid for 3 sessions, with closes of $544.43, $552.33, and $539.69. Then the sector-wide selloff that took roughly $1.3 trillion out of semiconductors reversed everything in its path; AMD fell through the zone and, on July 29, closed at $429.56, below the failure line, where the rules forced exits. 2 sessions later the rebound began that reached $518.58 by the eve of earnings.
Here’s the honest scorecard, without flattering it or flogging it. The 432 line existed because a close below it meant the uptrend structure was gone, and on July 29, mid-crash with no floor in sight, it was; nobody rings a bell announcing which breakdowns become the 40% kind, and the same discipline kept the AST SpaceMobile and Meta breakdowns from becoming far larger losses this summer.
In July’s case the market turned 2 sessions after the exit, so the insurance was paid for and went unused. That’s the standing bargain with stops: most months they’re what keeps a drawdown survivable, and occasionally the premium comes due. The genuine lesson isn’t that the map was wrong; it’s a sizing rule we’ve now made formal: breakout entries in 8%-daily-range names get half size from the start.
What the Price Assumes Now
At $482.05, AMD trades at 34.6x next-year consensus earnings on the feed our dashboards use, struck at the August 5 close, down from 37x when the trio piece ran. Depending on the provider and EPS convention, the trailing GAAP multiple sits above 100x and isn’t especially useful for judging the forward ramp.
On the same feed, the Street’s mean target is $579, about 20% above the price, with the median at $600 and a range from $320 to $1,250, the widest top end we track, which tells you how unsettled the out-year story is; per CNBC’s August 5 analyst roundup, JPMorgan raised its target from $385 to $550 while staying at Neutral, which captures the ambivalence neatly.
The bull case is arithmetic: if the $20-plus EPS target lands on schedule, today’s buyer paid 24x it. The bear case is the same arithmetic with a delay: every quarter margins run flat while revenue compounds, the multiple has to carry more of the story. Wednesday’s 7% was the market repricing the carry, not the destination. Worth remembering the trio thesis too: AMD’s print was always going to move the group, and NVIDIA, scheduled to report August 26, now answers with AMD’s margin evidence on the table.
The Map After the Whipsaw
One possible framework, not a promise, and sized for the volatility it lives in: AMD’s 14-day average true range is 8.4% of price, and the last 6 sessions include a 21% rebound and a 7% reaction fade. All triggers are daily closes.
Pullback zone: 455 to 470, the August 3 low ($455.30), the old zone floor, and the area the rebound built its base in.
Invalidation: a daily close below 424, under the July 29 panic low ($424.03) and the 100-day average near 429. Below that, the whipsaw resolves downward and the challenger premium is repricing in earnest.
Breakout: a daily close above 531 clears the entire earnings-week range (the August 4 high was $530.13), with references at 548 (the July breakout shelf), 585 (the June intraday record area; the record close was near $580.91), and 650, the projected range extension carried from our July map.
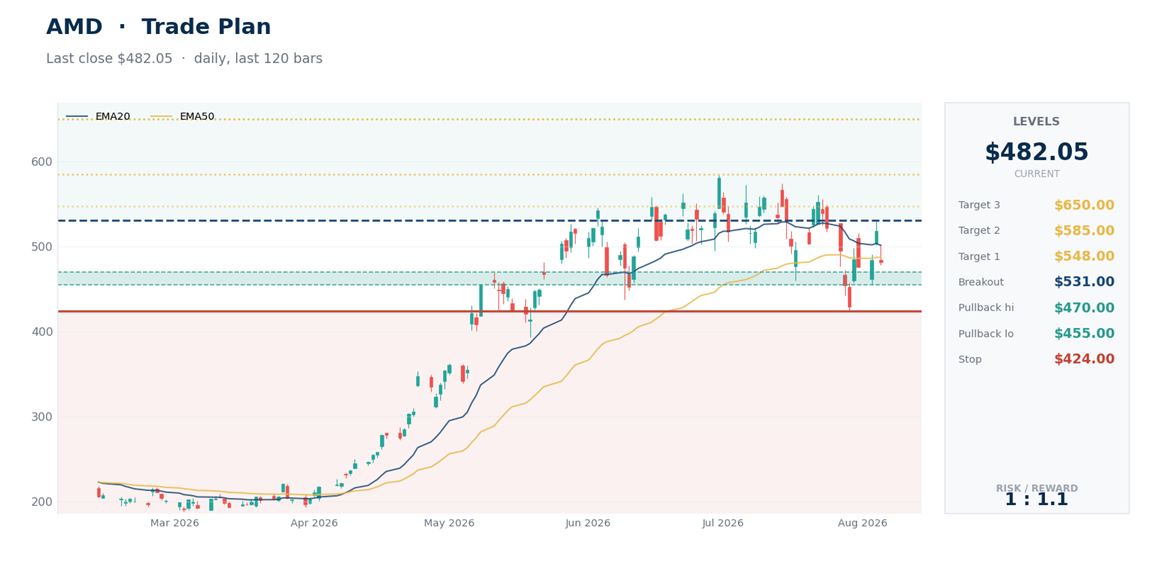
For fresh capital (illustrative): a fill near 462 against the 424 line risks about 8.2%, and July just demonstrated a gap can double that. Size so a 15% to 20% adverse move stays inside your portfolio risk budget, and per July’s lesson, any breakout entry above 531 deserves half size with its own stop back under 505.
Between now and the next report, currently listed for November 3, the evidence is MI450 margin commentary, any new gigawatt-scale commitments, and NVIDIA’s August 26 print, which now doubles as a referendum on whether AMD’s share gains are coming out of the incumbent’s growth or the market’s.
Bottom Line
The quarter proved the share story: 50% growth, a doubled data-center business, and disclosed commitments from Anthropic (up to 2 gigawatts), Meta (up to 6), and OpenAI (6). The reaction refined the season’s rule rather than repeating it: demand is assumed, and now even holding margins flat gets charged when the rally into the print had priced them rising.
July whipsawed our map in both directions, and the scorecard above owns it along with the sizing rule it produced. From here, 455 to 470 is the first zone where the thesis can be evaluated against defined structural risk, 424 marks formal invalidation, and 531 would signal confirmation that the margin question is answered. We’d let one of those 3 speak before adding to the story.
This is research and commentary, not personal investment advice. Levels and trade plans are illustrative; size positions to your own risk tolerance and time horizon. The author may hold positions in names discussed.