
AMD vs Broadcom: Pay Up for the Challenger, or Own the Cash Machine?
Both of these AI-silicon heavyweights sit near record highs, but they ask very different things of the investor buying today.

One is a melt-up. The other is a machine. Knowing the difference is most of the trade.
Both are fabless, asset-light beneficiaries of the same AI compute boom, but Broadcom converts that demand into profit far more efficiently. That’s where the similarity ends. AMD has gone vertical, up 46% in May alone and more than 4x over the past year, and trades near 166 times trailing earnings on operating margins under 12%. Broadcom has climbed in a steadier line, up about 79% on the year, and earns 41 cents of operating profit on every sales dollar at a lower multiple than its flashier peer. The cheaper stock sits on the better business. That’s the tension, and Broadcom reports Wednesday, 2026-06-03, which makes the timing live.
The honest read up front: both are excellent businesses, and neither is a great entry today. What you wait for differs.

Key Takeaways
AMD’s the higher-torque story and the worse entry. At $510 it trades above the average analyst target, the weekly trend is the most stretched in years, and you’re paying 166x earnings for 12% operating margins.
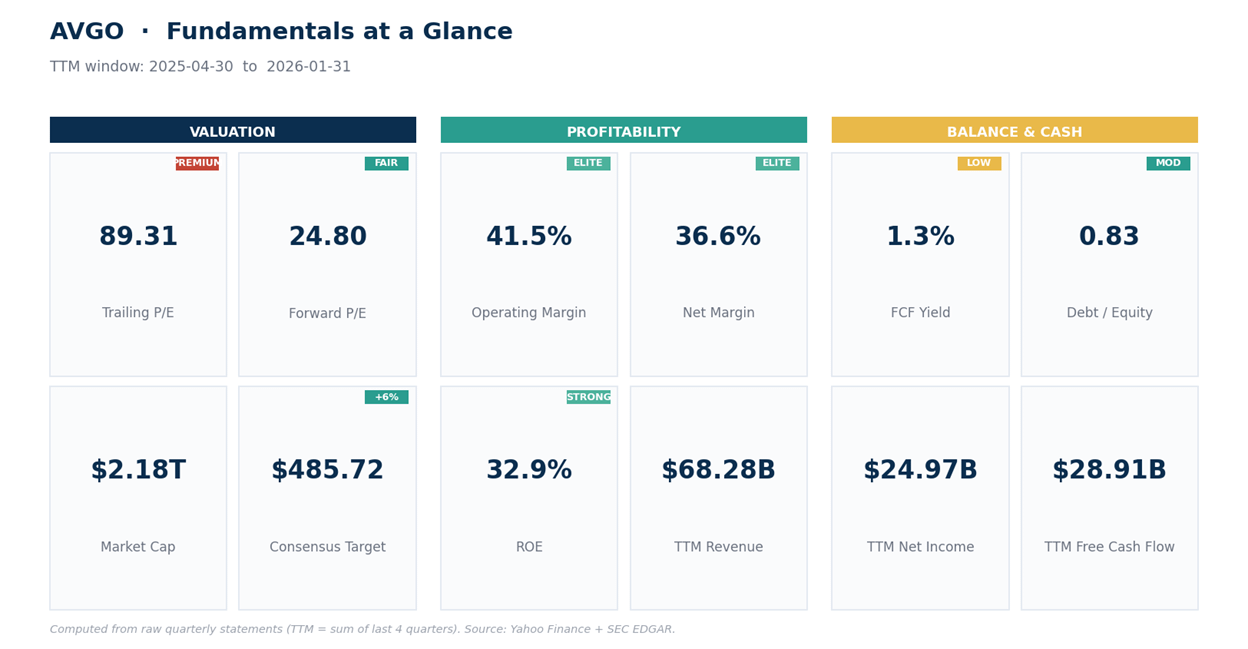
Broadcom is the quality name on the cheaper multiple: 41% operating margins, 33% return on equity, almost $29B of trailing free cash flow, and a lower valuation on both earnings and cash flow than AMD.
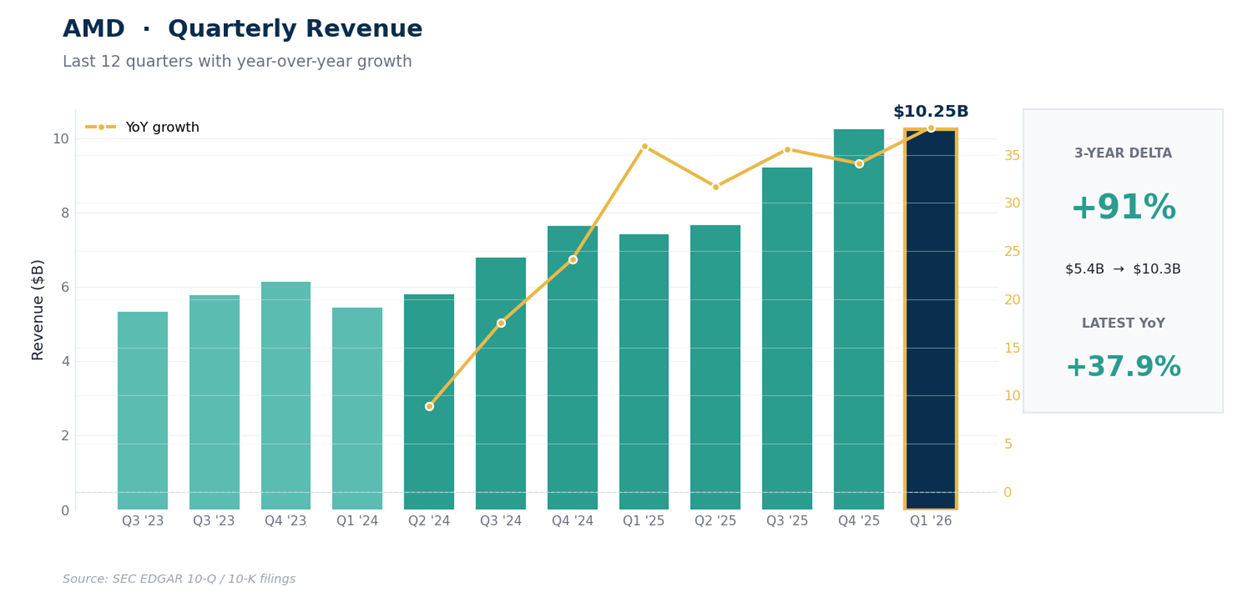
AMD’s datacenter engine is clearly working: the March quarter posted revenue of $10.25B (+38% YoY) and net income that nearly doubled from a year earlier. The business is catching up; the stock has already sprinted ahead.
Broadcom reports Wednesday. With the daily tape stretched above its upper volatility band going into that print, chasing the day before is poor odds.
Both are patience trades. AMD needs a reset toward $445 to $470; Broadcom needs the print to clear and a dip into $400 to $425. The franchises aren’t the problem; the prices are.
The bigger one first, because it’s the one everybody’s chasing.
AMD: The Business Is Catching Up, the Stock Has Sprinted Ahead
AMD’s datacenter ramp has finally shown up in the statements. The March quarter delivered revenue of $10.25B, up 38% YoY, with operating income of $1.48B and net income of $1.38B that nearly doubled from a year earlier.
Over 12 quarters revenue has roughly doubled from the low-$5B range to north of $10B, and the operating line has gone from a small loss in one soft quarter to a steady $1.5B run rate as MI-series accelerators and EPYC server chips took share. Trailing 12-month revenue now sits at $37.45B.
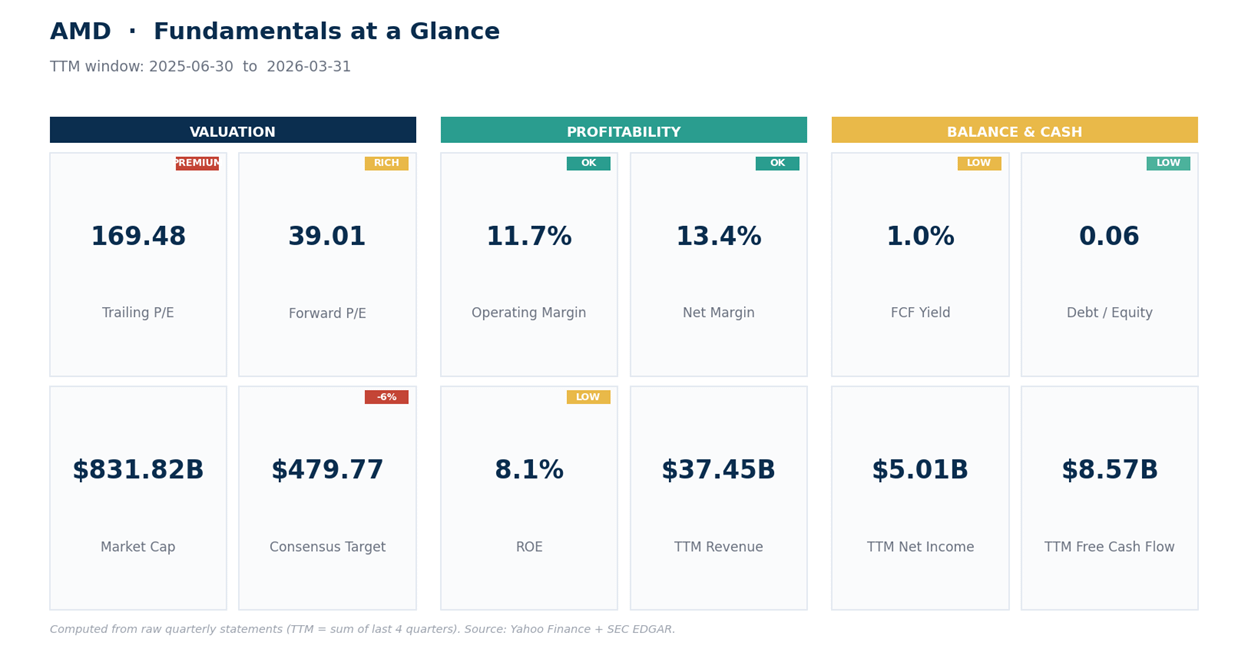
The catch is the price, and the margins. AMD’s operating margin is 11.6% and net margin 13.4%, respectable for a chip designer climbing a ramp, but far below Nvidia’s 66% or Broadcom’s 41%.
On that base of profit, the stock trades at 166 times trailing earnings, 103 times EV/EBITDA, and 22 times sales, with return on equity of just 8%. The balance sheet is near debt-free and free cash flow of $8.57B is real, but a 1% free-cash-flow yield tells you the market has already paid for years of growth.
The forward multiple near 39x is far gentler than the trailing 166x, and that’s the tell: the case rests on earnings compounding fast enough to grow into the price. Given the datacenter ramp, that isn’t a crazy bet, just an expensive one.
The desk is overwhelmingly positive (48 analysts, no sell ratings), but at $510 the stock trades above the average target near $480. When price runs past the people paid to be bullish, that’s color, not a reason to buy.
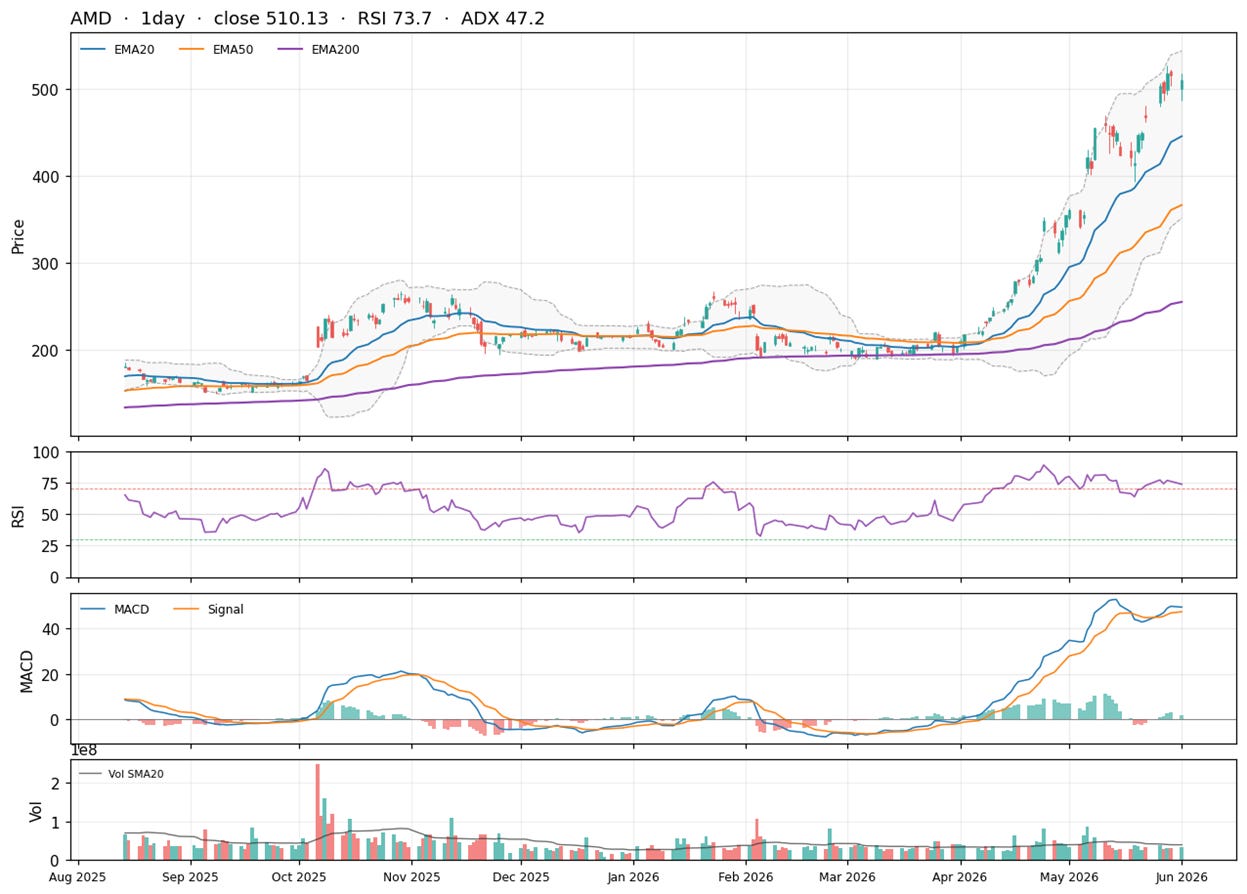
The tape says the same thing the valuation does. The daily relative strength index, a 0-to-100 momentum gauge where readings above 70 flag an overheated move, sits at 73.7, and the weekly is at 81.
The trend-strength reading (ADX) is up at 47 on the daily, which signals an unusually strong, well-established trend rather than chop. Price at $510 is stretched far above its rising 20-day average near $445 and its 50-day near $366, and it keeps closing near the top of its volatility band.
The daily MACD line, which tracks whether momentum is building or fading, sits just above its signal line, the gap narrowed to a sliver, so the thrust is decelerating.
This is a parabolic move off the $200 base that held all winter, gone near-vertical from $210 in April. Moves like this can run further than anyone expects, but the entry math is unforgiving up here. First real support is $445 to $470; the structural line is $400.
Net read: AMD’s a genuinely improving business whose stock has sprinted ahead of it. At 166x trailing earnings, above consensus targets, and the most overbought in years, the risk-reward for a new buyer here is poor, even if the long-term bull case holds. Want it lower, around $445 to $470, with $400 the line that says the trend has actually broken.
Different animal, same sector, and arguably the better one to own.
Broadcom: Fatter Margins, Cheaper Multiple, Binary Week
Broadcom’s model is the one institutions quietly prefer. Its custom-silicon franchise (the XPU accelerators it co-designs with hyperscalers) plus a high-margin software arm from the VMware deal give it both growth and recurring cash.
The January quarter brought in $19.31B, up 29% YoY, with operating income of $8.56B and net income of $7.35B that rose about 34% from a year ago. Over 12 quarters revenue has climbed from under $9B to north of $19B, with one quarter of reported net loss 2 years back from the VMware deal, since worked through. Trailing 12-month revenue is $68.28B.
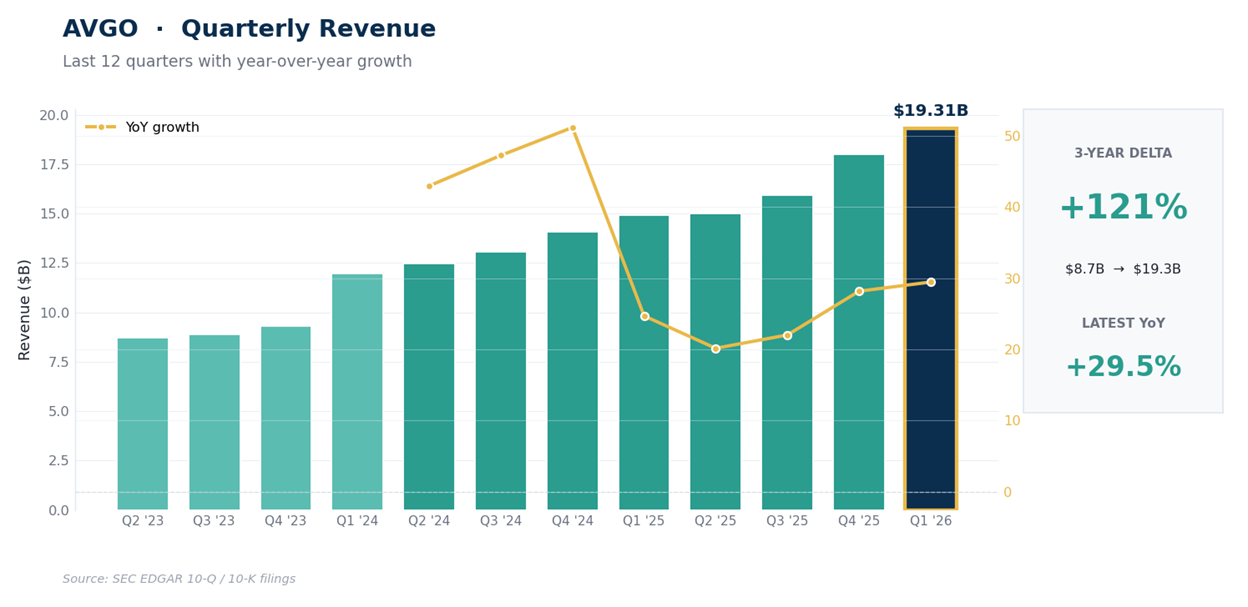
The quality gap versus AMD is the whole point. Broadcom runs a 68% gross margin, a 41% operating margin, and a 37% net margin, against AMD’s 50%, 12%, and 13%. Its return on equity is 33% versus AMD’s 8%, and it throws off almost $29B of trailing free cash flow against AMD’s $8.57B.
On the cleanest comparable measure, enterprise value to EBITDA, it trades near 60x against AMD’s 100x-plus. Its trailing P/E ranges from the high-80s to over 100 depending on how the VMware deal’s amortization and one-off tax charges are treated, which is why quoted figures differ across sources, but every basis leaves it under AMD’s 166x.
The one knock is leverage: debt-to-equity of 0.83 reflects the VMware deal, where AMD runs nearly debt-free, but Broadcom’s cash generation covers it easily. Its forward multiple near 25x signals how fast the desk expects earnings to compound. With 44 positive analysts and no sell ratings, and price at $460 sitting just below the average target near $486 and the $500 median, the upside to consensus is mild rather than stretched.
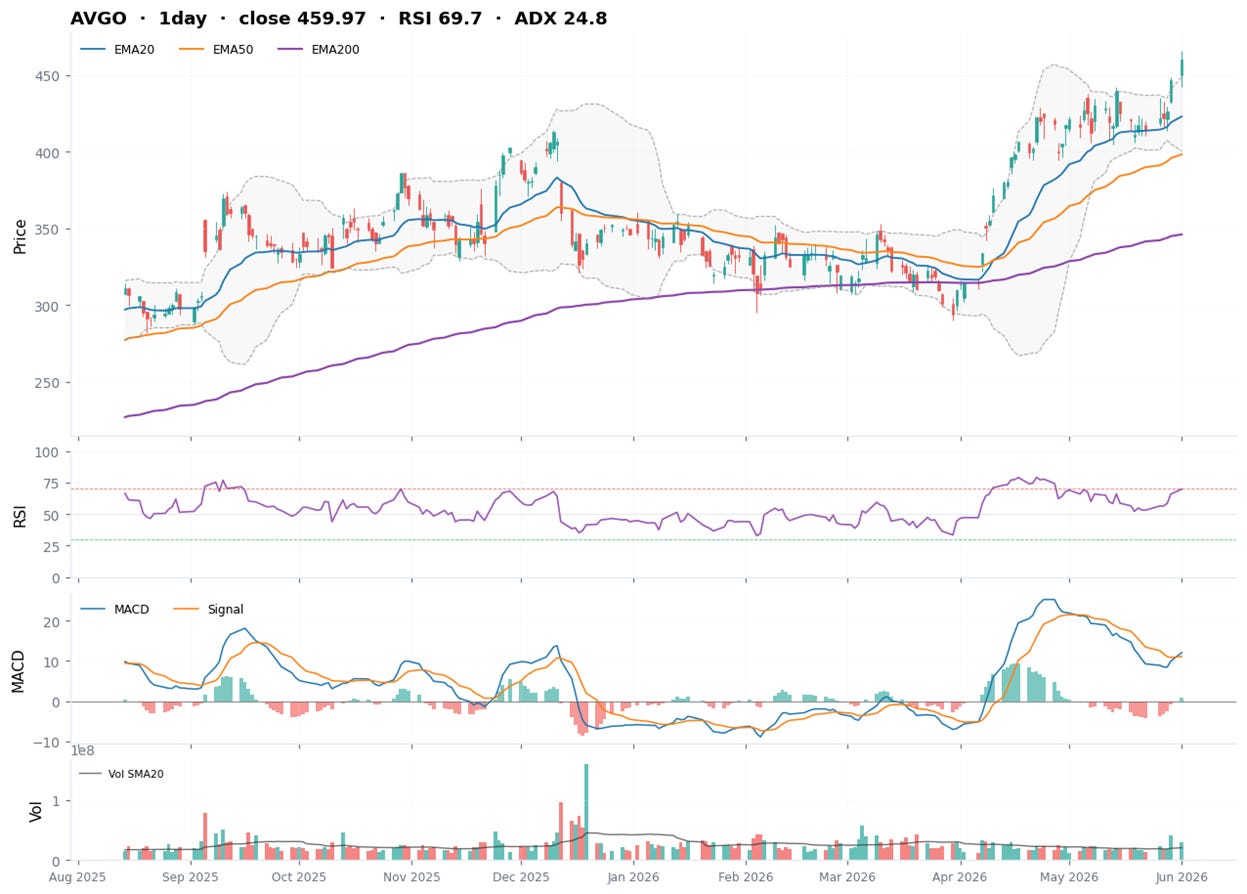
The tape is constructive but short-term stretched. Broadcom’s in a clean staircase uptrend, above its rising 20-day ($423), 50-day ($398), and 200-day ($346) averages, and it just pushed to a new high near $466. The encouraging part is weekly momentum: the weekly MACD line just crossed back above its signal with the histogram expanding, a new leg of medium-term momentum building rather than fading.
The daily relative strength index at 70 and a daily close above the upper volatility band (price poking through the top of its range) mark it as overheated near term, but the trend-strength reading near 25 on the daily is healthy and rising rather than exhausted, so the bigger picture holds.
The decision zone is simple: $466 is the breakout line, $400 to $425 (the 20-day and 50-day cluster) is where buyers reload on a dip, and $388 is the level that would say the trend’s in trouble.
Net read: Broadcom’s the higher-quality franchise at the cheaper multiple, and the medium-term trend is turning back up. But it’s stretched into a binary print on Wednesday, and you don’t pay up the day before earnings. Let the result clear, then buy the pullback into $400 to $425. This is the one I’d rather hold through a cycle.
How to act on both without overpaying.
Our Trade Plan
These are zones to work around, not exact instructions. Treat the levels as areas where the odds shift, and let price confirm before acting.
AMD
