
Applied Materials: Euphoria or Endurance?
The fundamentals are solid, but the technical structure holds the real edge.

Applied Materials AMAT 0.00%↑ just delivered what the market wanted to see. Strong earnings. Solid guidance. Reinforced demand tied to AI infrastructure and advanced packaging.
The stock responded exactly as you would expect from a high-quality cyclical in a strong tape. It broke higher. Hard.
But when price accelerates into extension levels while volatility expands, the question shifts from “Is the business strong?” to “Is this the right moment to act?”
This is where fundamentals and technical structure must work together.
Key Takeaways
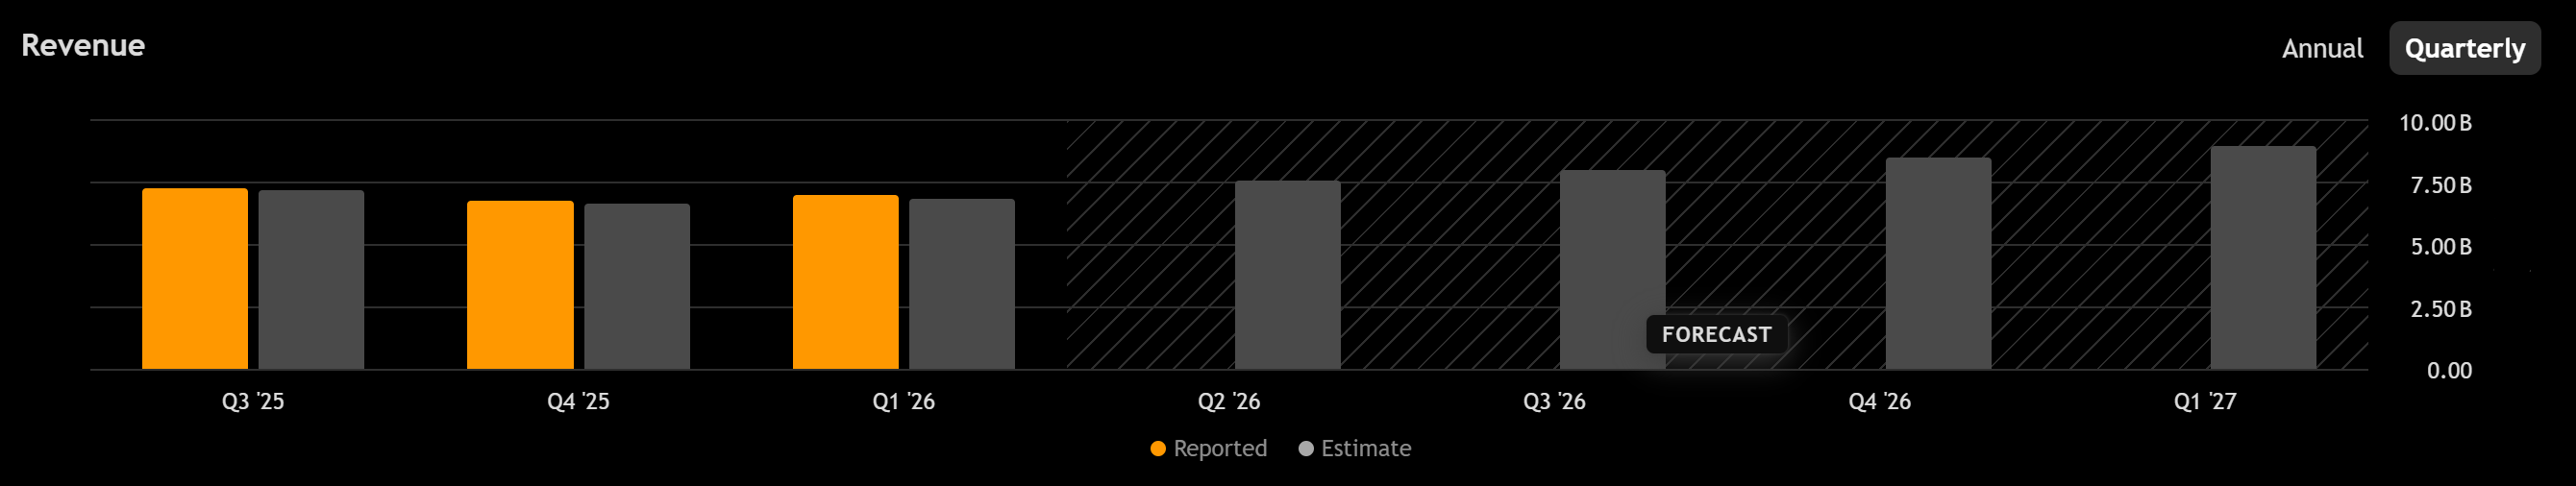
AI-driven semiconductor spending continues to support equipment demand.
Gross margins remain near 49%, signaling pricing power and favorable mix.
Free cash flow conversion remains elite at roughly 22% of revenue.
The stock is in a strong weekly uptrend but now trades above key extension and volatility bands.
357 to 365 is the near-term decision zone.
350 is the first breakout retest level that must hold.
322 is the structural invalidation level for the earnings breakout thesis.
Pipeline, Demand Drivers, and Latest Earnings
Applied Materials operates at the heart of semiconductor manufacturing. Its revenue mix is primarily Semiconductor Systems, supported by a growing and resilient Services segment.
The latest earnings reinforced several structural themes:
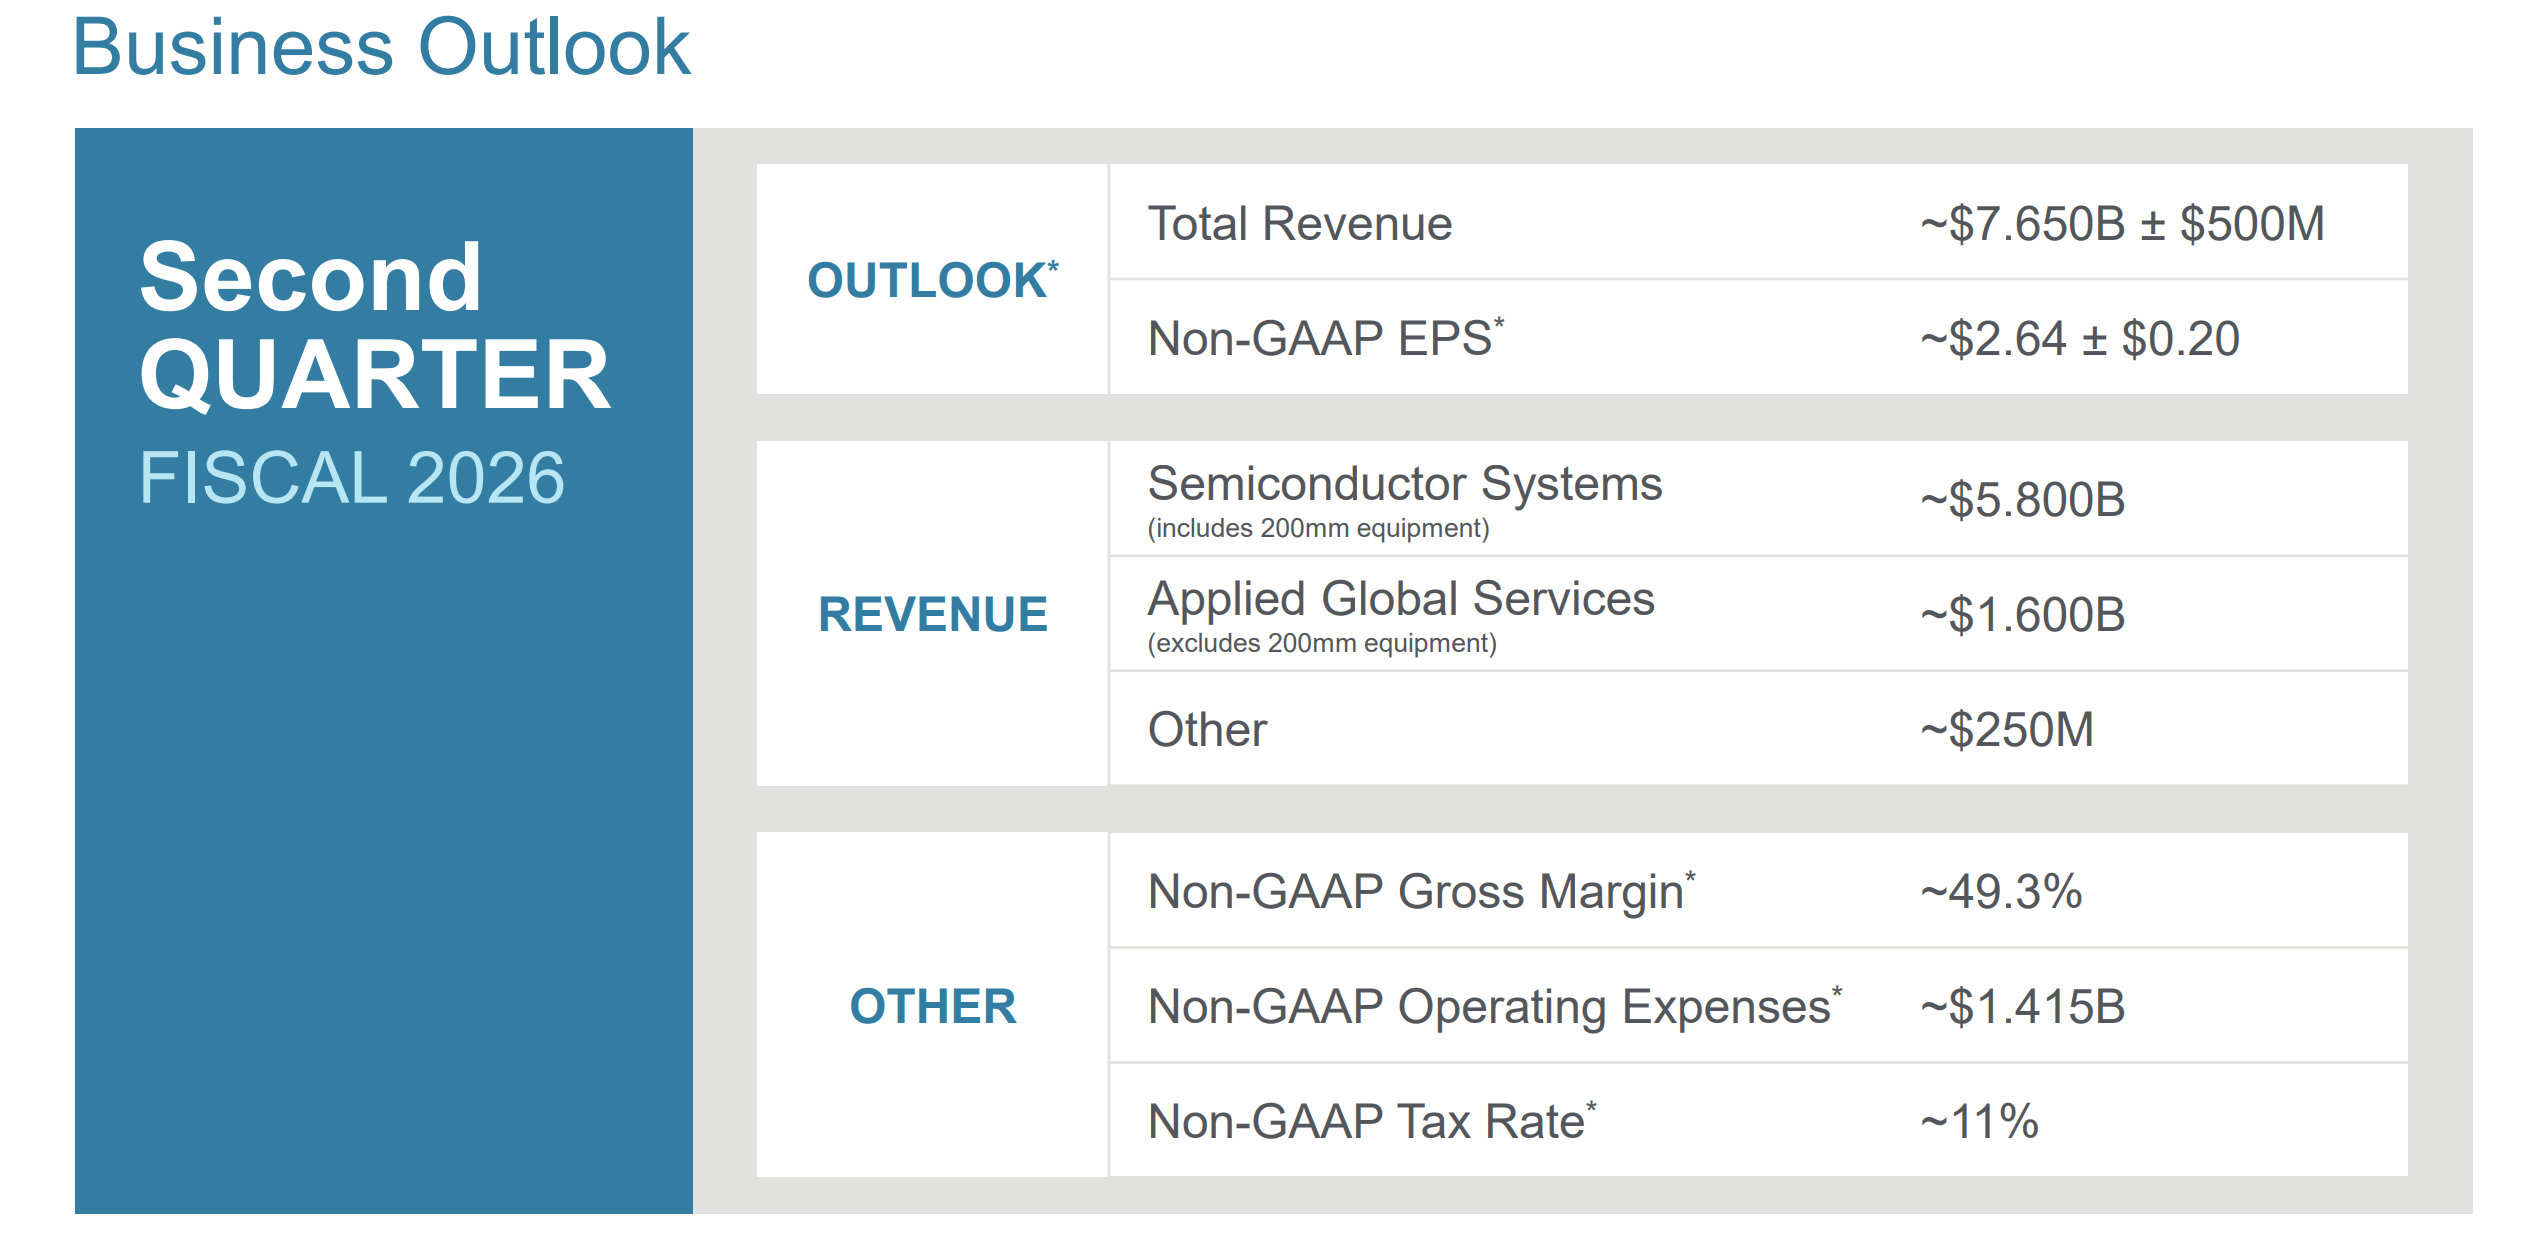
Semiconductor Systems revenue came in near 5.1B, supported by advanced logic and memory transitions.
Services revenue reached roughly 1.6B and continues to grow double digits.
AI compute demand remains the dominant driver, particularly through HBM, advanced packaging, and process complexity.

The critical nuance is step intensity. AI hardware requires more deposition, more etch, and more materials engineering per wafer. Even if wafer volumes stabilize, revenue per wafer rises.
That is what the market is underwriting.
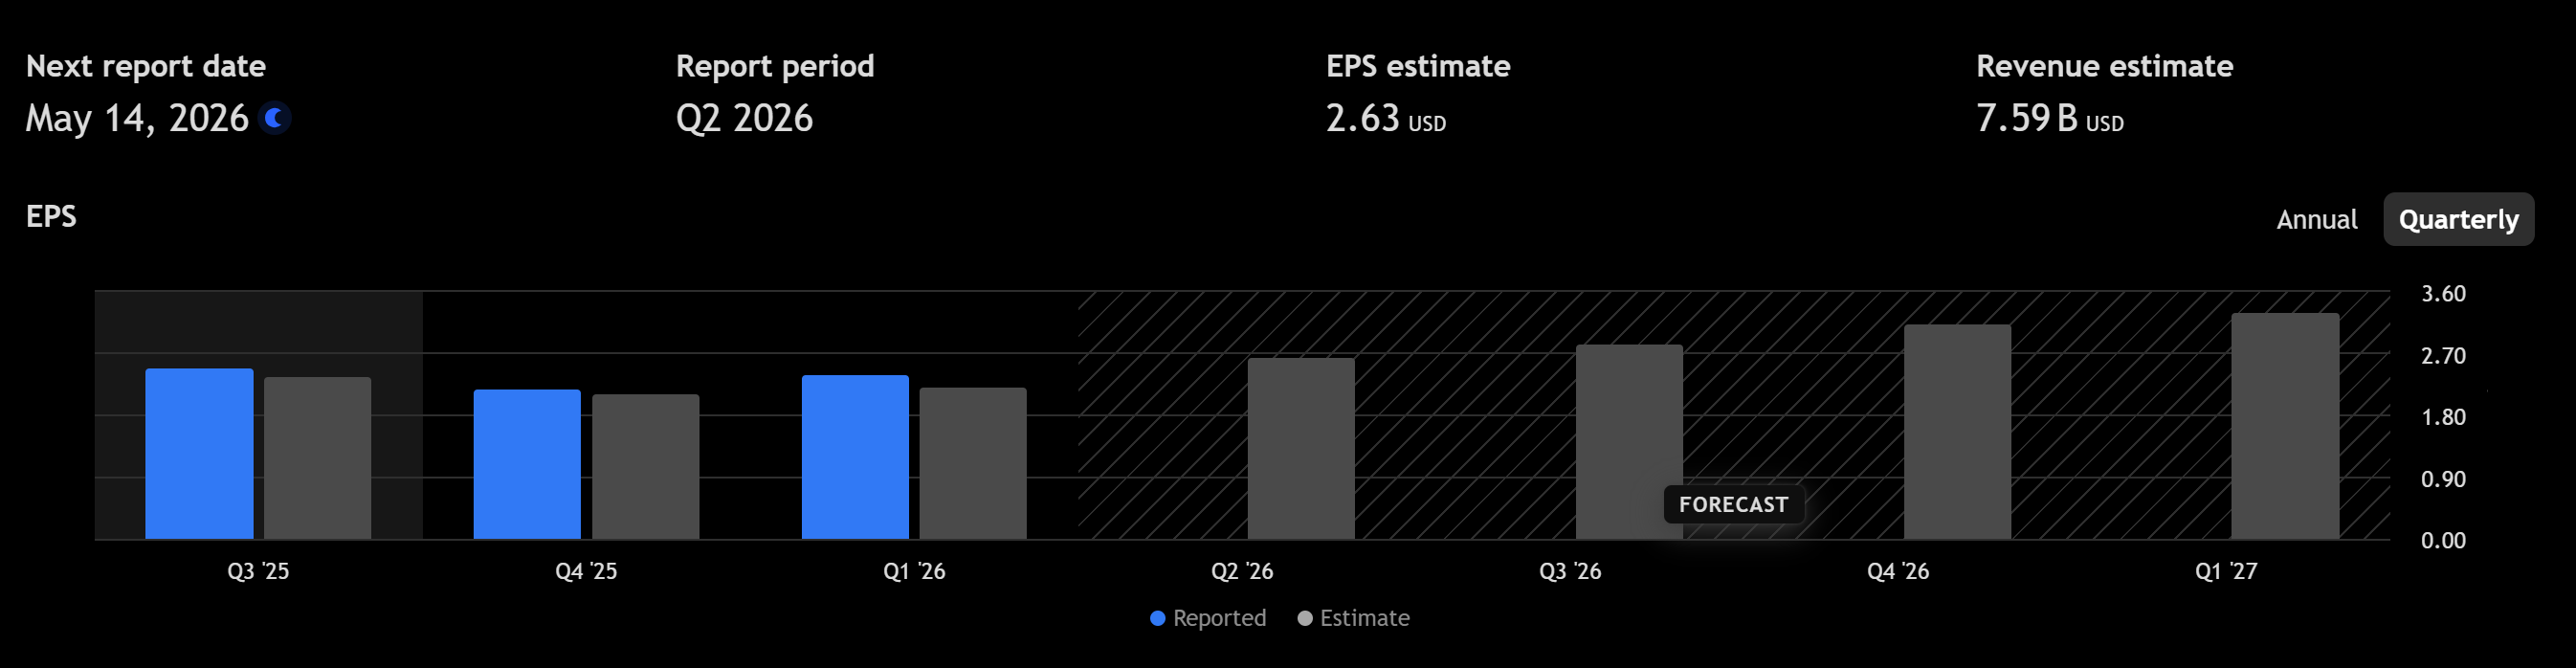
This was not simply a rebound quarter. Guidance for the next quarter implied continued strength, which reduced fears of a near-term capex pause.
Fundamental Analysis
Applied Materials remains a cash compounding machine.
Trailing 4-quarter revenue is roughly 28B.
Operating income is near 8.9B.
Cash from operations sits around 8.7B.
Capex is about 2.5B.
Levered free cash flow is approximately 6.2B.
That implies:
Free cash flow margin near 22%.
Strong earnings conversion.
Net cash balance sheet with roughly 8.5B cash versus 6.5B debt.
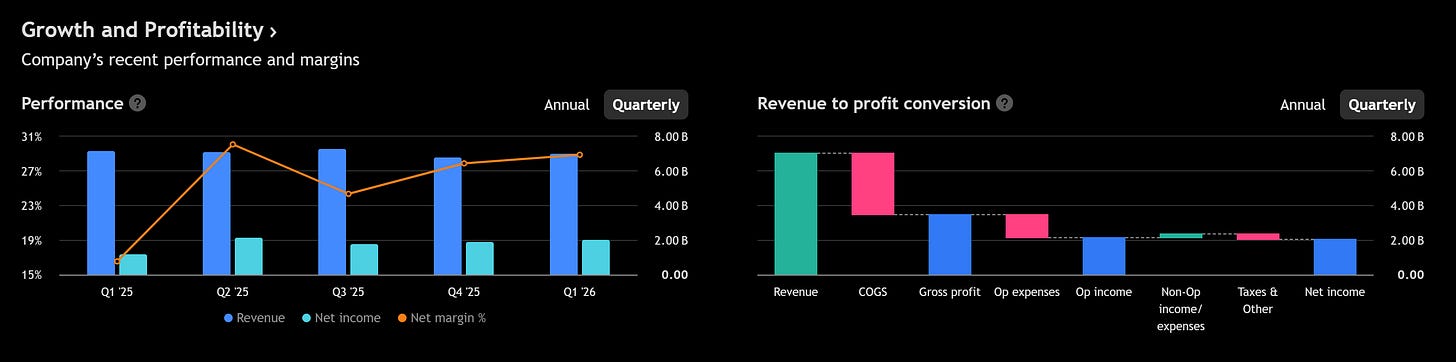

Gross margin remains near 49%. That is the most important signal in this entire report. When margins hold at this level during a capex recovery, it tells you mix is favorable and pricing power is intact.
Capital allocation remains disciplined. Dividends and buybacks continue to reduce share count, enhancing per-share compounding.
What changed after earnings?
Expectations for 2026 capex durability improved. The debate shifted from “Is this a memory bounce?” to “Is this an AI transition cycle?”
That distinction matters for valuation. Structural cycles deserve higher multiples than inventory cycles.
The business remains high quality, cash generative, and structurally supported by AI infrastructure demand. Nothing in the report weakens the long-term thesis.
Technical Analysis
Now the critical part.
Long-Term Structure
The weekly trend is firmly bullish. EMAs are stacked upward, and price is extended well above them. Weekly ADX above 35 confirms strong trend strength.
However, weekly RSI is above 80. That signals extension, not immediate reversal, but it raises the probability of consolidation or pullback.
The key weekly extension level sits near 357. That is the 2.618 extension of the prior major leg. Markets often pause or digest around such levels.
Medium-Term Structure
On the daily timeframe:
Daily upper volatility band sits near 350.
Price is trading above that level.
Daily EMA20 is near 322.
Daily ATR is about 17.
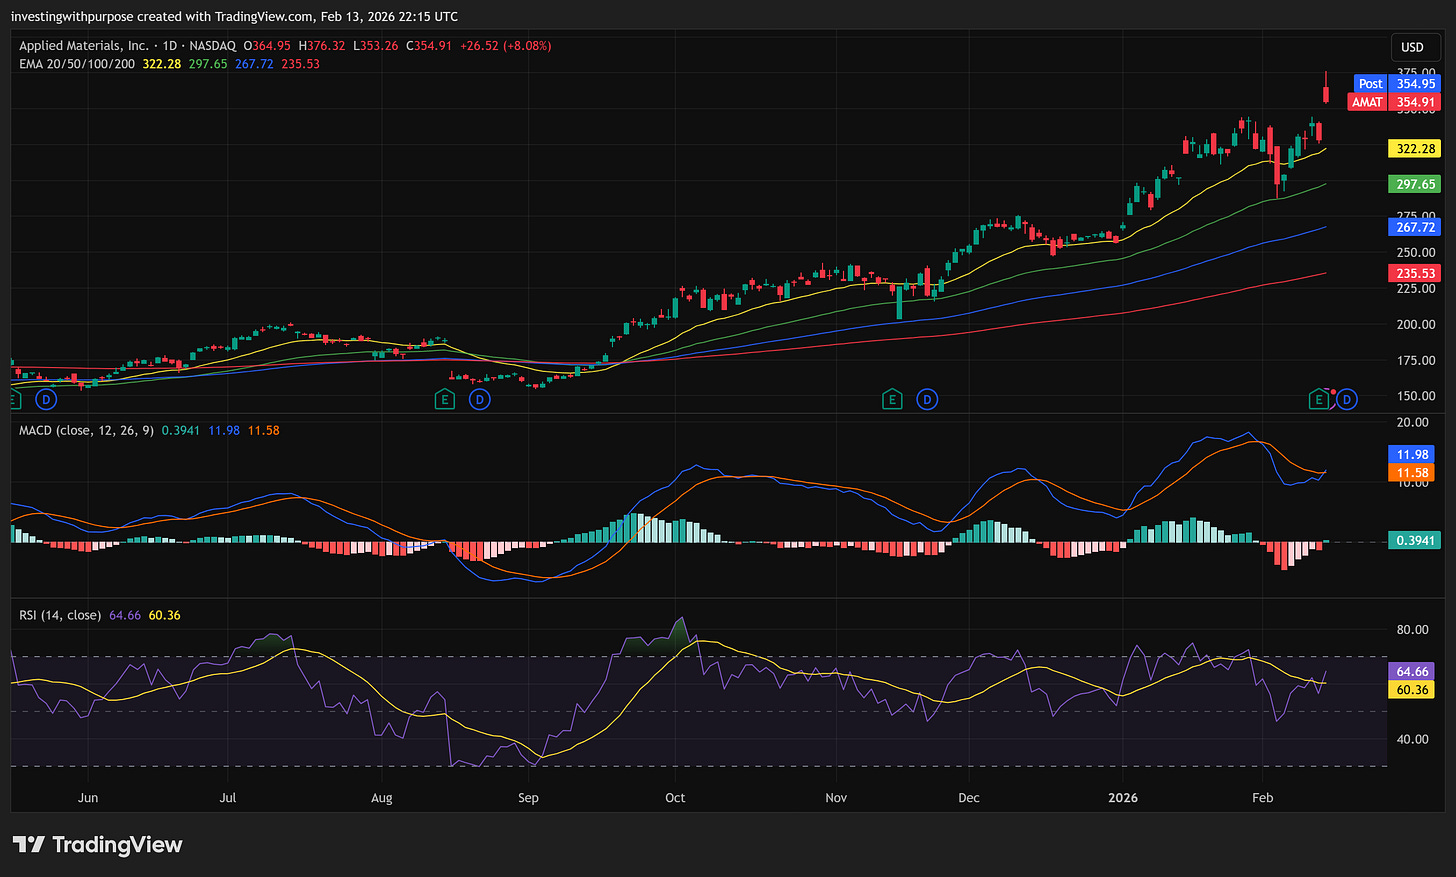
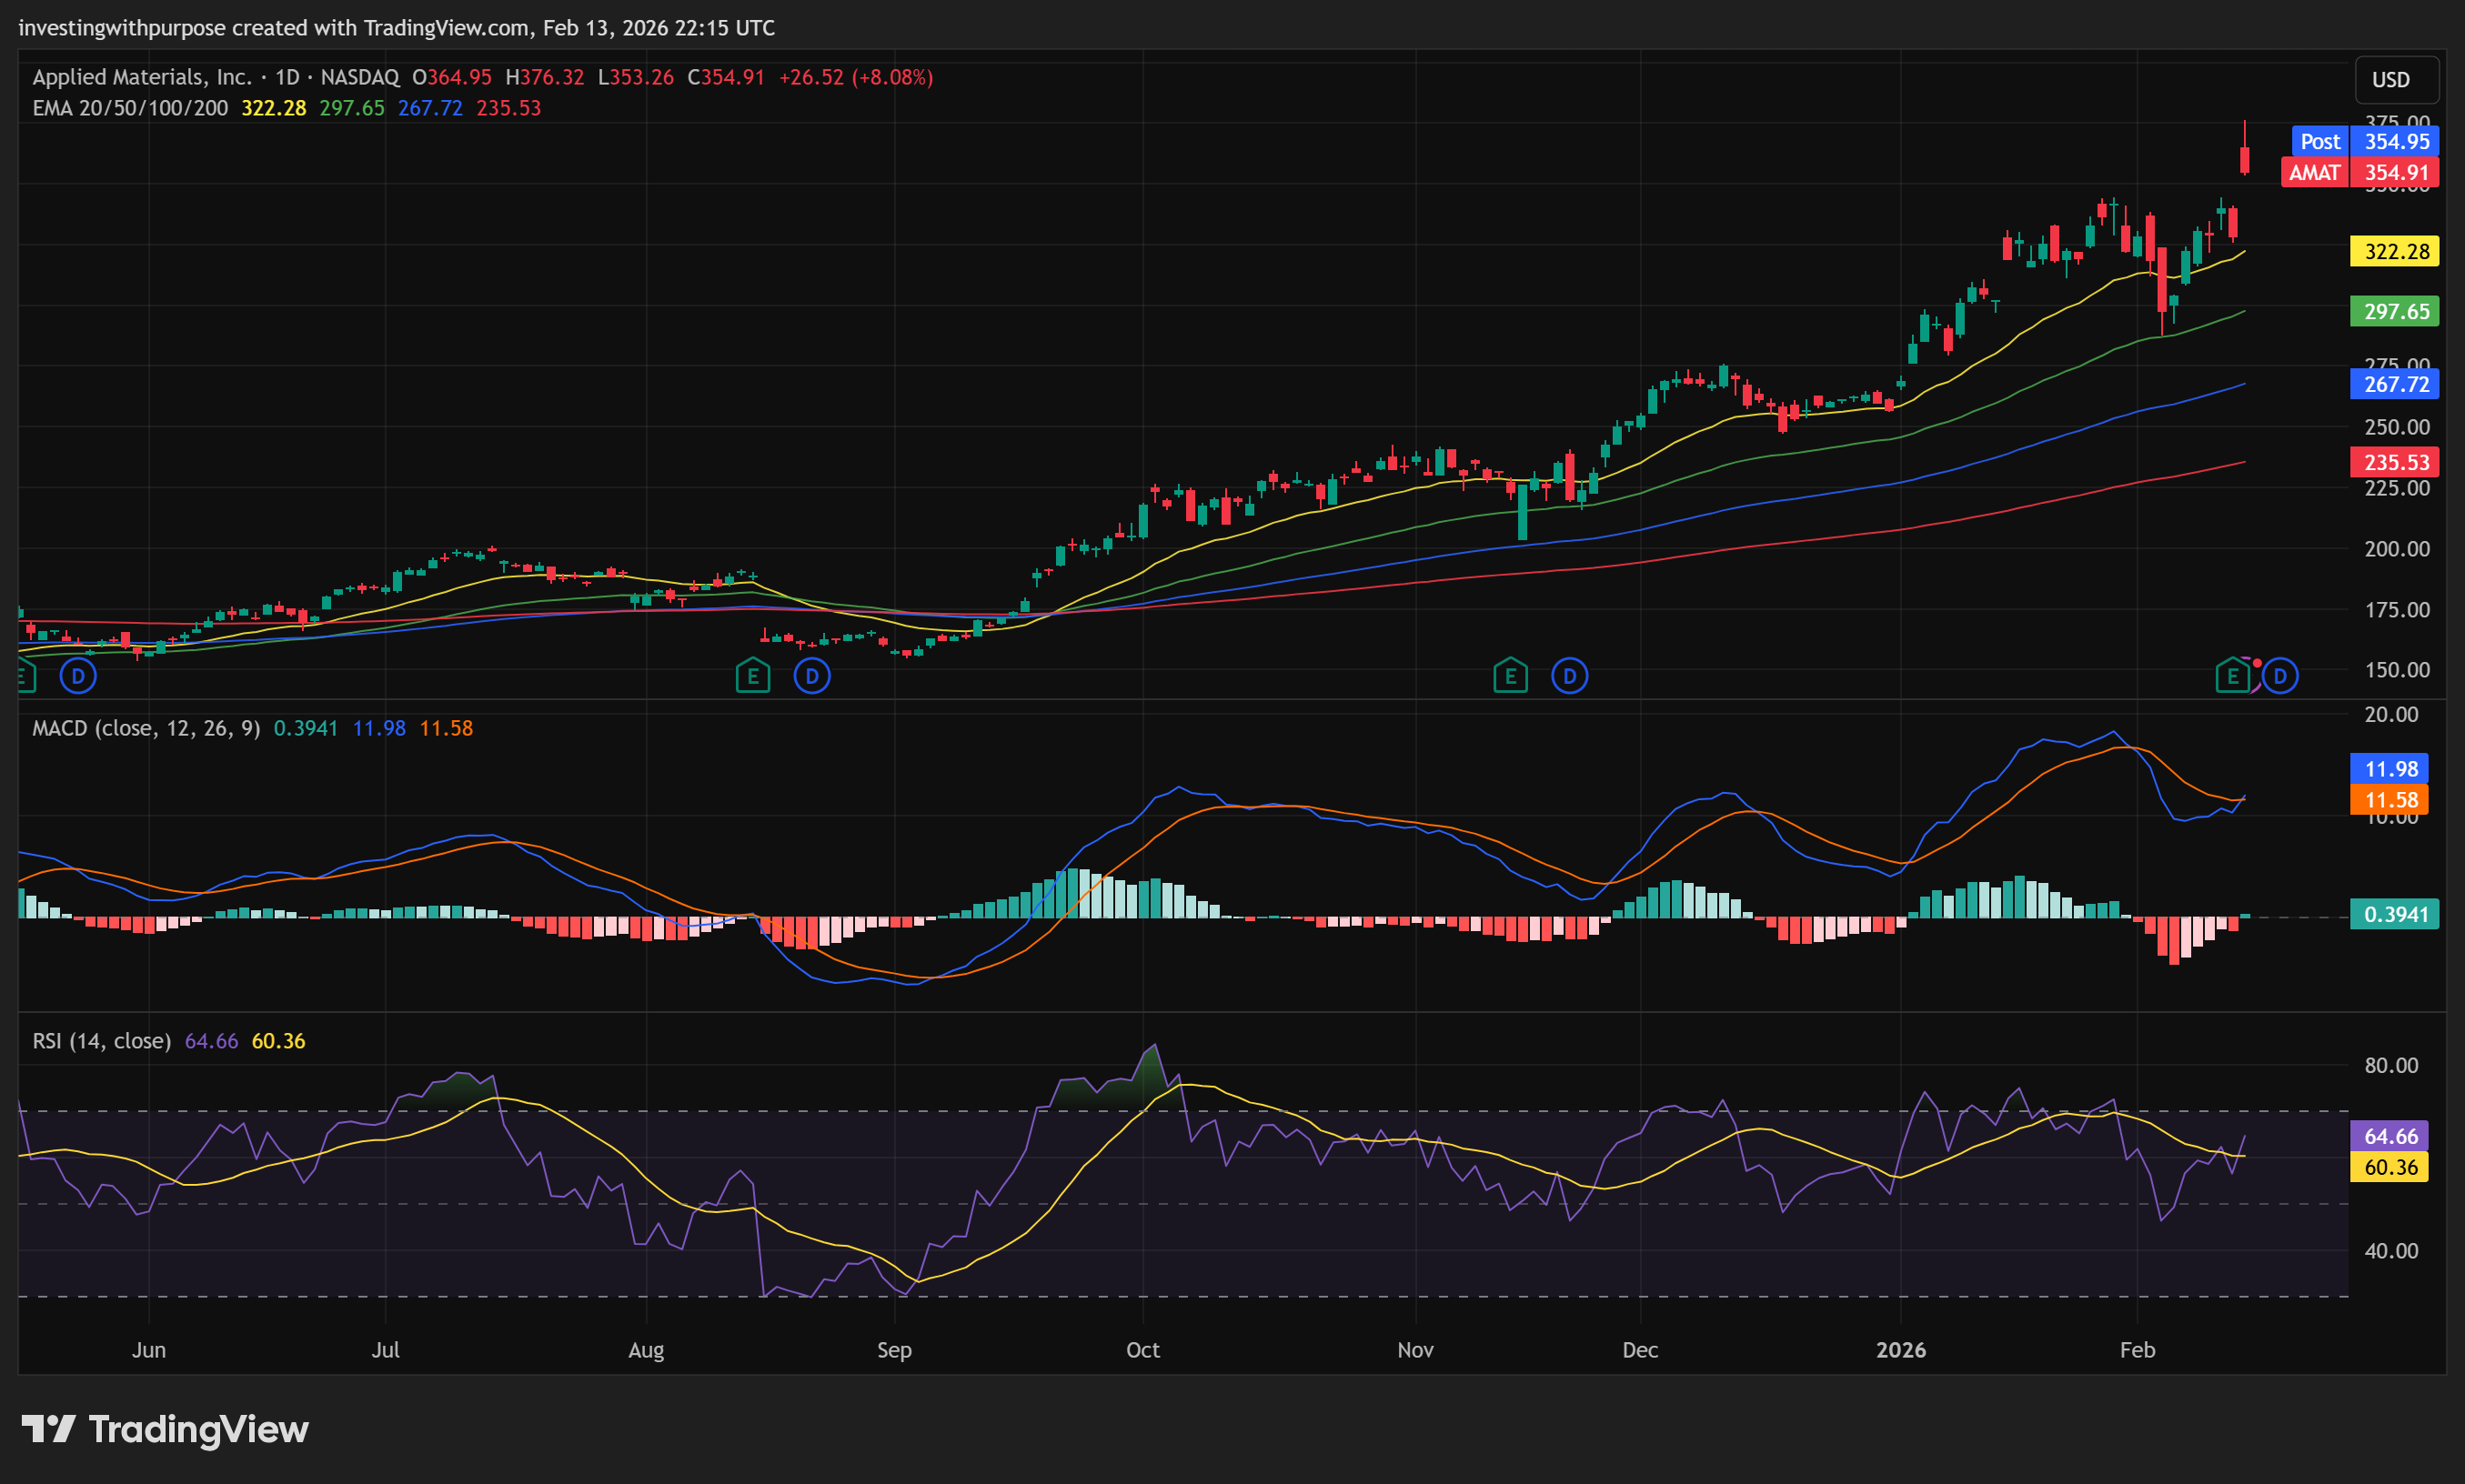
Translation: volatility has expanded. Pullbacks of 15 to 25 points are statistically normal in this regime.
If price holds above 350 on a daily close, the breakout is being accepted.
If it loses 350 and fails to reclaim it quickly, a deeper reset toward 342 or even 331 becomes probable without breaking the long-term trend.
Short-Term Structure
Near-term resistance sits between 357 and 365.
357 is the weekly extension magnet.
364 to 365 is the next measured extension cluster.
Momentum remains constructive on daily and 4H frames, but short-term oscillators are stretched.
This is not a broken chart. It is an extended one.
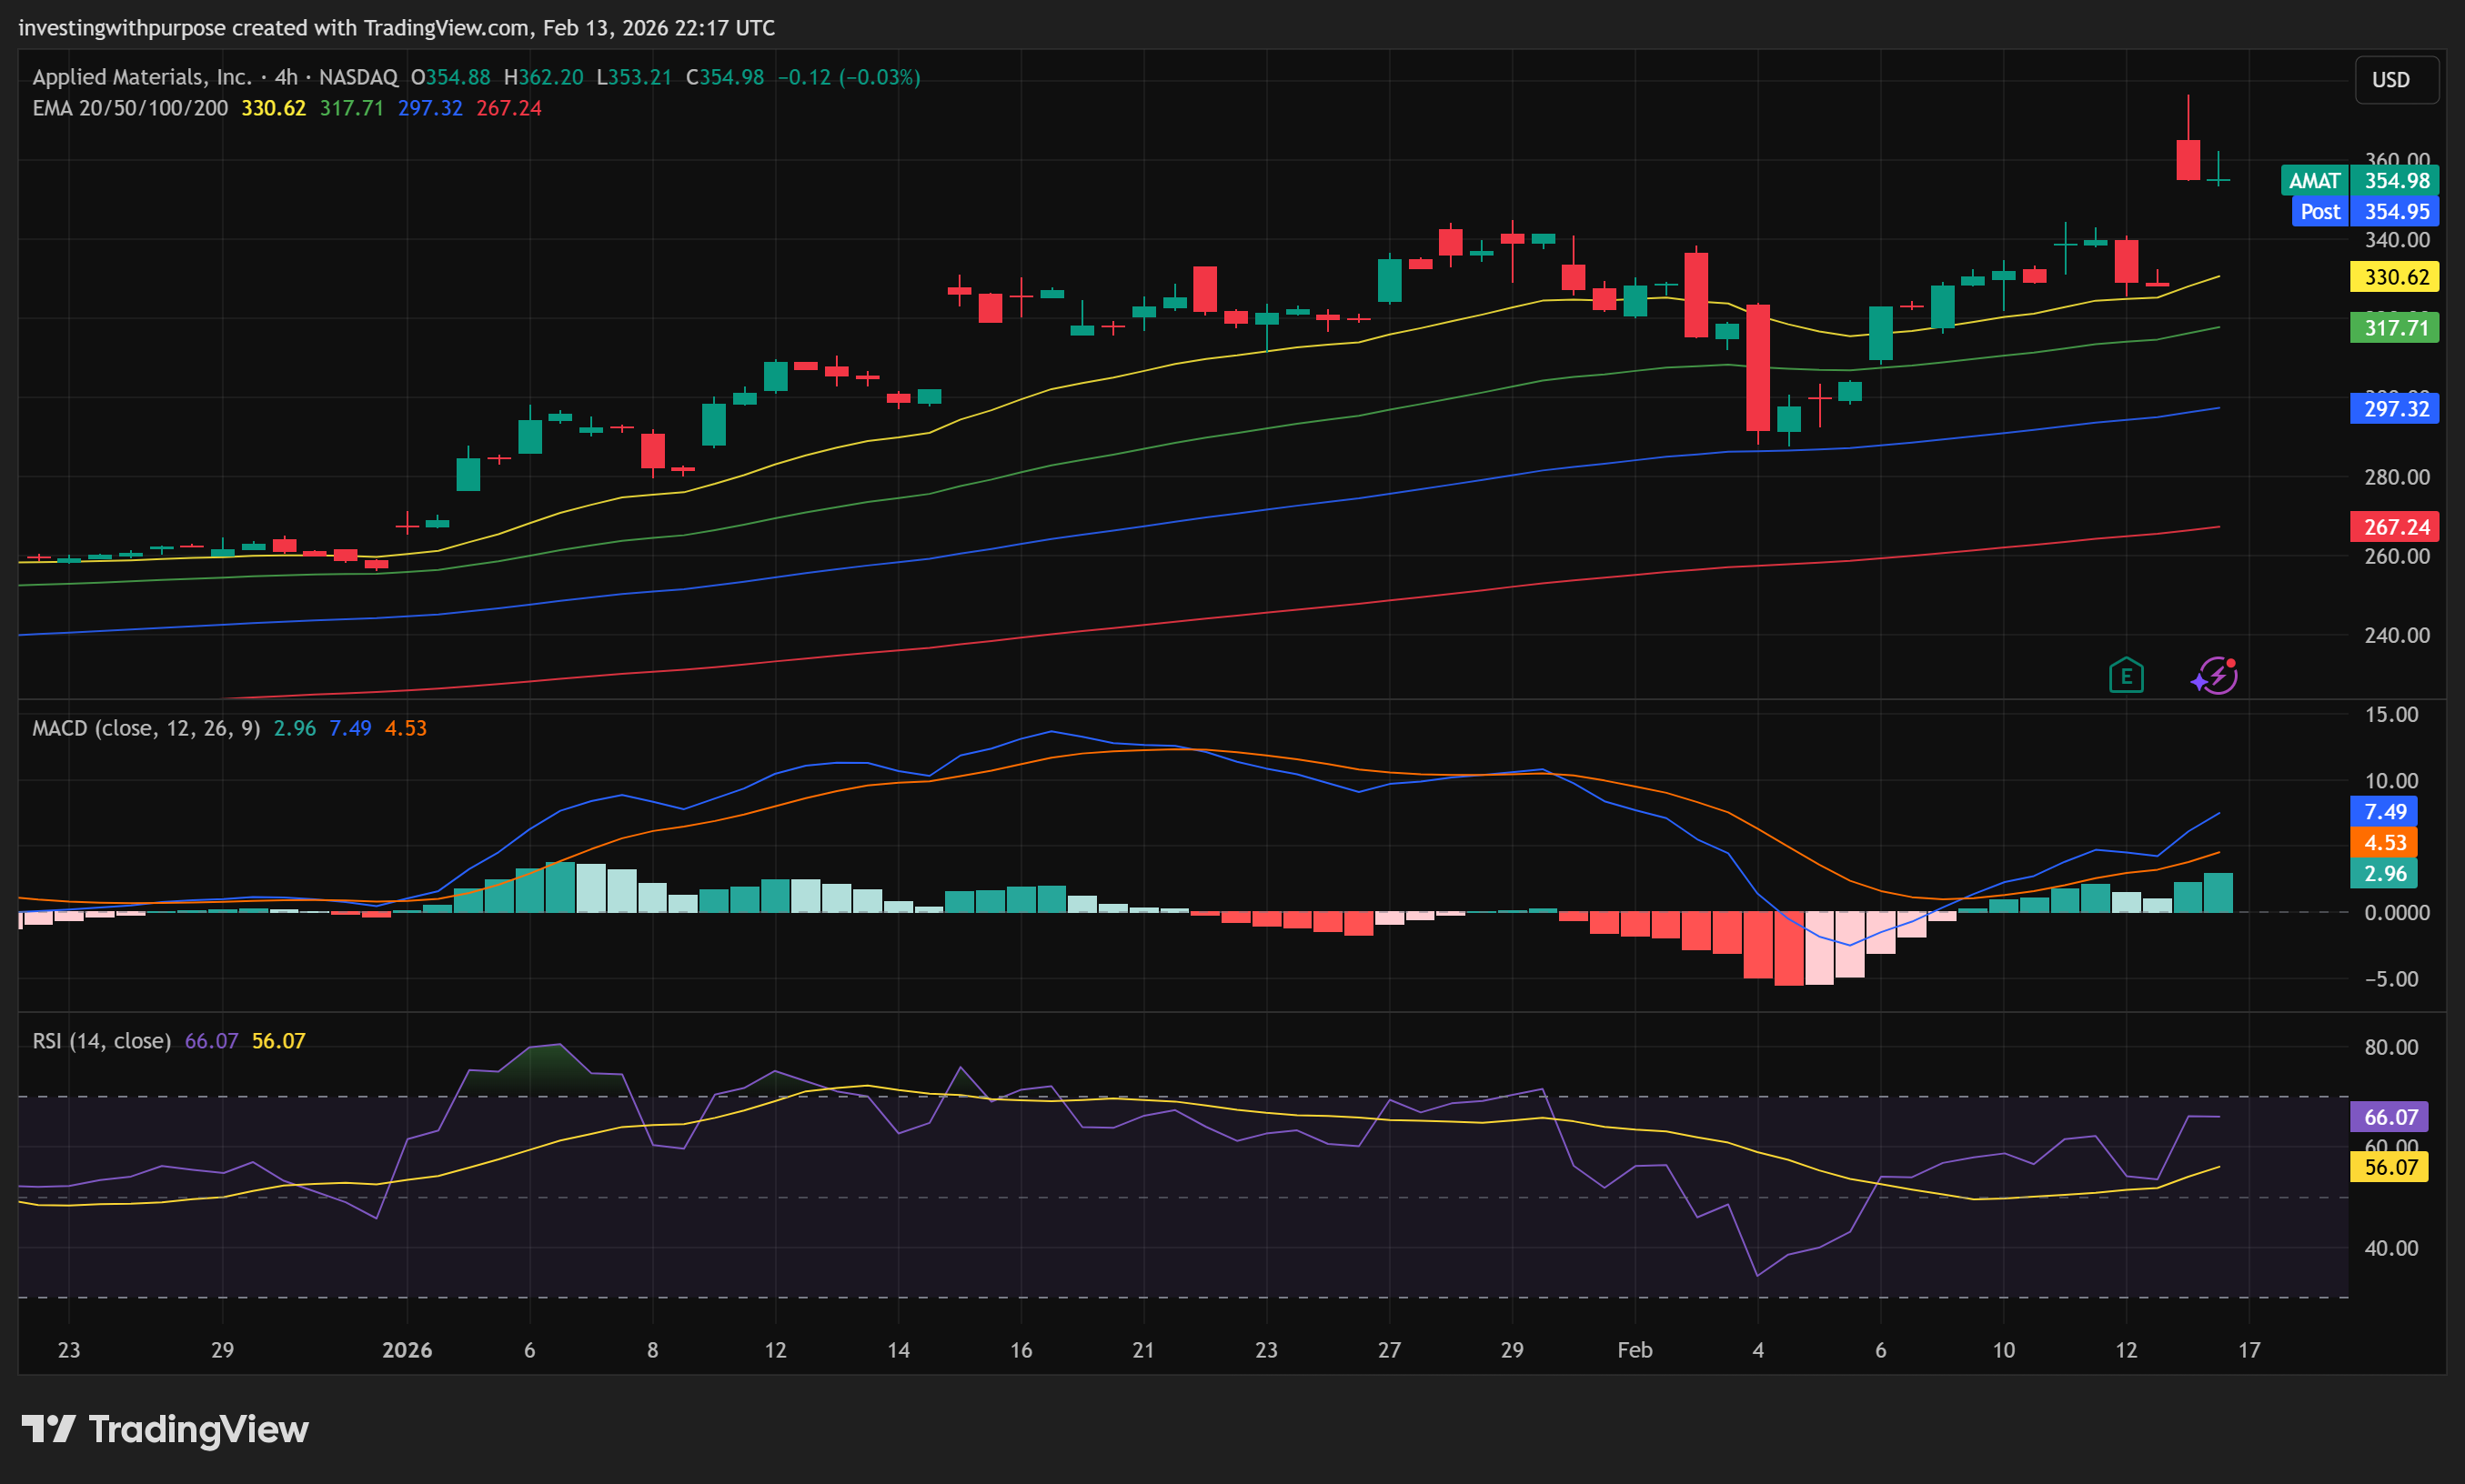
The primary trend is bullish. The stock is extended into resistance and requires either consolidation above 350 or a controlled pullback before sustainable continuation.
Trade Plan
This plan integrates structure and volatility.
