


AppLovin grew revenue 53% at a 78% GAAP operating margin and landed inside its own revenue guidance range, just 0.3% below the midpoint, with adjusted EBITDA about 1% under its midpoint.
That was enough: the first sub-midpoint quarter in its public history cost the stock 20% in a day and a fresh 52-week low, with the call adding the phrase investors least wanted to hear, model improvements “lighter than normal,” and a Q3 guide without the usual cushion.
What’s left trades near 26x trailing GAAP earnings and about 16x 2027 consensus EPS, and that gap is the whole debate. Cheap is a condition, not a signal.

A 0.3% midpoint miss ended the perfection premium. What remains is a value multiple attached to a 53% grower, and a question.
AppLovin reported Wednesday, August 5 after the close, and Thursday’s session did the grading: down 19.7% to $335.67, with an intraday print at $332.19 that marked a new 52-week low, in a stock that traded at $745.61 in February. Our July 19 piece called this setup in advance, concluding the trend was “broken until 460 is reclaimed”; 460 was never reclaimed, no entry was ever signaled, and readers following that framework were flat through Thursday’s gap. Prices are based on the August 6, 2026 close, a complete reaction day; results are from the release, the call, and the filed quarter.
Key Takeaways
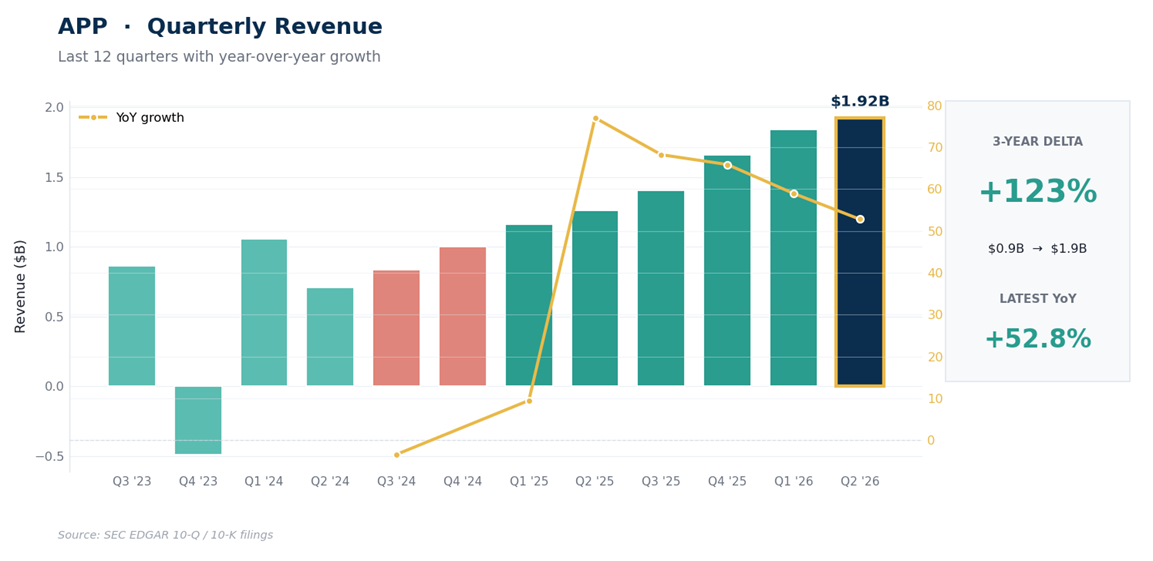
The quarter grew 53%: revenue of $1.92B landed inside the company’s own guidance range but 0.3% below its midpoint, adjusted EBITDA of $1.61B missed its midpoint by about 1%, GAAP EPS was $3.76, and margins printed 77.7% operating and 66% net, filed numbers, not adjusted ones.
The blemish was historic by this company’s standard: per Piper Sandler, 30 basis points below the revenue midpoint and 100 below the EBITDA midpoint made this AppLovin’s first sub-midpoint quarter since going public.
The wound that mattered was qualitative: management described the quarter’s AXON model improvements as “lighter than normal,” which touches the exact durability question that has hung over the story all year.
The result is a valuation anomaly: about 26x trailing GAAP earnings and roughly 16x 2027 consensus EPS for a 53% grower, with the caveat that the estimates themselves are now the question.
The map: decision zone 320 to 336 (the stock closed inside it, on a fresh 52-week low), invalidation at a daily close below 298, repair at 392, references 420, 443, and 460.
The Quarter, on Its Own Terms
The filed numbers describe a machine still running hot. Revenue of $1.92B grew 53% from a year earlier. GAAP operating income was $1.49B, a 77.7% operating margin, and net income of $1.27B put the net margin near 66%, margins with almost no comparison in public software, let alone advertising technology.
The stumble that triggered everything was tiny: revenue landed inside the company’s own $1.915B to $1.945B guidance range but 0.3% below its midpoint, and adjusted EBITDA of $1.614B came in $1M under the low end of its range, about 1% below the midpoint. In most stocks, in most months, that’s rounding.
AppLovin hasn’t been most stocks: its premium was built across 2 years of beating without exception, and Piper Sandler flagged this as the first quarter since its IPO below its own guidance midpoints. A streak that long becomes part of the price. Wednesday it ended.
Why 0.3% Cost 20%
The proximate math is expectations; the deeper story is the moat. AppLovin’s advertising engine, AXON, compounds by shipping model improvements that lift advertiser returns, and the bull case has always rested on that cadence continuing. 3 things got repriced at once. The miss broke the streak.
The model comment, improvements “lighter than normal,” made investors question whether the streak can restart. And the Q3 guide offered no relief: $2.055B to $2.085B centers at $2.070B, slightly below the $2.074B to $2.083B the Street had penciled in, a guide without the cushion AppLovin usually builds. Beneath all 3, a quieter reset: BofA wrote that it no longer models AppLovin becoming the large-scale channel for web advertisers it once projected, trimming the e-commerce expansion that carried part of the premium.
Management’s rebuttal deserves equal print: the next model improvement landed just after quarter-end, and the company said it sees no weakening in advertiser demand and no change in the competitive environment. It’s worth being precise about what didn’t happen: growth didn’t stall and margins didn’t crack. The market repriced the second derivative, not the level; the worry isn’t that growth disappeared, it’s that the rate of improvement in the engine driving future growth may be slowing. Our July 19 comparison piece put that exact question at the center of the premium; Thursday was the market marking the probability down.
The Valuation Case, Stated Honestly
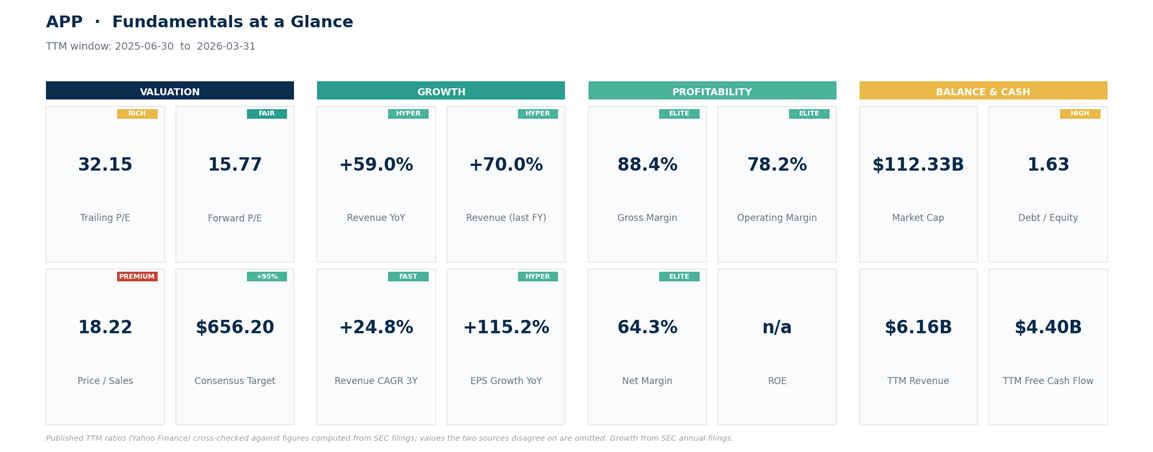
Here’s the formulation that tells the story. At $335.67, AppLovin trades near 26x trailing GAAP earnings, the last 4 quarters of diluted EPS sum to $13.01, but only about 16x 2027 consensus EPS, which sits near $21 on the feed our dashboards use, struck at the August 6 close.
That gap is the entire debate: the market is still pricing a roughly 65% earnings ramp from here to there; it has simply stopped paying a premium multiple on top of the growth assumption. Nothing else we’ve covered this season pairs numbers like these; the closest multiple, Qualcomm’s 15.5x, is attached to negative growth.
The catch is the denominator. That $21 estimate already embeds continued AXON gains, gaming strength, and the consumer-advertising expansion the Street is now re-marking. Move the estimates down 15% and 16x becomes about 19x with the price standing still.
A 20% single-day repricing on a 0.3% revenue-midpoint miss says the market isn’t arguing with the multiple; it’s arguing with the E underneath it. The re-marking has already begun: within a day, Piper Sandler cut its target to $385 from $665 with a downgrade to Neutral, BofA went to $430 and Needham to $500, and post-earnings coverage reported further cuts at Wells Fargo (to $357, with a downgrade) and Goldman (to $465), a first-day wave of reductions running roughly 20% to 40%.
Notice what even the freshly slashed targets have in common: all of them sit at or above the price. Our feed’s $656 consensus mean hasn’t absorbed the wave; treat it as an artifact. The next report, expected in November though not yet confirmed by the company, is the next hard data point; until then, the argument is between the filed margins and the estimate path.
The July Framework, Scored
Our July 19 map for AppLovin said the stock was broken until it closed back above 460, offered a stabilization zone at 400 to 414, and set invalidation at a daily close below 392. Score it: 460 was never reclaimed, so the framework never signaled an entry, and the invalidation brushed its line on July 24 with a $391.98 close, 2 cents through it, which the disciplined would treat as fired. Either reading produced the same position into Wednesday’s report: none. The stock then lost 20% in a session. This is what the “broken until repaired” construction is for; the repair never came, so neither did the exposure.
The Map From a 52-Week Low
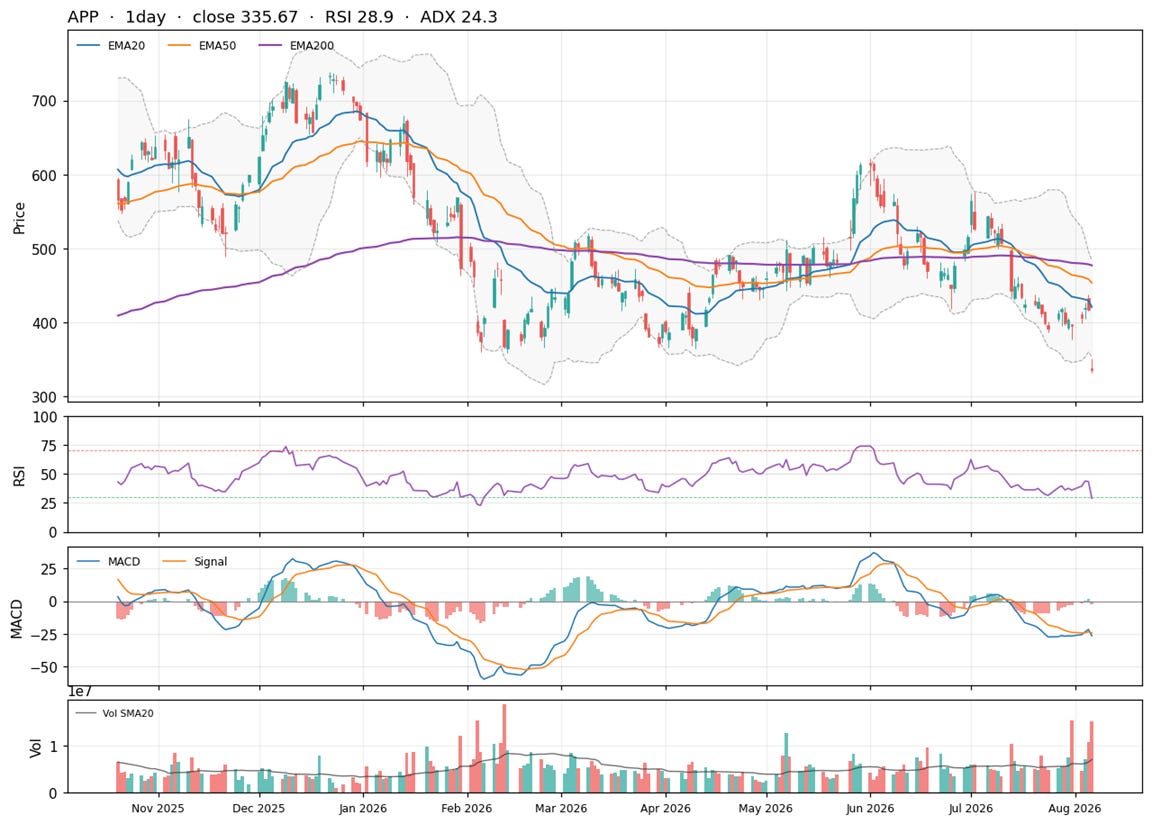
One possible framework, not a promise, and the honest preamble first: the stock closed below its lower Bollinger band on a fresh 52-week low with a daily momentum reading of 29 (oversold), and its 14-day average true range is 8.8% of price. There is no price structure beneath a 52-week low, only round numbers and older history, which makes the downside rules blunter than usual. All triggers are daily closes.
Decision zone: 320 to 336. The stock closed inside it, at the fresh low. A hold here on daily closes is the first evidence the repricing has found its level.
Invalidation: a daily close below 298, under the round $300 the market is already watching. Below that, the market isn’t debating the estimate path anymore; it’s pricing the model itself as broken, and no multiple argument overrides that.
Repair: a daily close above 392 reclaims the old invalidation line, now the overhead test, with references at 420 (the pre-report shelf), 443 (the 61.8% retracement of the recent leg), and 460, the level the July piece named as the trend repair, which still stands.
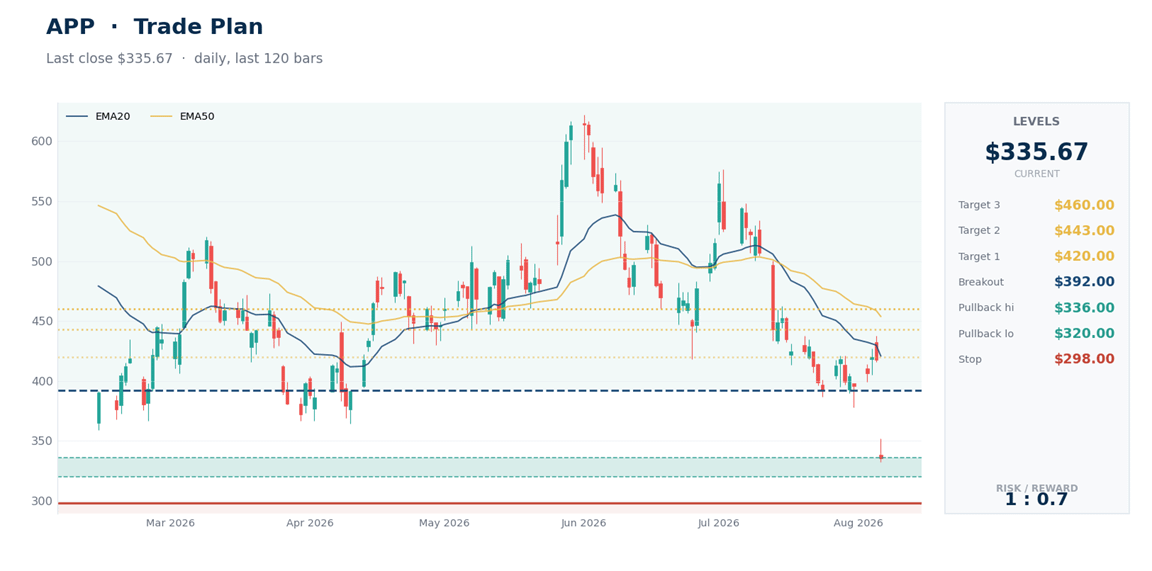
For fresh capital (illustrative): this is the same shape as Meta last week, a falling knife with a nearby round-number floor, and the same discipline applies. The patient routes are a hold of 320 to 336 across several daily closes, or the 392 repair for those who’d rather pay up for confirmation. A fill near 328 against the 298 line risks about 9%, and in an 8.8%-range stock the gap risk runs well past plan; size so a 15% to 20% adverse move stays inside your portfolio risk budget.
Between now and the next report, expected in November, the evidence is any advertiser-facing data on AXON performance, where the target cuts settle once the first-day wave finishes, and whether 320 to 336 holds on closes.
Bottom Line
The numbers say this is now the cheapest growth story we cover: 53% growth, 78% operating margins, 16x the 2027 consensus. The price action says the market has stopped trusting the denominator, and a sub-1% miss, softer model progress, and a guide without the usual cushion were enough to end a perfection premium that had survived 2 years. Both can be true, which is why this isn’t a bottom-call; it’s a framework. If 320 to 336 holds and the estimate revisions come through modest, the anomaly resolves upward and 392 is the confirmation. If 298 goes, the market is repricing the machine, not the quarter. We’d let the level and the revisions answer it, in that order, before the multiple tempts anyone into answering it early.
This is research and commentary, not personal investment advice. Levels and trade plans are illustrative; size positions to your own risk tolerance and time horizon. The author may hold positions in names discussed.