


ASML reported €9.3B in Q2 sales at a 54.0% gross margin, raised full-year guidance for the second time this year, and the ADR is gapping 4% to 5% higher toward its June record near $2,000.
The most important bottleneck in advanced chipmaking just raised its forecast again.
Most leading-edge AI chips depend on manufacturing processes that run on ASML’s lithography systems, which makes the company the closest thing the AI buildout has to a tollbooth. The toll just went up. Q2 sales of €9.3B and a 54.0% gross margin both came in above the company’s own guidance, and the full-year outlook moved to €43B to €45B, a second raise this year that implies 32% to 38% growth over 2025.
Here’s the tension that governs everything below: ASML just increased the growth investors can reasonably expect, and it increased the execution investors must pay for in advance by exactly as much. The ADR trades in the mid-$1,800s premarket as I write, about 8% below the June record. 3 numbers matter more than the rest of this article: the 1800 to 1830 entry band, the 1712 invalidation, and the roughly €26B of H2 revenue the new guide now requires.
Key Takeaways
Q2 sales of €9.3B grew about 21% year over year and beat the €8.4B to €9.0B guide, with the upside coming mostly from Installed Base Management, the service and upgrade line, at €2.762B.
The new full-year guide of €43B to €45B at a 54% to 56% gross margin makes H2 the story: H1 delivered €18.1B, so the back half must produce about €26B. The Q3 guide alone implies 46% to 60% growth.
ASML is expanding EUV and DUV immersion capacity about 30% for 2027 and studying another 30% for 2028, funded from roughly €5.3B of net cash and a 52% return on equity.
In the mid-$1,800s the ADR trades near 61x trailing earnings. At 40x, an $1,850 price needs about $46 of ADR EPS; trailing EPS is $30.36. The growth is being paid for up front.
The trade: entries at 1800 to 1830 on a fade, warning on a close below 1750, invalidation below 1712, targets at 1945, 2005, and 2285.
What Changed
The print itself was clean: €9.3B of sales against an €8.4B to €9.0B guide, gross margin of 54.0% against 51% to 52%, net income of €2.9B, EPS of €7.59. Composition matters as much as the beat, though. The upside came primarily from Installed Base Management, the service and upgrade revenue ASML earns on machines already in customer fabs. That’s the most durable line in the model, so it’s a high-quality source of a beat, but it’s also not the same thing as customers pulling forward new system orders.
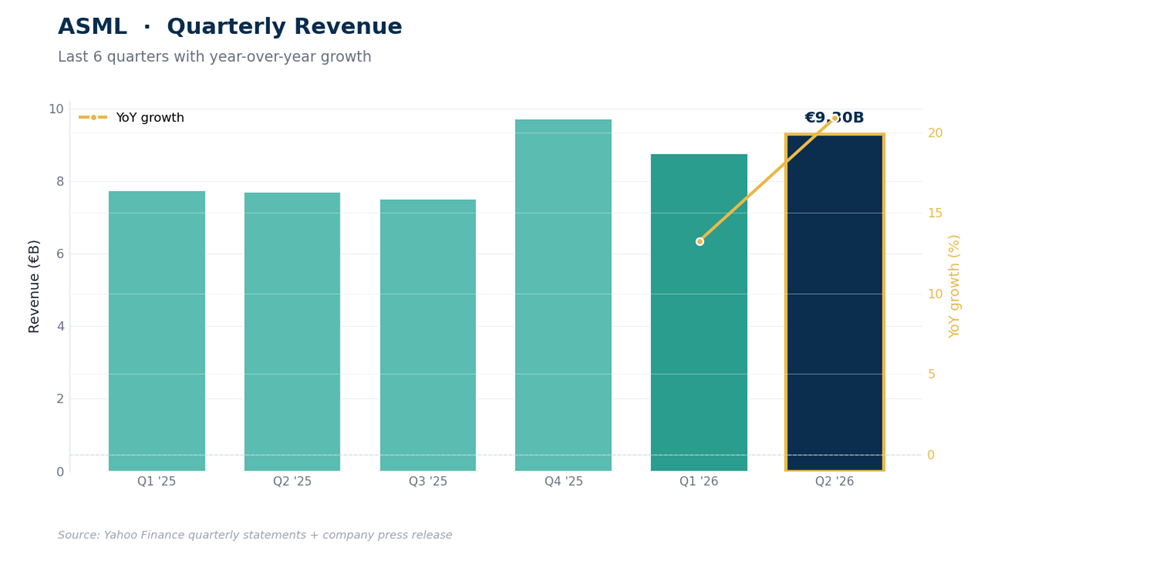
The guide is the real event, and the arithmetic deserves to sit in the open. Full-year guidance moved to €43B to €45B at a 54% to 56% gross margin, from €36B to €40B, and that prior range was itself a raise. H1 came in at €18.1B, so the new midpoint requires roughly €26B in H2; the Q3 range of €11.0B to €12.0B alone would be up 46% to 60% year over year. Management attributes the demand to AI-related spending across a customer set that now includes Intel running High-NA EUV in production, and it’s backing the words with capacity: system output up about 30% for 2027, with another 30% under study for 2028.
One structural caveat: ASML stopped disclosing quarterly bookings this year and now describes order intake only qualitatively. That removes the number investors used to lean on to check demand between reports, so the guide has become the main forward-looking disclosure, each print carries more weight, and drawdowns between prints will be harder to argue against with data. Priced-for-execution stocks feel that asymmetry.
The Fundamentals and the Price
Housekeeping first: ASML reports in euros while the ADR trades in dollars, so statement figures are euros and price levels are ADR dollars. The business generates cash at a rate that funds the whole expansion internally: over the 12 months through March, €33.7B of revenue produced €11.1B of operating cash flow and €8.9B of free cash flow, with a 52% return on equity, €8.0B of cash against €2.7B of debt, plus €1.1B of Q2 buybacks and a €1.88 interim dividend. Margins are the moat made visible: 52.6% trailing gross margin, 36% operating margin, and a guide that says gross margin rises further as volume ramps.
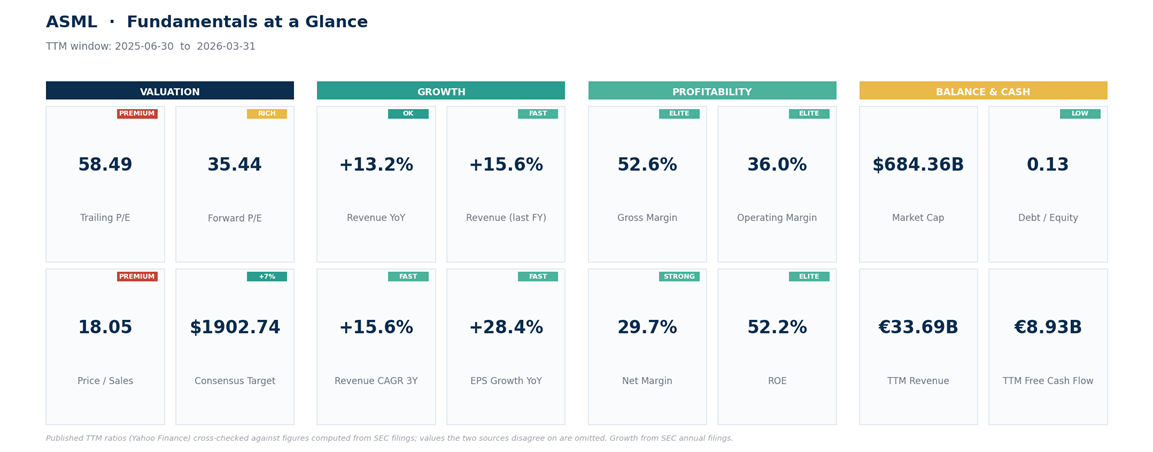
Now the price of it. Near $1,850 the ADR trades around 61x trailing earnings, and a simple bridge shows what has to be true for that to be reasonable: at 35x, $1,850 requires about $53 of annual ADR EPS; at 40x, about $46; at 45x, about $41. Trailing EPS is $30.36.
Run the new guide through last year’s cost structure and 2026 ADR EPS lands somewhere in the mid-$40s (a rough estimate, not a forecast), which would put the stock a bit above 40x this year’s guided earnings. That’s a premium multiple on numbers that still have to be delivered.
Analyst positioning tells the same story from another angle: 39 of 44 ratings are buy or strong buy, yet the mean target ($1,903 on Yahoo’s pre-report consensus) sits only about 3% above the premarket price. Targets will likely be revised up after the raise, but that’s an expectation, not evidence.
The Risk Ledger
The bear case is broader than one bad quarter, so it’s worth naming the pieces separately.
Execution and timing first: with the year this back-loaded, revenue can slip between quarters for reasons that have nothing to do with demand, like fab readiness, installation schedules, and acceptance timing, and a stock at 61x trailing doesn’t distinguish gracefully between “pushed out” and “lost.”
Regulation second: export controls on China can affect system sales, servicing, and upgrades independently of AI demand, and that risk arrives by headline, not by earnings calendar.
Concentration third: a handful of logic and memory customers drive the cycle, and any one of them rescheduling capex moves ASML’s numbers. High-NA fourth: strategically decisive for the next node, but adoption speed and throughput economics still have to be proven at production scale.
And running through all of it, the visibility problem above: with bookings undisclosed, the October report is the next scheduled test, but this stock can be repriced any week in between.
The Technical Map
Trend: the weekly structure is firmly bullish. The ADR is up roughly 110% in 12 months, and the weekly trend-strength gauge (ADX 40, with buying pressure dominant) reads like an established uptrend rather than an aging one.
Momentum: weekly RSI, a 0-to-100 momentum gauge, sits at 65, elevated but short of the extremes that have marked prior tops. Daily momentum had fully reset to neutral before the report.
Structure: from the June 30 record at $1,999.96, the stock corrected 14% and found buyers 4 times at the 1715 to 1750 shelf, a correction that may now have established a durable floor.
Support: 1820 to 1830, where the 20-day average ($1,826) and the 23.6% retracement of the spring rally ($1,823) overlap, then the gap down to yesterday’s $1,776 close, then the shelf.
Resistance: 1930 to 2000 threw price back twice in late June on heavy weekly reversals; that band is the proving ground. Above the record there is no historical resistance to map.
Failure: a daily close below 1712 undercuts the shelf and ends the setup.
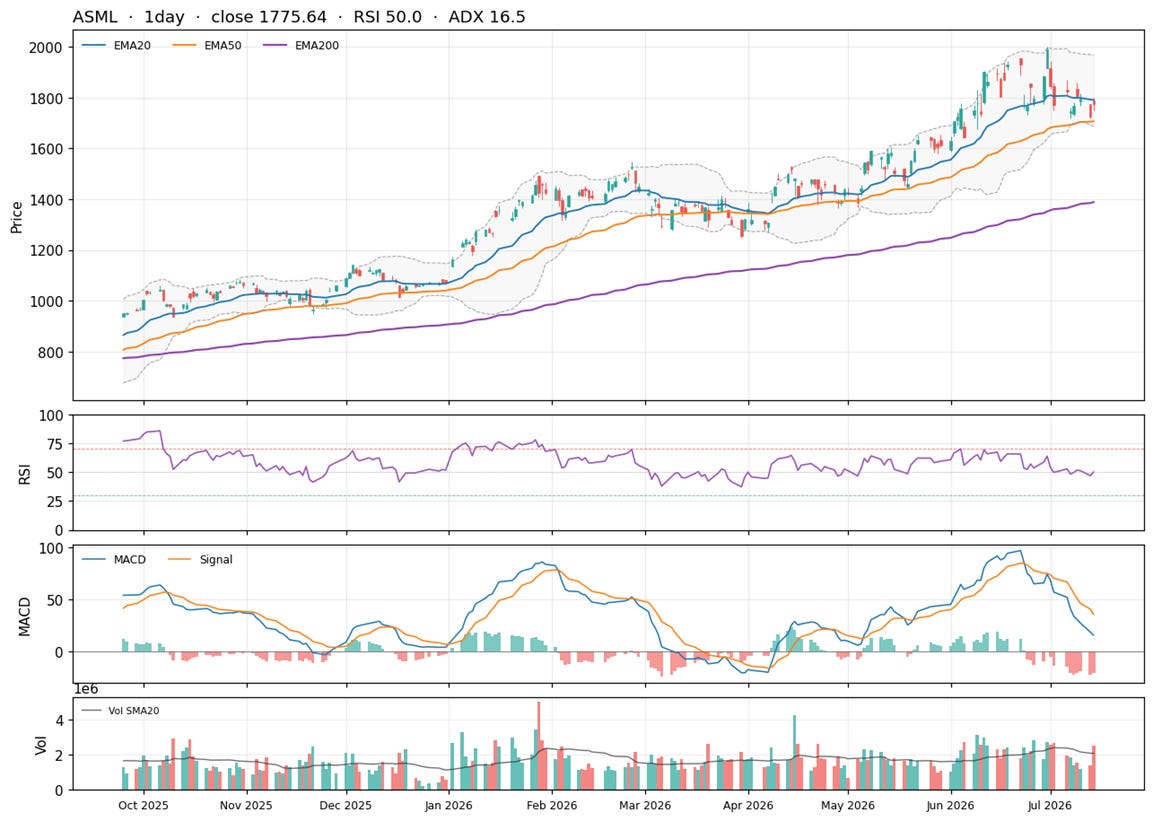
Net read: a strong weekly uptrend, a correction that may be complete, and a fundamental catalyst gapping price back into the June congestion. Even strong earnings gaps often spend a few sessions digesting, so the plan below doesn’t assume a straight line to the record.
The Trade Plan
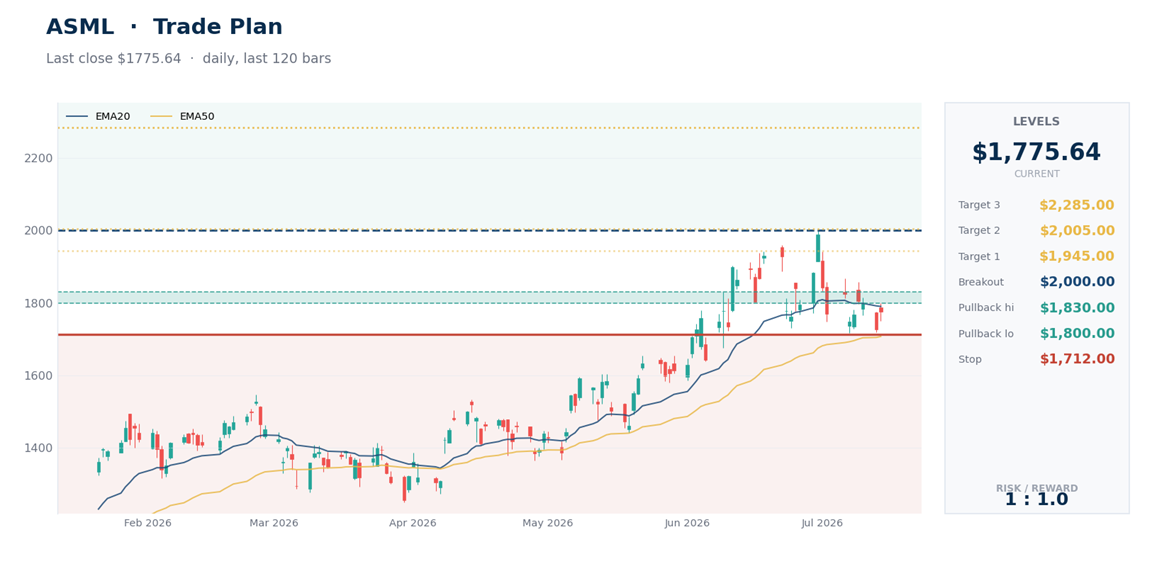
Starter entry: 1800 to 1830. The gap-top band: the 20-day average, the 23.6% retracement, and the round 1800 level. A post-earnings fade into this zone is normal digestion, not a failed reaction.
Add zone: 1750 to 1780. A full gap fill to yesterday’s close and the top of the July shelf. Better price, tighter distance to invalidation.
Breakout alternative: a daily close above 2000. Clears the record with the June supply behind it. If it triggers, the stop is a close back under 1930, not 1712.
Warning level: a daily close below 1750. By then the gap has fully filled and price is pressing the July shelf from above, the market’s way of saying the raise was already priced in. Stop adding and let the shelf give its verdict.
Invalidation: a daily close below 1712. That undercuts the shelf that held 4 times in July; the post-earnings reaction has failed, and the exit applies to both buy zones.
Targets: 1945 first (the heart of the June rejection zone), then 2005 (the record zone), then 2285 (the July range height projected above the record).
Rolling stop: at 1945, lift the stop to your entry zone. Through 2005, trail under each higher weekly low.
On sizing: from an $1,815 entry with the stop at $1,712, trade risk is about 5.7%, and that’s position risk, not portfolio risk. Divide your portfolio risk budget by the trade risk: a 0.5% budget caps the position near 9% of the portfolio, a 1% budget near 18%. This stock moves about 5% a day right now, so err small. The October report is the next scheduled catalyst, but as the risk ledger says, unscheduled ones exist.
Bottom Line
The report raised what investors can reasonably expect from ASML, and the market responded by raising what investors must pay for it. Both moves are rational; together they leave less margin for error than either alone. The fundamental test is now concrete: a Q3 print inside the €11B to €12B range keeps the €26B H2 on track, and a miss turns the year’s story into a pushed-out promise.
The price discipline is just as concrete. Buy fades into 1800 to 1830, add only on a full gap fill near 1750 to 1780, stop adding on a close below 1750, and exit below 1712. While the July shelf holds and the H2 ramp stays on track, pullbacks are more likely consolidation than trend break. If either condition fails, so does the setup, and no quality argument should keep you in a broken one.
This is research and commentary, not personal investment advice. Levels and trade plans are illustrative; size positions to your own risk tolerance and time horizon. The author may hold positions in names discussed.