
AST SpaceMobile: The Bet That Could Rewrite Connectivity
A sober look at a high-upside satellite-to-cellular story, with real numbers and real risk.

Big vision, big capex, a chart that finally turned. Let’s see what is actually priced in.
AST SpaceMobile ASTS 0.00%↑ sits in that uncomfortable part of the investment universe where the upside is huge and the financials are still ugly. The company wants to light up ordinary mobile phones from space, working with major carriers rather than against them. If it pulls this off, it is effectively building a new layer of global telecom infrastructure.
Over the last year the business has moved from “all research, no revenue” into its first steps of commercialisation. The stock followed, bouncing from about 50 to the mid 70s in a very short time.
That combination is tempting, but it is exactly where you want to slow down, put numbers on the story, and ask a simple question: is this something to trade around or something to own through pain and volatility.

Key Takeaways
• Trailing twelve month revenue is about 18.5 million, but the last quarter alone contributed 14.7 million. The top line is inflecting, it is not yet stable or recurring.
• Over the same twelve months the company lost about 426 million at the operating line and about 304 million at the net income line. Operating margin is roughly negative 2,300 % and net margin roughly negative 1,600 %.
• Cash flow from operations over the last four quarters was about negative 165 million. Capex was roughly negative 751 million. Free cash flow was about negative 916 million.
• The balance sheet is big and equity funded. Total assets are about 2.55 billion, common equity roughly 1.24 billion, liabilities about 925 million, minority interest around 386 million, and cash about 1.2 billion. Long term and current interest-bearing debt come to about 720 million, so net cash is still roughly 480 million.
• On the technical side, the stock has rallied from roughly 50 to the mid 70s, bounced into heavy resistance around 75 to 82, and is technically extended in the short term.
• The highest quality entries are on controlled pullbacks into the 66 to 68 zone, or deeper into 62 to 64. A breakout only has real quality if price can close and hold above about 82.
Where The Business Stands
Revenue and growth
The income statement finally shows real activity.
For the quarter ending September 2025, AST SpaceMobile reported:
Revenue of 14.7 million, up from 1.2 million in the June quarter and 0.7 million in March.
Compared with roughly 1.1 million in the same quarter a year earlier, that is about 1,240 % year-on-year growth.
Trailing twelve month revenue, using the last four quarters, comes out at about 18.5 million.
In other words, most of the last year’s revenue arrived in a single quarter. That tells you two things. First, there is genuine commercial progress. Second, the business is still very early. This is milestone and project driven revenue, not yet a steady run-rate of recurring satellite service income.
![Satellite Internet Market Size, Share | Global Report [2032]](https://substackcdn.com/image/fetch/$s_!AEPD!,f_auto,q_auto:good,fl_progressive:steep/https%3A%2F%2Fsubstack-post-media.s3.amazonaws.com%2Fpublic%2Fimages%2Ff1a3c35f-1aed-4bdf-9a1b-e7a96df0a73b_1160x700.webp "Satellite Internet Market Size, Share | Global Report [2032]")
Margins and cost structure
The September quarter shows:
Cost of revenues of about 5.5 million.
Gross profit of 9.2 million and gross margin about 63% for the quarter.
For the trailing year, total gross profit is roughly 13.0 million on 18.5 million of revenue, so gross margin looks close to 70%. That sounds extremely healthy, but it is distorted by mix and timing. Most satellite costs are still sitting in R&D and capital expenditures, not yet flowing cleanly through cost of goods.
On the operating cost side, the last four quarters add up to:
Research and development of roughly 152 million.
General and administrative expense of about 85.8 million.
Relative to the 18.5 million of revenue, R&D alone is over 800% of sales, and G&A is more than 400%. That is normal for this stage but underscores that the P&L is not even close to economic breakeven.
Operating income for the trailing year is about negative 426 million. Net income to stockholders is about negative 304 million.

Cash flow and capex
The cash flow statement makes the capital intensity very clear:
Over the last four quarters:
Cash from operations totals about negative 164.9 million.
Capital expenditures total about negative 751.1 million.
Free cash flow is roughly negative 916 million.
So the company is spending close to a billion in cash in a year, combining operating burn and capex, against less than 20 million in revenue.
On the financing side, there has been a mix of equity and debt funding. Recent quarters show meaningful inflows from financing activities, including equity issuance and some net borrowings, which is how the company got to its current cash balance.

Balance sheet and runway
The balance sheet at September 2025 looks like this, in round numbers:
Cash and equivalents about 1,204 million.
Total assets about 2,551 million.
Total liabilities about 925 million.
Common equity about 1,241 million.
Minority interest about 386 million.
Long term debt, current portion of long term debt, and capital lease obligations together are about 720 million. With 1.2 billion of cash, that leaves net cash around 480 million.
Cash is roughly 47% of total assets. Total liabilities are about 36% of assets. Common equity represents close to 49% of assets. For a company burning this much cash, that is a respectable capital structure. The risk is not current leverage, it is future funding if execution slips.
If you take the recent free cash flow run rate of negative 916 million and compare it to management’s broader liquidity number, the implied runway is measured in a few years, not quarters. That is enough time to launch and monetise the first constellation if things go reasonably well, but not enough time to absorb multiple major missteps.

Valuation context
The market is already treating AST SpaceMobile as a potential category winner. Using rough, public numbers, the stock trades at a market capitalisation that values it at hundreds of times trailing revenue and well above book value.
Mature satellite peers with positive EBITDA and billions of sales typically trade at low single digit revenue multiples and modest premiums to book, not at many times book and hundreds of times sales.
That does not automatically make ASTS a short, but it does tell you what the market is assuming. Investors are already paying up for the idea that this constellation will scale to billions in revenue and attractive margins over time. This is not a situation where you get the optionality for free.
Fundamental Conclusion
Fundamentally, AST SpaceMobile is still a project, not yet a fully formed business. Revenue is starting to move, but the income statement and cash flow statement are dominated by heavy R&D and capex. The balance sheet is solid for now, with over a billion in cash and net cash of roughly 480 million, but the burn rate is intense and sustained.
If the constellation works, and if mobile operators turn early pilots into real, usage-based contracts, the long term economics could be very attractive. If that ramp stalls or pricing comes in too low, the current valuation will not hold.
This is a high-beta, long duration equity. The upside is real. The margin for execution error is not.
Technical Picture: Where The Stock Actually Sits
Now to the price action. The technicals help to frame whether this story is strengthening or breaking, and where the risk is actually concentrated.
Big picture trend
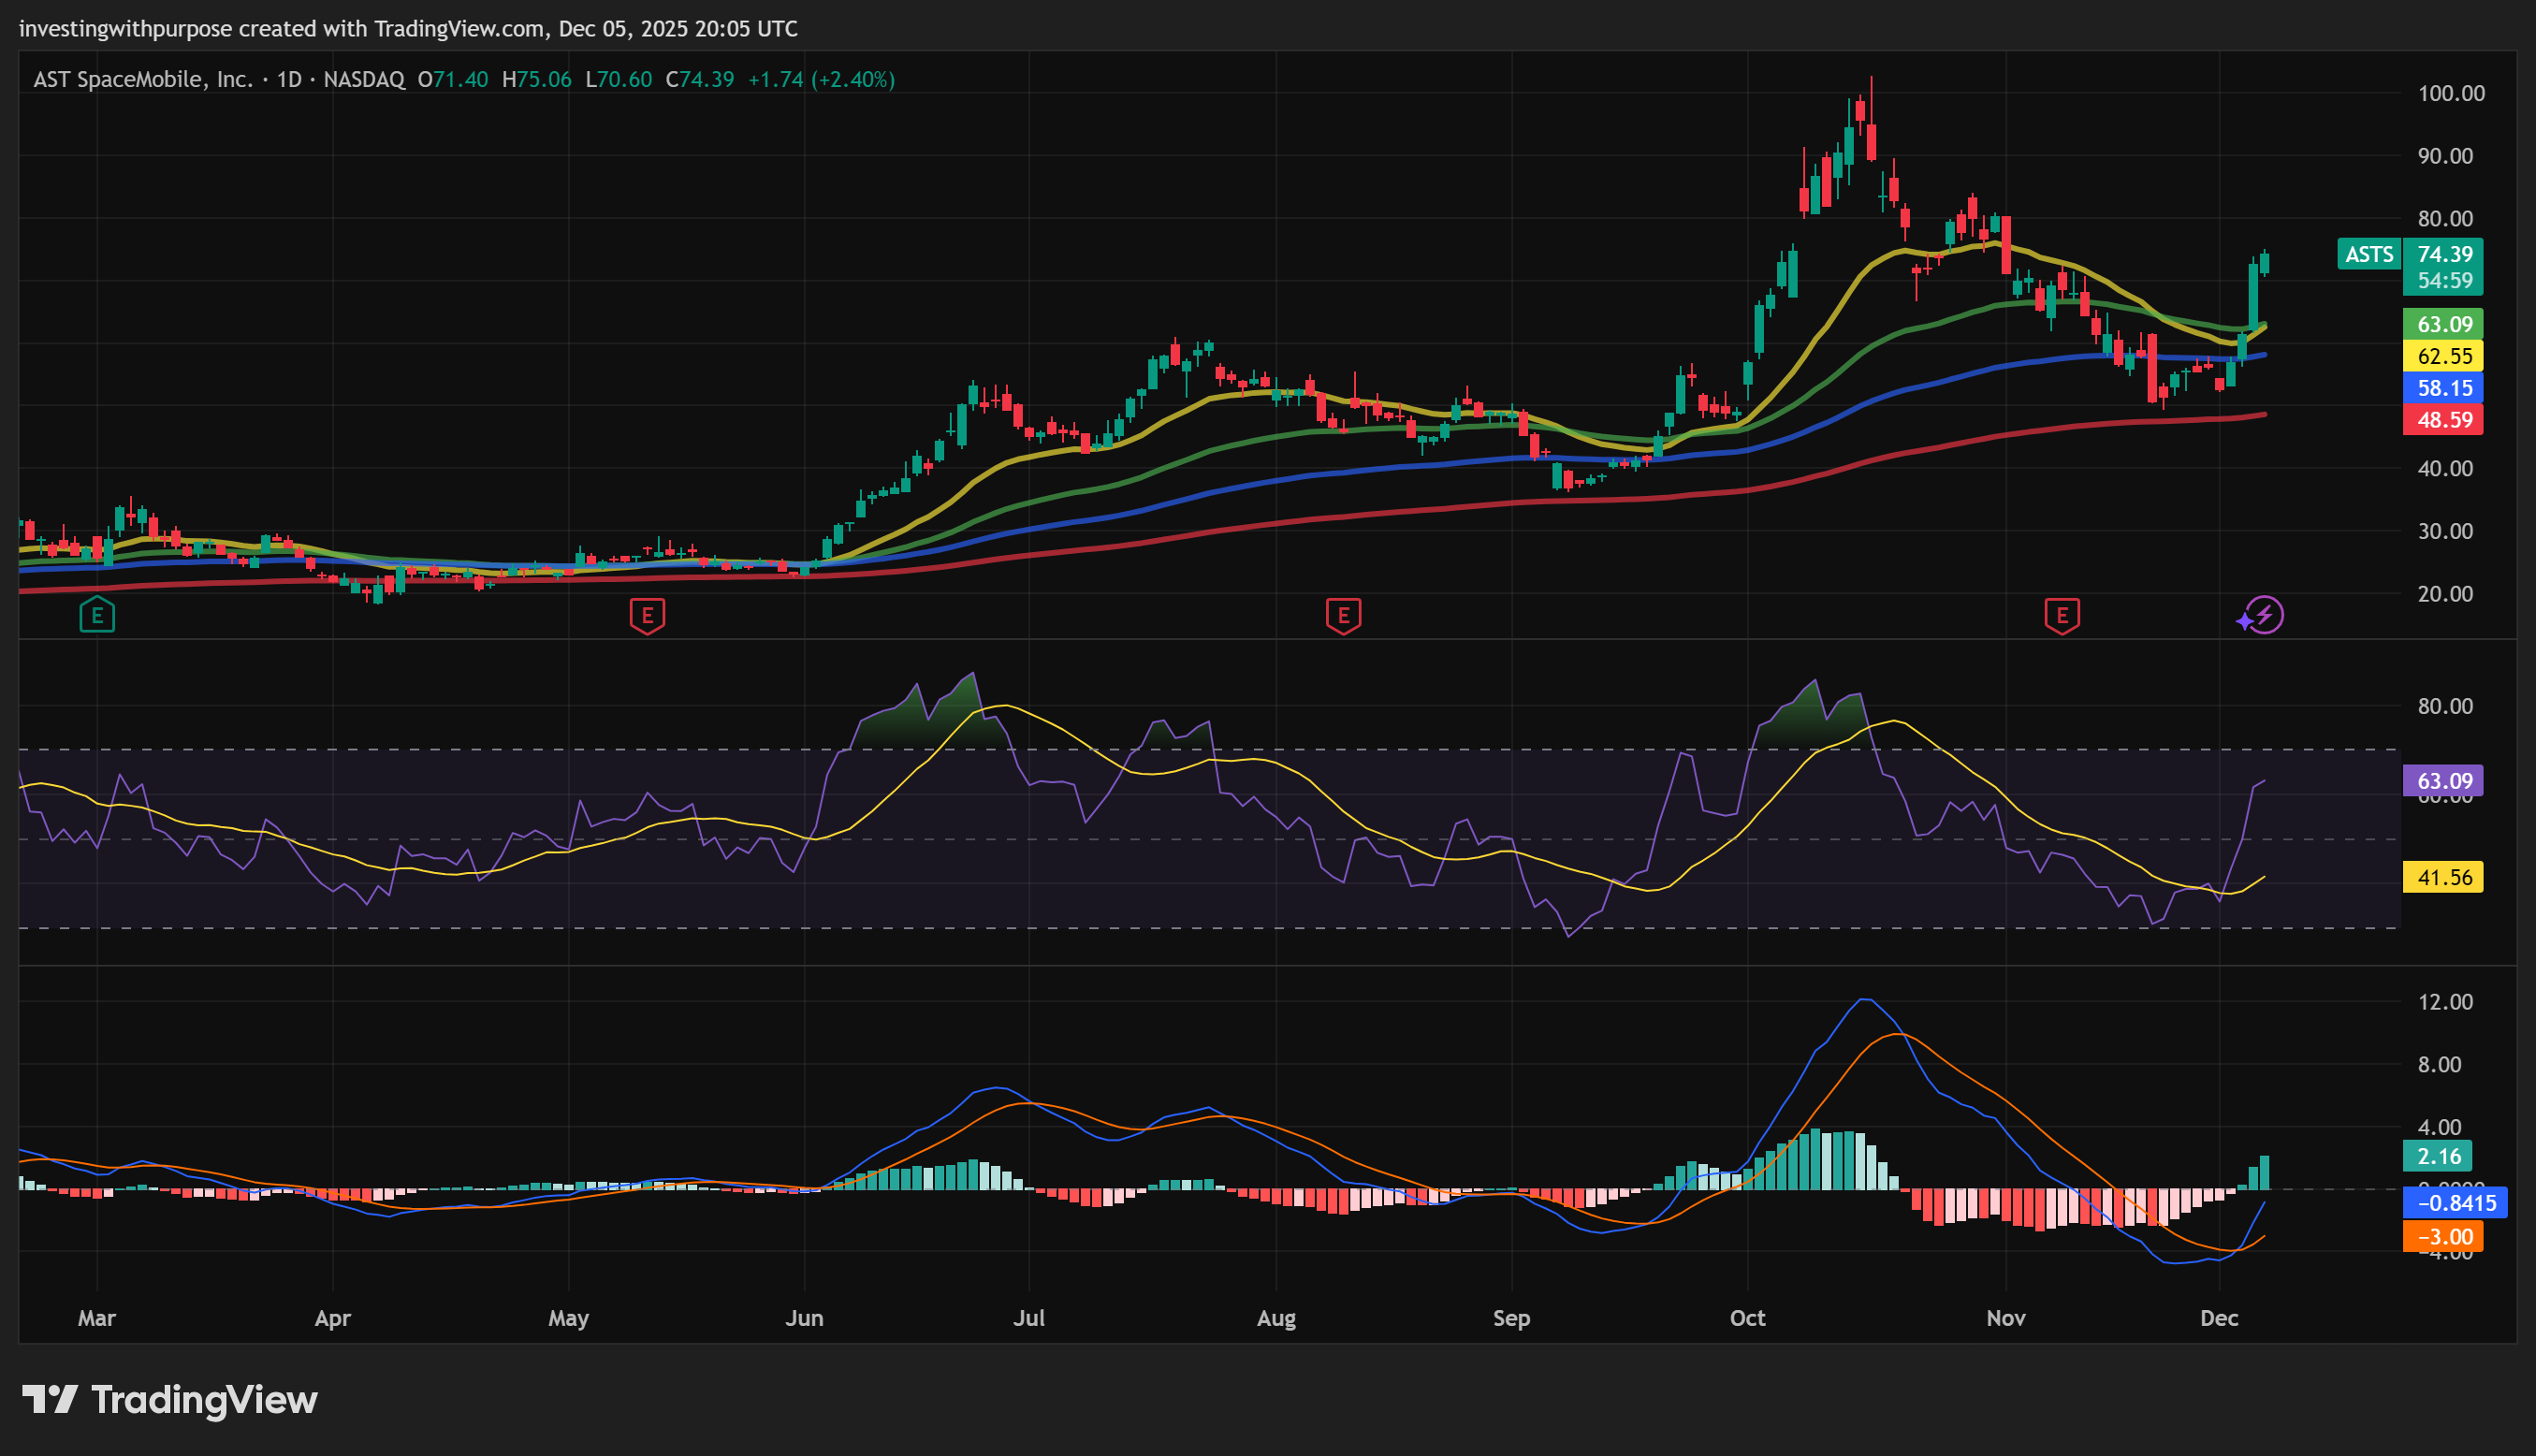
On the weekly time frame, the stock moved from the mid 20s into a peak above 100, then collapsed back to roughly 49 to 52. That drawdown was a 50%+ hit from the highs, but importantly, the longer term trend structure did not fully break.
Weekly indicators show:
Weekly RSI sitting around the 60 area, a level that fits a strong but not overheated uptrend.
Weekly ADX in the low 30s, which signals that the market is trending rather than just chopping.
Weekly average true range around 12 to 13 points, which means 10% to 15% weekly swings are normal here.
The recent low around 49 to 52 now looks like a major corrective low rather than a full trend failure. From that base, the stock has pushed back into the mid 70s. That move fits the early part of a new up leg, not the late part of an old one.
Current swing and key levels
From roughly 49 to about 75, the stock has had a very strong impulse:
Price rallied more than 50% in a short span.
On the daily chart, it reclaimed the main moving averages and is now well above the 50 and 200 day lines. Those averages cluster in the low 60s and high 40s.
The daily Ichimoku structure shows price trading above the short term lines and pressing into the top of the cloud. The cloud base and key averages cluster in the mid 60s.
That creates a clean structure:
The 62 to 66 band is the first major support zone. It contains the daily moving average bundle, the base of the daily cloud, and a cluster of Fibonacci retracements from the 49 to 75 leg.
The 56 to 57 area is a deeper layer. If price closes decisively below there, the advance from 49 starts to look like a failed rally rather than the start of something durable.
The 49 to 52 region is the structural low. Lose that and the broader uptrend is broken.
On the upside, there are equally clear bands:
Around 75 to 82 you have a band of resistance. It lines up with the top of the daily cloud and key retracement levels from the prior 100 to 50 decline.
Above that, 90 to 95 is the next logical target. It is a natural resistance area from prior price action and intermediate Fibonacci extensions.
Further out, 104 to 110 aligns with the old peak zone and a common wave extension target from the recent base.
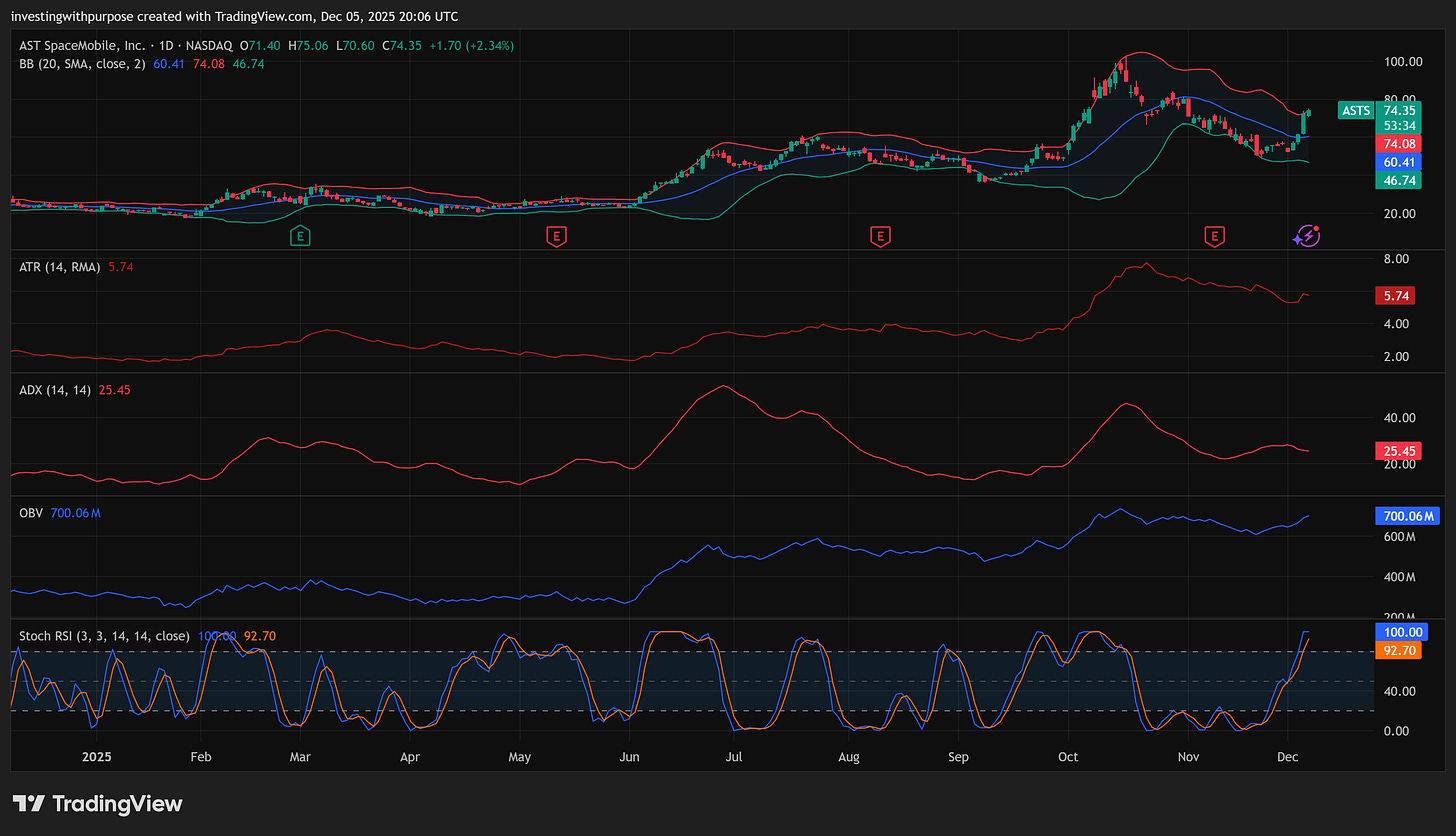
Momentum and volatility
Short term momentum is stretched. On the daily and four hour time frames:
RSI has pushed into the 60 to 70 zone.
Stochastic style oscillators are near their upper extreme.
Price has tagged or pushed slightly through the upper Bollinger band on the daily and four hour charts.
That does not mean the trend is over. It does mean the first leg of the move is likely mature. Very strong trends often pause or retrace after a push like this, then rebuild for the next leg.
From a trading perspective, that means a pullback into the 66 to 68 area, or even 62 to 64, is more probable and healthier than an immediate straight-line surge through 82.
Technical Conclusion
Technically, the stock has flipped from a broken, post-parabolic decline into an early-stage new uptrend. The higher time frames are constructive, the recent low around 49 to 52 is important and well defined, and the current 49 to 75 leg looks like the “first push” off that low.
In the short term, the stock is extended and trading into resistance between the mid 70s and low 80s. The best risk and the cleanest structure are not at today’s price. They live lower, around 66 to 68 and then 62 to 64, or higher, after a confirmed breakout above 82.
A Straightforward Trade Plan
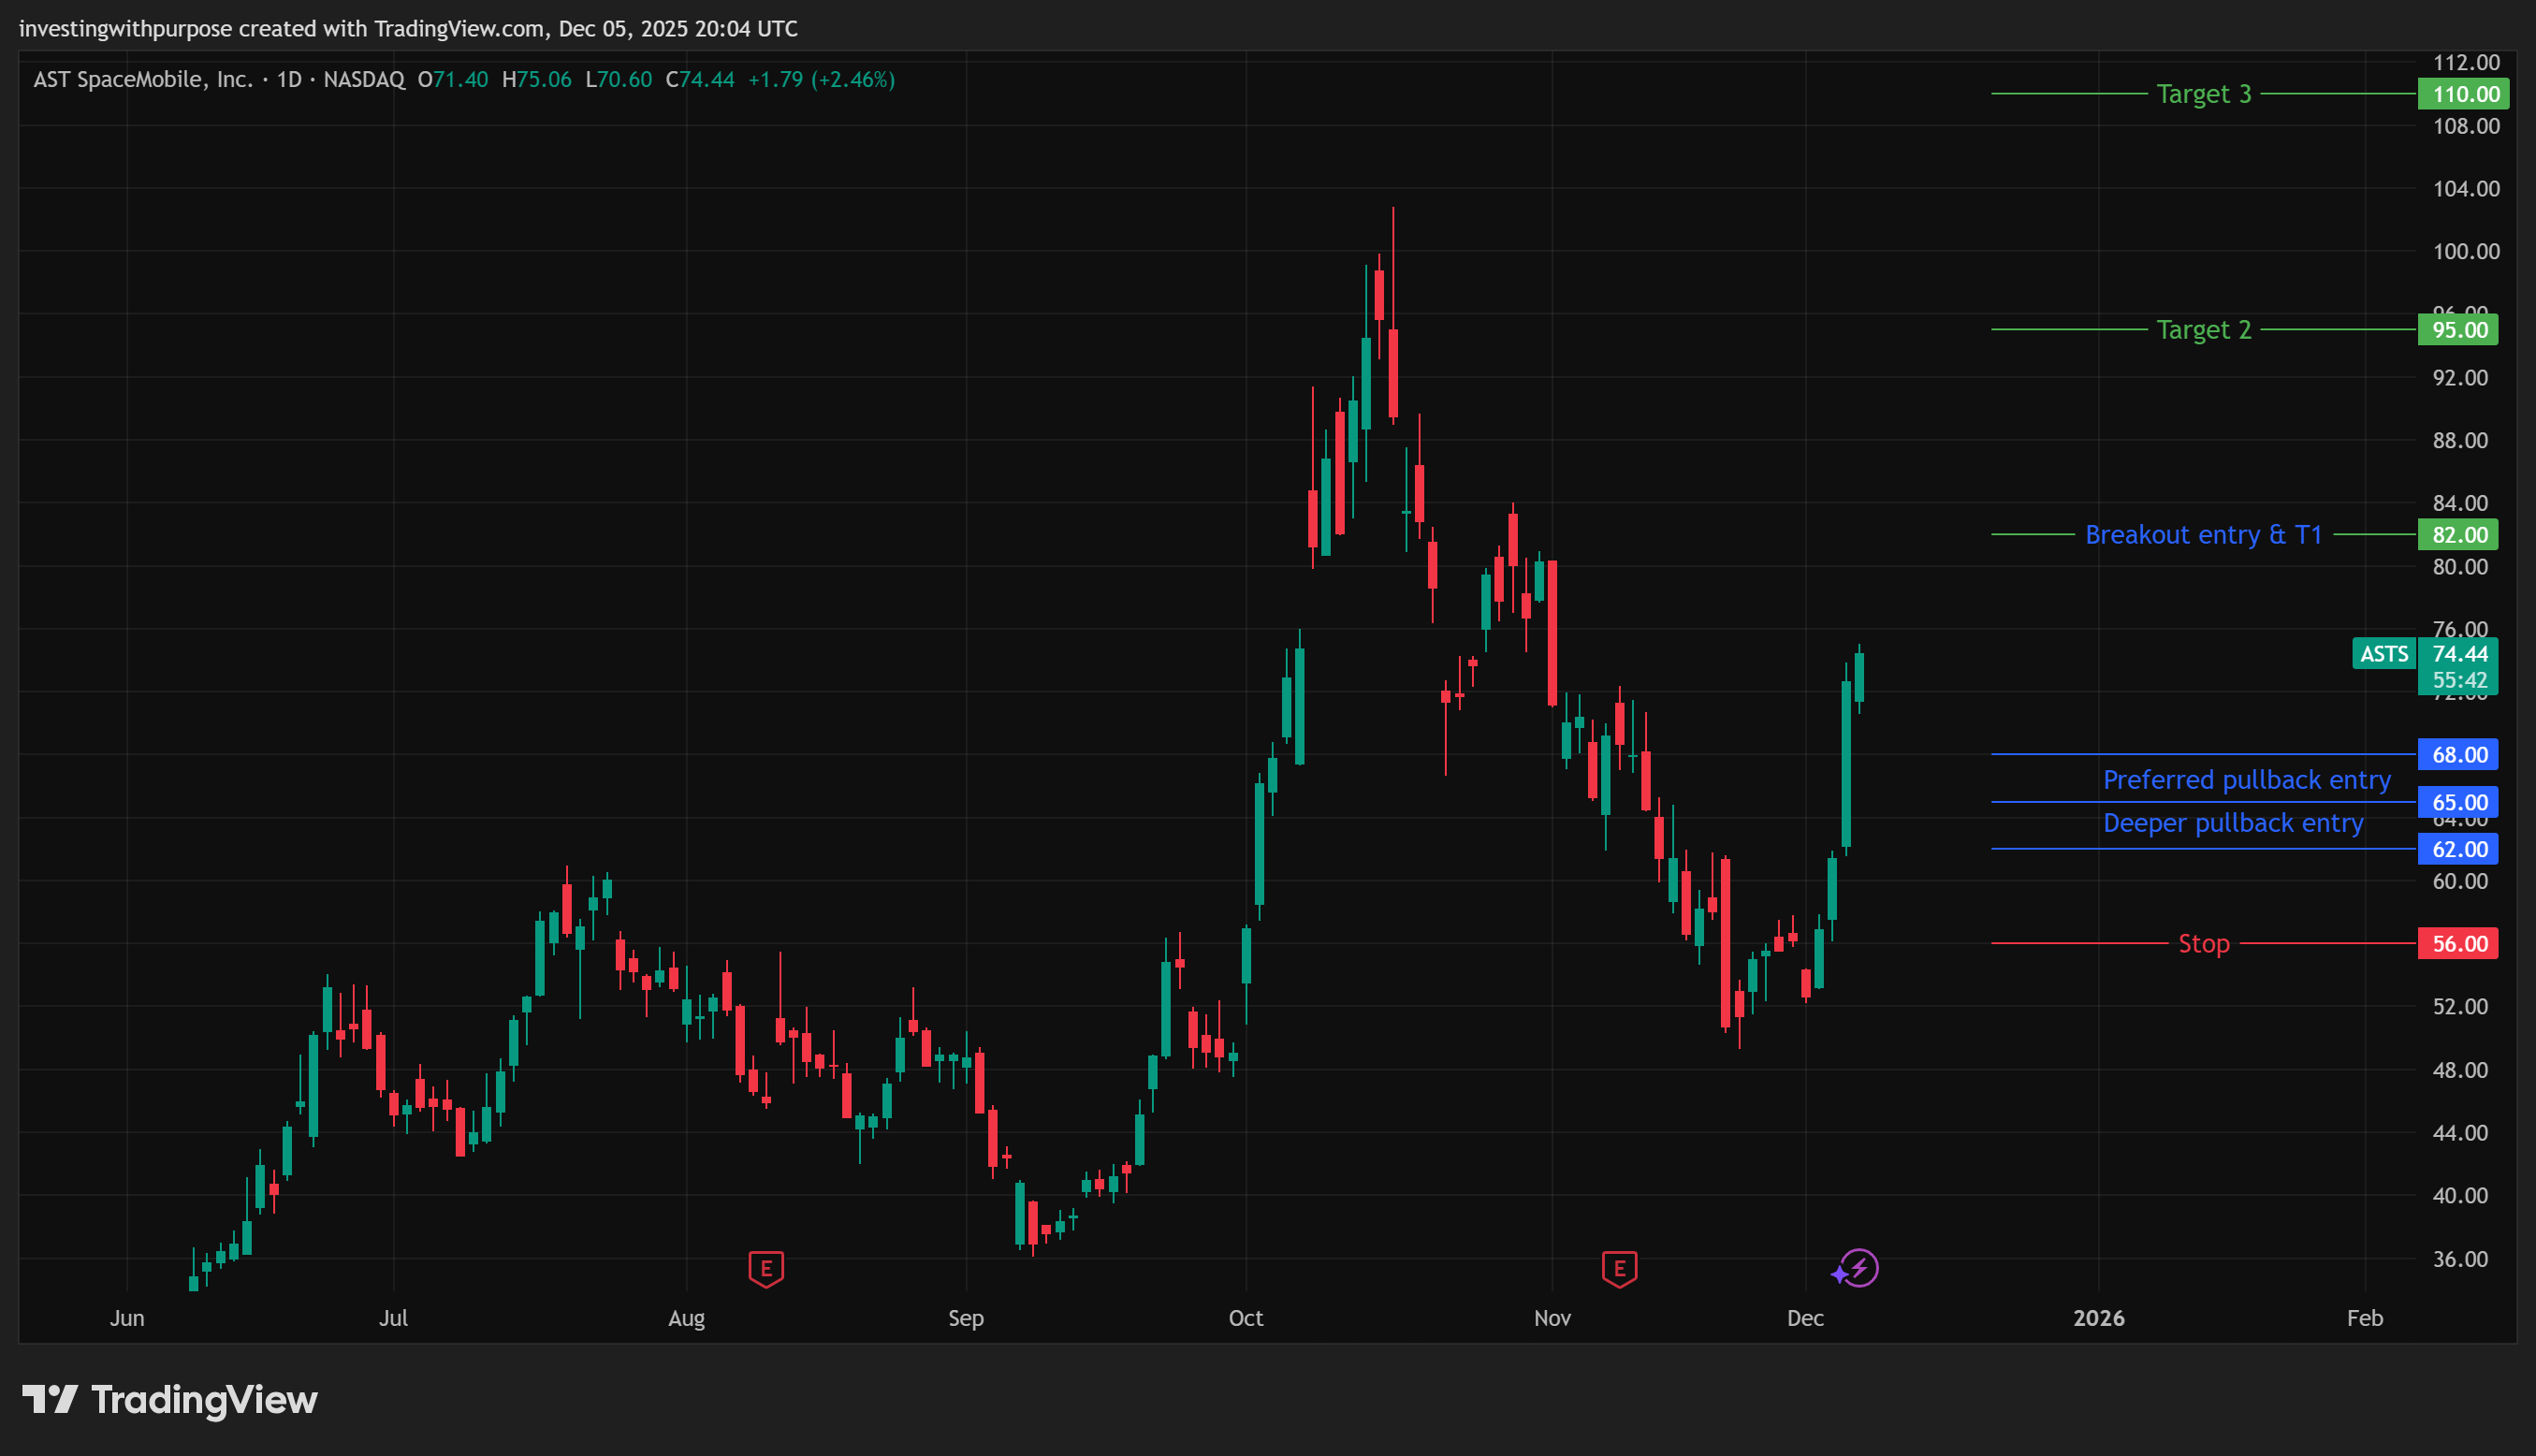
Preferred pullback entry: 66 to 68
This is the first support zone where the trend should hold if the move is genuine. It lines up with key moving averages and the base of the recent impulse.
Deeper pullback entry: 62 to 64
This is closer to a 50% to 61% retracement of the 49 to 75 move and sits right on top of the main daily support cluster. If the uptrend is real, this zone should attract buyers.
Breakout entry: daily close above 82 with follow through
This level marks a clean break through the current resistance band. A strong close and continuation above 82 signals that the market is ready to re-test the 90 to 95 area and potentially the old highs.
Stop loss: 56 to 57 on a decisive daily close
Below this level, the recent higher low structure breaks down, the 62 to 66 band has failed, and the working assumption of a stable new up leg is wrong. It is a true technical invalidation for this swing, not arbitrary padding.
Targets
First target: 82 This is the current resistance zone and the first likely place for supply to show up again.
Second target: 90 to 95 This measures the strength of the new trend and tests the next major band of historical resistance.
Third target: 104 to 110 This area captures the prior peak region and a common extension from the current base.
Rolling stop logic
Once price hits 82, raising the stop to at least breakeven makes sense for pullback entries. A higher low is usually in place by then.
If price reaches 90 to 95, lifting the stop into the mid or high 70s helps lock in a meaningful portion of gains while still allowing for a run at the old highs.
Above 104 to 110, stop placement should follow weekly higher lows. At that point the priority shifts from “prove the thesis” to “protect profits while letting the trend work.”
Position sizing should always flow from risk, not conviction alone. The distance between your entry and your stop defines the per-share risk. The total amount you are willing to lose on the trade, in dollars, then sets the maximum number of shares you can hold. Wider stops mean smaller positions. Tighter entries closer to support allow slightly larger positions for the same dollar risk.
Bottom Line
AST SpaceMobile is a rare kind of story. The vision is big, the partners are legitimate, and the company is finally printing meaningful revenue. At the same time, trailing revenue is under 20 million, trailing operating losses are over 400 million, and free cash flow burn is close to a billion a year. The balance sheet can support a few more years of this, but not indefinitely.

Technically, the stock has put in a credible low around 49 to 52 and has launched a powerful first leg higher. It is now overextended in the short term and pressing into resistance between 75 and 82.
The risk reward here is not symmetric. If the company executes, scales service revenue into the hundreds of millions and then billions, and controls capex and operating costs, today’s price may prove to be early, not expensive. If that ramp proves slower or messier than the market expects, the equity has a long way it can fall before it looks cheap on fundamentals.
For most investors, this should be treated as a small, high volatility position with a clear plan. The trade remains valid as long as price respects the 62 to 66 support band and does not close decisively below 56 to 57. Once that breaks, the technical and fundamental risk profile shifts, and the thesis for this leg up is no longer intact.
This content is for educational purposes only and isn’t investment advice or a recommendation to buy or sell any security.
How do you look at competitors like BlackSky and Planet Labs? Great insights by the way!