


ASTS won the Japan award it had been waiting for, jumped 21% on the news, then gave the entire move back. At $69 the stock is about half its May price, still trades near 315x trailing sales, and burns more than $1.3B a year building its network.

The market just repriced the story. The question is what you’re actually buying at $69.
Here’s the question on the table: ASTS fell from $133.86 to $68.82 in 7 weeks. Cheap? Cheap can’t mean multiples here. Trailing revenue is $84.9M. The market value is $26.7B. That’s 315x sales, with no earnings to anchor anything. For a venture bet, and that’s what this is, cheap can only mean one thing: the same story at a lower price with better odds. By that test, something real changed. Japan was won.
The price was cut nearly in half. And the market sold the best news of the year anyway. All prices below are based on the July 14, 2026 close of $68.82. 3 numbers carry everything: the 63.5 to 67 floor that has now been defended twice, the 58 level where the structure fails, and that 315x.
Key Takeaways
The round trip: a record $133.86 on May 28, 2026, a 49% slide, a 21% single-day jump on the Japan award on June 29, and then a full retrace. The stock now trades below its pre-announcement price.
The win was real: Japan selected the Rakuten and AST alliance for its direct-to-cell program, with reported government support of about $926M. A jointly owned venture is planned for 2026, with Rakuten leading management.
The numbers are still venture-stage: $14.7M of revenue in the March quarter, $84.9M over the trailing year, a $487M trailing net loss, and free cash flow near negative $1.37B on satellite capex.
Liquidity is real but not restful: just over $3B of cash against nearly $3B of debt, a Q1 burn around $310M, and a spending rate likelier to rise than fall as deployment accelerates.
Positioning is split and crowded: 2 buys, 7 holds, 2 strong sells, a mean target of $81.47, and 21.7% of the float sold short. The floor is 63.5 to 67, structural failure sits at 58, repair starts above 80.
What the Selloff Actually Said
Rewind 3 weeks, because the sequence is the story. In late June ASTS was sliding toward the low $60s, breaking the shelf our June note flagged as the caution line. Then Japan landed: the country picked the Rakuten and AST alliance for its direct-to-cell network over a SpaceX-linked bid, with reported subsidies near $926M and Rakuten’s CEO calling the project critical for Japan’s economic security.
The stock jumped 21% on June 29, 2026 to $86.77, its best day in nearly 2 years, and touched $89.87 the next morning. 10 sessions later the entire move was gone: $67.58 by July 13, below where the stock closed before the announcement, with a sector-wide selloff in space names hitting at the same time.
Read that plainly. The company won a government-backed contract in a G7 country, its most important external validation of the year, and the market’s lasting response was to mark the equity down. Some of that is the sector, some is likely positioning after a big 12-month run, and some is the honest arithmetic of a $26.7B valuation meeting a $926M subsidy. Meaningful proof, small money. A stock that can’t hold its best news is telling you how much expectation was already in the price.
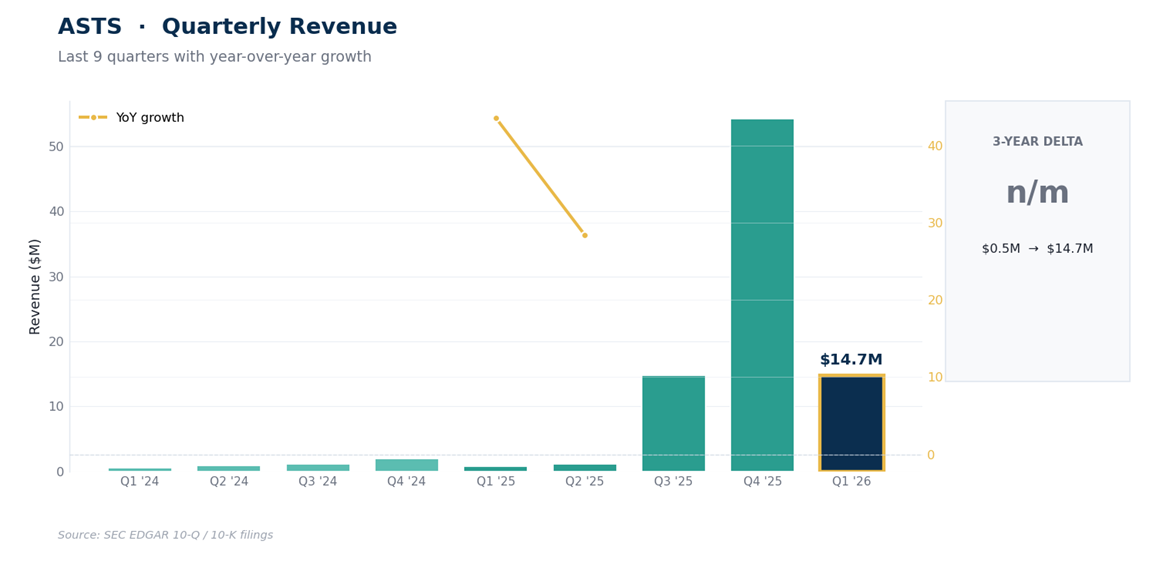
The revenue line explains why proof matters so much. ASTS booked $14.7M in the March quarter, $54.3M the quarter before, and about $71M for all of 2025, lumpy amounts driven by gateway equipment and early contracts rather than recurring service revenue, because the commercial network isn’t switched on at scale yet.
Why It Still Isn’t Cheap
Nobody buying ASTS is underwriting the trailing revenue, so run the valuation forward instead. For today’s $26.7B market value to be reasonable at 20x sales, a rich multiple even for scarce infrastructure, revenue needs to reach about $1.3B. At 15x, about $1.8B. At 10x, about $2.7B. Management’s goal for this year is $150M to $200M. The current price therefore assumes revenue scaling roughly 7x to 15x beyond this year’s goal, and it assumes the money to get there arrives on tolerable terms: the burn is above $1.3B a year, satellite programs spend unevenly, and new capital has historically come partly as equity, which shrinks what each of today’s shares can claim of that future. That’s the full test, and the stock fails the “cheap” part of it even while the opportunity remains real.
Against its own history the answer is the same. Half the May record, yes, but still up 32% over 12 months and multiples of its pre-2025 levels. Cheap versus the euphoric top is the weakest form of cheap there is.
What has genuinely improved is the story. Japan is a named, government-backed anchor for a second major market. The carrier roster, roughly 60 operators covering about 3B subscribers, includes AT&T, Verizon, Vodafone, and now a formal Rakuten venture. There’s a $175M prepayment from stc, over $1B of contracted commitments, and the next BlueBird launch is described as imminent. If you believed the story at $130, you can now buy a stronger version at half the price. That’s a real improvement in odds. It just isn’t the same thing as value.
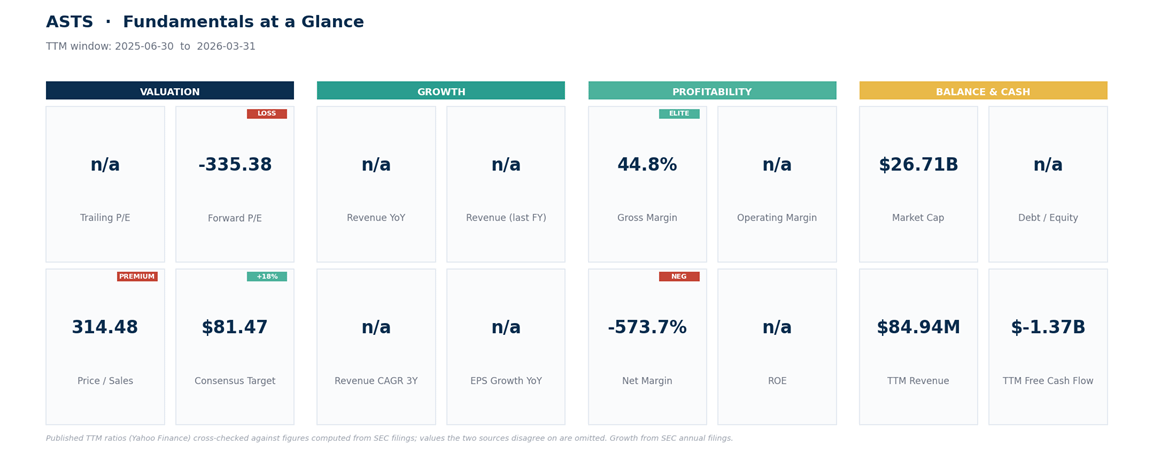
On the balance sheet, keep the framing honest: just over $3B of cash is meaningful gross liquidity, but it sits against nearly $3B of debt with its own maturities and terms, so the 2 piles don’t simply cancel. At Q1’s roughly $310M burn the cash covers a couple of years on paper; in practice the spend rises with deployment, so treat the runway as measured in quarters of proof, with refinancing and dilution risk attached. The Street reads as unconvinced (2 buys, 7 holds, 2 strong sells, mean target $81.47), and 21.7% of the float is short. Treat both as sentiment, not evidence.
The Risk Ledger
The failure modes are different bets, so name them separately. Execution: satellites must launch, unfold, pass checkout, and hand off traffic reliably, and the constellation needed for continuous US coverage is still being built. Financing: dilution or new debt is a matter of when and at what price, and a falling stock worsens the price. Competition: SpaceX’s direct-to-cell effort aims at the same dead zones with a launch cadence nobody matches. Regulation and spectrum: wholesale carrier deals depend on approvals that arrive country by country. And the meta-risk containing the others: at 315x sales, the valuation already assumes most of this goes right.
The Technical Map
· Trend: the 2-year uptrend is damaged but not dead. Price sits below the 20-week and 50-week averages, and below all its daily moving averages including the 200-day near $78.50, which it lost in late June.
· Structure: the floor is the feature. The $63.40 to $63.70 area was defended in early May and again on June 25, and the July 13 probe to $66.73 held above it. Price at $68.82 sits within one average day’s range of that zone.
· Momentum: soft but near washed-out. Daily RSI, a 0-to-100 momentum gauge, reads 40; the weekly stochastic, a faster oscillator, sits in the low teens, a level where selling pressure has historically been closer to exhausted than fresh. Volume has dried to about half its average, which reads as sellers losing urgency rather than buyers arriving.
· Resistance: 73 to 75 first (the July consolidation), then 78.5 to 80 (the lost 200-day average and the mid-June shelf), then 86 to 90 (the Japan-pop highs).
· Failure: a daily close below 63 says the twice-defended floor is breaking. A daily close below 58 undercuts the rising weekly structure entirely and opens the low $50s.
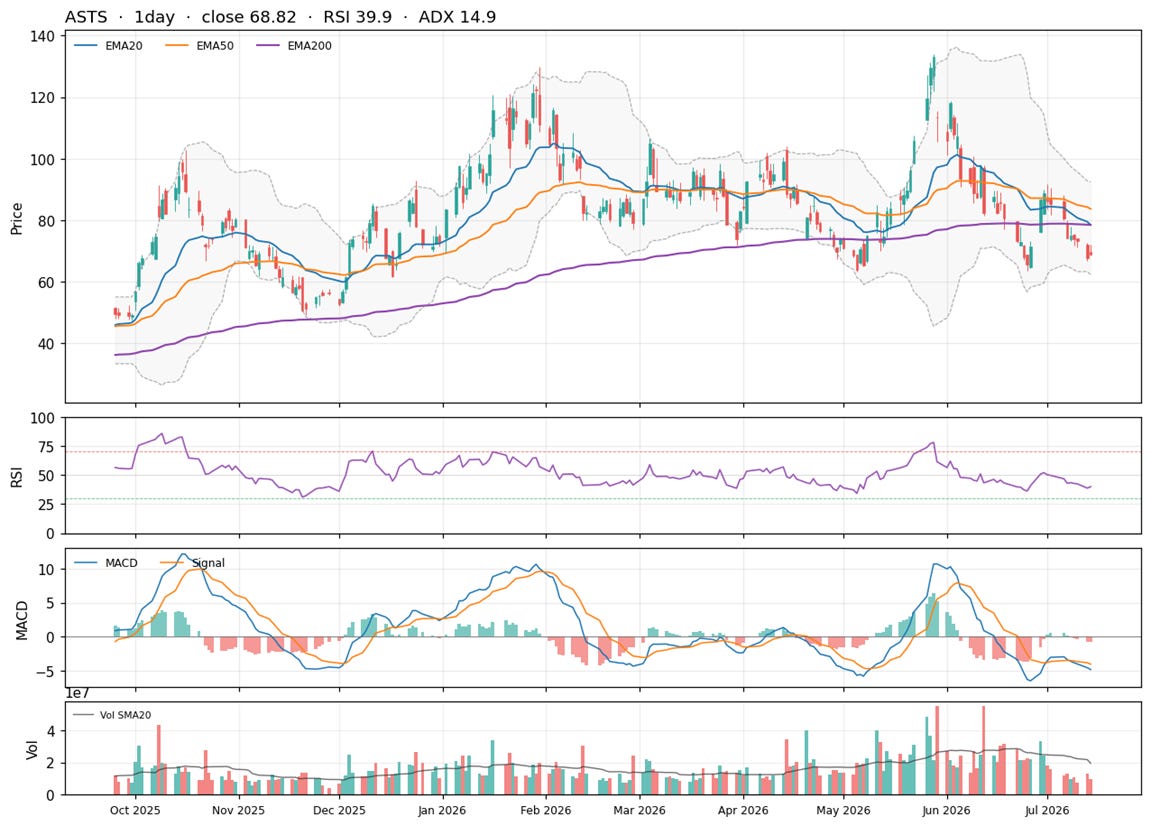
Net read: a broken parabola resting within one average day’s move of a floor that has held twice, with momentum washed out and volume fading. That’s the profile of a base that could form, not one that has formed. The stock moves about 11% on an average day; the framework below is illustrative, not a prescription.
One possible framework, not a promise.
