


On July 15 we mapped ASTS around a twice-defended floor at 63.5 to 67. On July 16 the company priced a $1B convertible note, its next big satellite block slipped to early 2027, and the stock gapped through every level on that map to close at $55.01, down 17% in a day and 26% in 5 sessions.

A follow-up on what breaks when a stock gaps, and what doesn’t.
2 days ago we published a piece on ASTS whose framework said the 63.5 to 67 floor was where believers could express the venture bet, a close below 63 meant stand back, and a close below 58 ended the setup. The stock closed July 15, 2026 at $66.31, inside the zone. The next session it opened near $59.20 and closed at $55.01.
No daily close ever printed between 63 and 58; the market jumped the exit. So this follow-up has one honest headline: the technical call failed, and the risk process is what kept that failure from becoming a portfolio-level mistake. Below: the audit, what the news actually changes, and the new map. Prices are based on the July 16, 2026 close; the stock is indicated near $53 in early premarket trading on July 17 as I write.
Key Takeaways
The news was a double: $1B of convertible notes due 2034 priced at a 1.625% coupon with conversion at $79.57, and the next block of roughly 45 BlueBird satellites slipping to early 2027 on launch-provider capacity. A smaller August launch on a SpaceX rocket stays scheduled.
The tape response: down 17% on July 16 on about 53M shares, more than twice average volume, closing at $55.01, a 2026 low, 26% below the July 9 close and 59% below the May record.
The audit, without varnish: the modeled position loss ran 15% to 17% against a planned 11% risk, so the risk budget was exceeded. Loss containment held: about 0.7% to 0.8% of portfolio at the 0.5%-budget position size.
The financing is more shareholder-aware than the headline: roughly 3% gross as-converted dilution, capped-call protection purchased to $149.20, and about $887M of usable proceeds, roughly 2 to 3 quarters of added runway depending on how one-off payments are treated.
The new map: 58 to 61, last week’s broken shelf, is now the first ceiling. Support is 52.4, the 61.8% retracement of the entire 2-year run; July 16’s low of $53.33 stopped just above it.
What Actually Happened
Take the 2 headlines separately, because they do different damage. The financing first: $1B of convertible senior notes due 2034 at a 1.625% coupon, converting at $79.57, exactly 20% above the July 15 close. The base notes represent roughly 12.6M shares as-converted, about 3% of the 388M economic share count, and that’s gross dilution before the capped calls the company bought alongside, which extend protection to $149.20; actual dilution depends on price, timing, and settlement method. After fees and the $96.9M capped-call cost, usable proceeds run about $887M. Our piece 2 days earlier wrote that “dilution or new debt is a matter of when and at what price, and a falling stock worsens the price,” and as these things go, the price was decent: cheap coupon, high conversion, hedged tail.
The delay is the headline that changes the model. The block of roughly 45 BlueBirds, the tranche that matters for continuous US coverage, is now targeted for early 2027 rather than late 2026, with the company citing launch-provider capacity, reportedly Blue Origin’s New Glenn. For a network that hasn’t yet reached commercial scale, time is the denominator under everything: another quarter or 2 of burn before the coverage milestone, the same delay before contracted commitments can start converting to revenue. Announced alongside the revised schedule, the financing was inevitably read as bridge capital to a later commercial milestone. The raise wasn’t the wound. The delay was.
Sector context belongs in the picture: the group’s biggest names are heading for 30%-plus July losses, and the week’s selloff hit all of them. That cushions the interpretation. It doesn’t change the levels.
The Audit
The July 15 framework deserves an unflattering review, because readers may have acted on it. The price location was wrong. We called 63.5 to 67 a floor worth a venture-sized entry, and it failed by gap, the worst way, with no exit available between the warning and the invalidation. The risk architecture was not wrong, and the distinction matters.
Model the damage without choosing convenient assumptions: an entry at the $65 zone midpoint exiting at the $55.01 confirming close lost about 15.4% of the position; an entry at the July 15 close of $66.31 lost about 17%. Both exceed the planned 11% risk, which means the risk budget itself was breached. What held was containment: at the 4.5%-of-portfolio position the framework specified for a 0.5% budget, those modeled losses cost roughly 0.7% to 0.8% of a portfolio. Painful, survivable, and the only part of the plan that could function when the market jumped the exit.
The transferable lesson is worth stating once, plainly: closing-price frameworks manage trends, not gaps. Levels can be jumped; only position size caps the damage when they are.
Running the Numbers Again
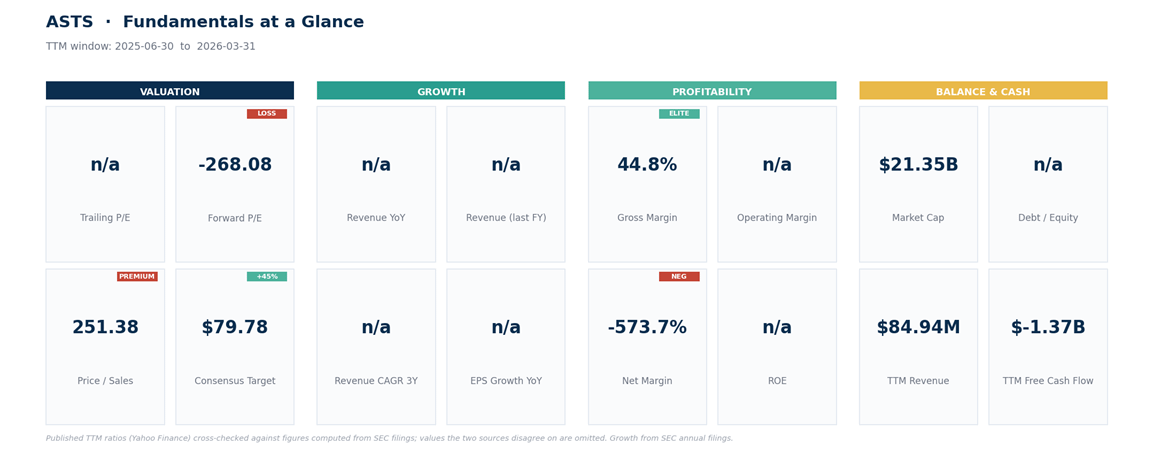
The valuation question from the last piece, is it cheap yet, has a new input and the same shape. At $55.01 the market value is about $21.4B against $84.9M of trailing revenue: 251x sales, down from 315x on July 14. The forward test moves the same way: $21.4B needs about $1.1B of revenue at 20x sales, $2.1B at 10x, against a $150M to $200M goal for this year whose edges just got softer.
On liquidity, definitions matter: the company held about $3.5B of cash, equivalents, and restricted cash at March 31, Q1 operating cash use was $48.1M, and investing outflows were $379.3M including satellite capex, a Ligado advance, and spectrum payments. Add the $887M of usable proceeds and the runway extends 2 to 3 quarters, depending on which of those items you treat as recurring. Short interest remains 21.7% of the float, fuel in both directions and a thesis in neither.
The New Map
Structure: the July 16 candle erased the summer structure. The twice-defended 63.4 floor, the 58 shelf, and the weekly trend anchor near 58 all sit above the price now. Broken floors tend to act as ceilings until proven otherwise.
Support: the level that matters is 52.4, the 61.8% retracement of the entire run from $1.97 to $133.86. July 16’s low of $53.33 stopped just above it, and the early July 17 premarket is trading within a point of it. Below, the next references are the low 40s (the 2-year average zone and the Street-low target) and the 52-week low at $36.08.
Resistance: 58 to 61 first (the broken shelf and the gap’s lower lip), then 63.5 to 67 (the failed floor and the July 15 close, a full gap fill), then the mid-70s.
Momentum: daily RSI, a 0-to-100 momentum gauge, is 32, low but not at capitulation extremes; selling-pressure readings are the most lopsided of the year. The heavy volume on the break reads as forced selling, but one candle doesn’t prove exhaustion.
Volatility: the average daily range is now about 14% of the price. Nothing about this tape is calm, in either direction.
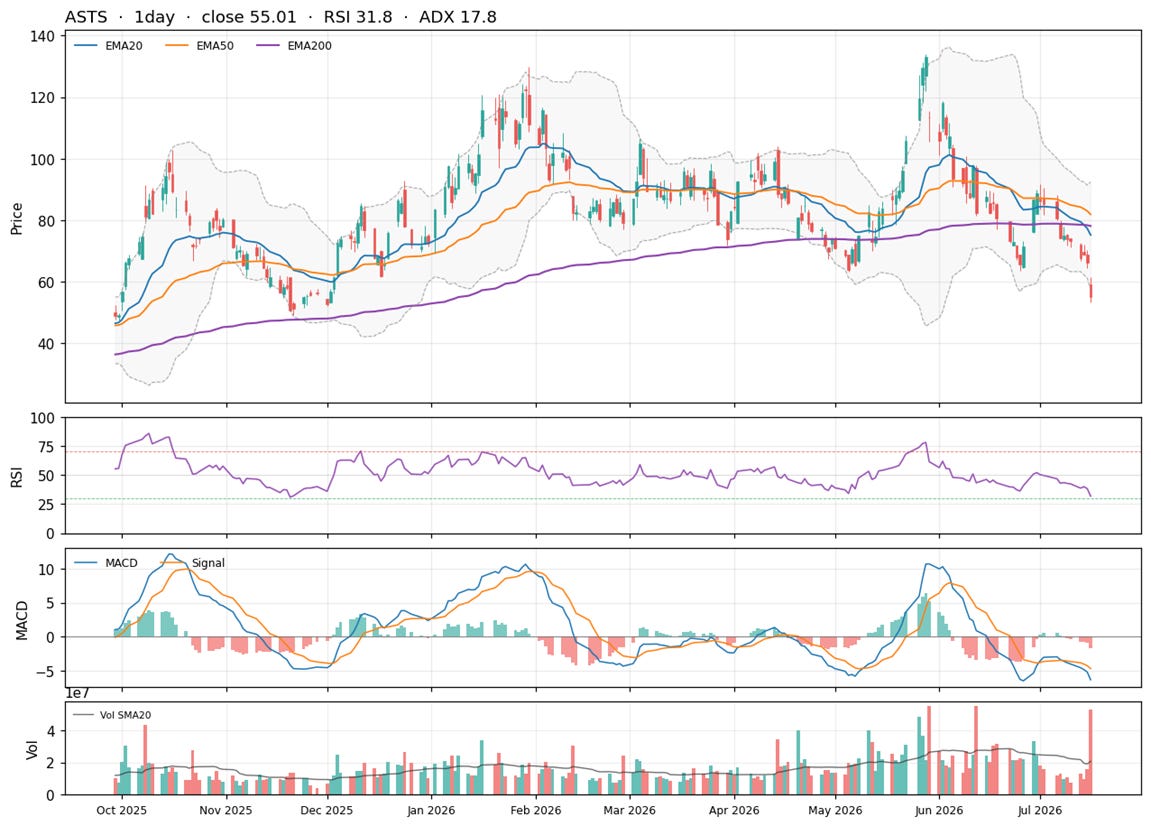
Net read: a broken structure probing the last major retracement of the whole advance, with sentiment washing out but not yet washed. After a failure this clean, the burden of proof sits with the buyers.
One possible framework, not a promise.
Levels I’m Watching
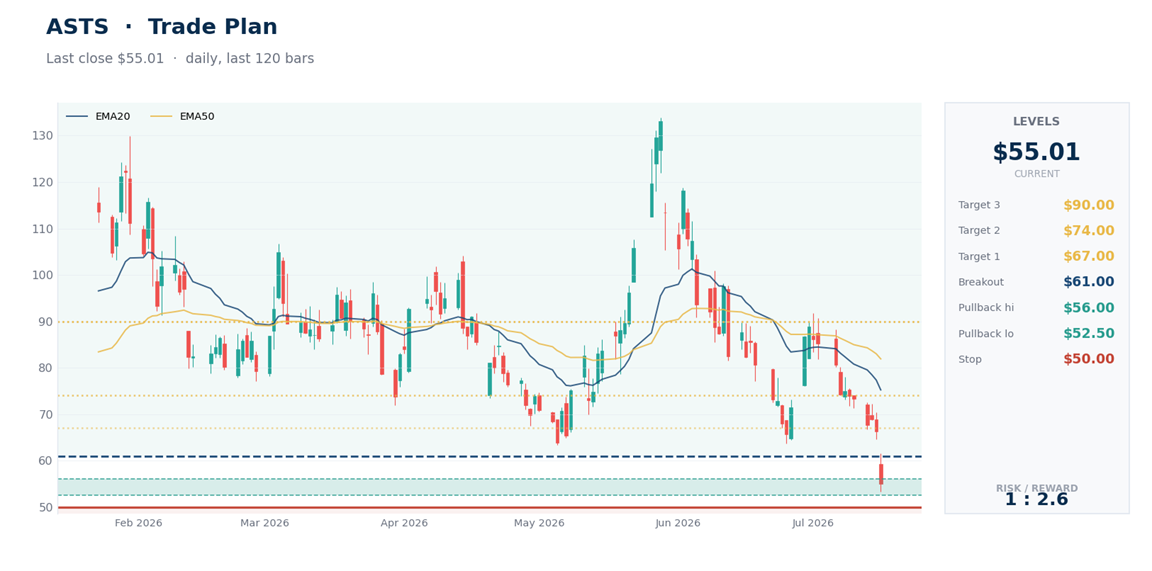
The standing rule: after a gap through invalidation, the framework starts from flat. Nothing here is a buy zone the way last week’s was; these are conditions under which a position becomes arguable again.
Stabilization watch (illustrative): 52.5 to 56, the 61.8% retracement plus the 2026 low. The condition isn’t touching it, it’s holding it: at least a daily close back above 56 after a test, ideally on fading volume.
Repair trigger: a daily close above 61 reclaims the broken shelf and the gap’s lower half; 67, the full gap fill, is the confirmation above it.
Failure: a daily close below 50 abandons the retracement and the round number together, and the references below sit 20% to 30% lower. From flat, there’s nothing to defend.
Recovery references, in order, if repair comes: 67, 74 (the early-July shelf), then 90.
Catalysts: earnings on Monday, August 10, 2026 (burn, the revenue goal, launch-manifest detail), the August SpaceX launch, and any early signal on how the note proceeds are deployed.
On sizing, the same illustrative math with this week’s lesson priced in: from a $54 reference against the $50 failure level, planned risk is about 7.4%, and a 0.5% portfolio budget caps the position near 7%. But assume the modeled loss can run 1.5 to 2 times plan in a gap, and size to survive that version.
Bottom Line
Nothing this week invalidated the technology, the partnerships, or the long-term market. It did invalidate part of the deployment schedule and weaken the per-share economics, and for a company priced on belief, later plus smaller is a valuation cut. The market administered it in one candle. Cheaper, for the 3rd time this summer: 251x sales instead of 315x. Cheap, still no.
The burden of proof has moved to the buyers: until 61 is reclaimed or 52 to 56 proves it can hold, the tape’s message is that sellers still have the floor. The one unarguable win from the last 5 sessions belongs to position sizing. Keep it that way into August 10.
This is research and commentary, not personal investment advice. Levels are illustrative; size positions to your own risk tolerance and time horizon. The author may hold positions in names discussed.