
ASTS Update: Our December Call Delivered 70%, Here’s What Comes Next
ASTS Ran Exactly as Planned. Here’s How We’re Managing the Next Phase.

In early December 2025, we published our first deep dive on AST SpaceMobile. At the time, the story was exciting, the financials were rough, and the stock had just started to wake up. That was the point.
Back then, ASTS 0.00%↑ was trading in the mid to high 60s. We were very clear on two things.
First, this was not a cheap business. Trailing revenue was still under 20M, cash burn was heavy, and execution risk was real.
Second, the chart had finally flipped into a bullish structure, and that gave us something far more important than opinions: a plan.
We laid out three clear paths:
Accumulate on pullbacks into 66 to 68, with deeper support near 62 to 64
Add on strength only after a daily close above 82
Take profits into 90 to 95, then 104 to 110

Since that post, price has done the rest.
The stock never lost structural support. It broke 82, confirmed the breakout, and accelerated through every target we outlined. As of the latest close, $ASTS is trading around 115 to 116, with an intraday high near 121.
Here is what that means in simple terms:
From the pullback zone near 67 to 115, the move is about +70%
From the breakout level near 82 to 115, the move is about +40%
Both target zones, 95 and 110, were hit cleanly along the way
That is not about being “right.” It is about structure. Support held. Breakout confirmed. Extensions followed. The market respected the same levels we mapped when sentiment was still mixed and conviction was uncomfortable.
This update is not a victory lap. It is a reality check. The stock has moved a lot, expectations are higher, and risk now looks very different than it did in December.
Key takeaways
Our December ASTS thesis played out almost level by level. Support held, the breakout above 82 confirmed, and price ran through 95, 110, and into the 115 to 120 zone.
Depending on entry, the move delivered roughly 40 to 70 percent, validating the structure and trade plan rather than a one-off call.
The business has progressed on execution, not on earnings. Hardware risk is lower, partnerships are firmer, but revenue is still ahead of us, not here yet.
The trend remains bullish as long as price holds above 102. That level defines whether this is a healthy pullback or a change in character.
Price is stretched after a sharp run. Upside from here is possible, but no longer easy or low risk.
For new exposure, discipline matters. Better risk comes from pullbacks into 108 to 110 or 100 to 102, or from a confirmed breakout with a daily close above 121.
If momentum continues, upside targets sit at 130, 141, and 157, with normal volatility along the way.
ASTS is now a manage-the-trend trade, not a chase-the-breakout trade.
This is why planning ahead, defining risk, and updating after big moves matters more than reacting to headlines.
Business updates and what they actually mean
Let’s separate noise from signal.
Since our December post, AST SpaceMobile has not reported earnings and has not changed the near-term financial picture. Revenue is still minimal, cash burn is still heavy, and this is not a fundamentals-first stock yet.
What has changed is the quality of execution signals. And for a company like this, that matters more than a quarterly income statement.

The story moved from promise to proof of progress
The single most important development is that AST has now put a next-gen Block 2 satellite into orbit. This is not a test toy. This is a full-scale production design, materially larger and more powerful than the early demo satellites.
Why this matters:
It reduces the biggest risk in the story: “Can they actually build and deploy this at scale?”
Hardware risk is now lower than it was in December. Not gone, but lower.
The market is not paying up because revenue showed up. It is paying up because the company crossed a technical credibility checkpoint.
Launch cadence is now a real conversation, not a slide deck
Back in December, launches were an idea with timelines attached. Now we have something closer to a plan.
The company is guiding toward:
Around 5 launches by early 2026
A broader target of 45 to 60 satellites by the end of 2026
Multiple launch partners, not just one
This matters because constellation businesses fail more often from schedule slippage than from bad demand. Using more than one launch provider lowers single-point failure risk, even if it adds complexity.
The takeaway is simple: this is starting to look like an industrial rollout, not a science project.

Carrier partnerships are no longer theoretical
The Verizon partnership has become central to the U.S. narrative. This is not a pilot or a loose handshake. It is framed as a commercial service path starting in 2026, using carrier spectrum and existing phones.
Outside the U.S., Vodafone is pushing a Europe-focused approach that leans into:
National coverage
Public safety use cases
Sovereign control concepts
This tells us two things:
Carriers are thinking beyond novelty use cases
AST is being pulled into more regulated, more strategic conversations
That is good for long-term demand, but it also slows things down. Big partners move carefully.
Defense and government interest adds option value, not revenue yet
AST was selected as a prime awardee under a U.S. defense framework program. This does not mean money is flowing tomorrow. It means AST is eligible to compete for future task orders.
The right way to think about this:
This is validation, not backlog
It creates upside paths that were not priced in before
It should not be modeled as near-term cash flow
It raises the ceiling. It does not raise next quarter’s numbers.
The pipeline sounds large, but the wording matters
Management continues to reference agreements and commitments with dozens of mobile operators and long-term commercial potential measured in the billions.
That sounds impressive, and it probably reflects real interest.
But commitments are conditional. They depend on:
Coverage quality
Reliability
Regulatory approval
Rollout timing
Until usage turns into invoices, this remains future revenue, not current revenue.
What has not changed, and still matters
Some things are unchanged and should not be ignored:
Cash burn is still high
Dilution risk still exists
Any major launch or deployment issue would hit confidence hard
This is still a stock driven by milestones, not margins.
Bottom line on the business
Compared to December, ASTS is:
Less speculative on the hardware side
More credible on execution
Still early on monetization
The market is re-rating the stock because the probability of success moved, not because success has already arrived.
That distinction matters a lot from here.
The Technical Picture, updated
The chart did exactly what we expected it to do.
Back in December, ASTS was building above the mid-60s and flirting with a breakout. Our key level was 82. Above that, the chart opened up fast.
That is exactly what happened.
Price held support, broke 82, and accelerated through every target zone we outlined. Since then, ASTS has traded through 95, through 110, and recently printed a daily close around 116, with an intraday high near 121.
From a technical standpoint, three things matter now.
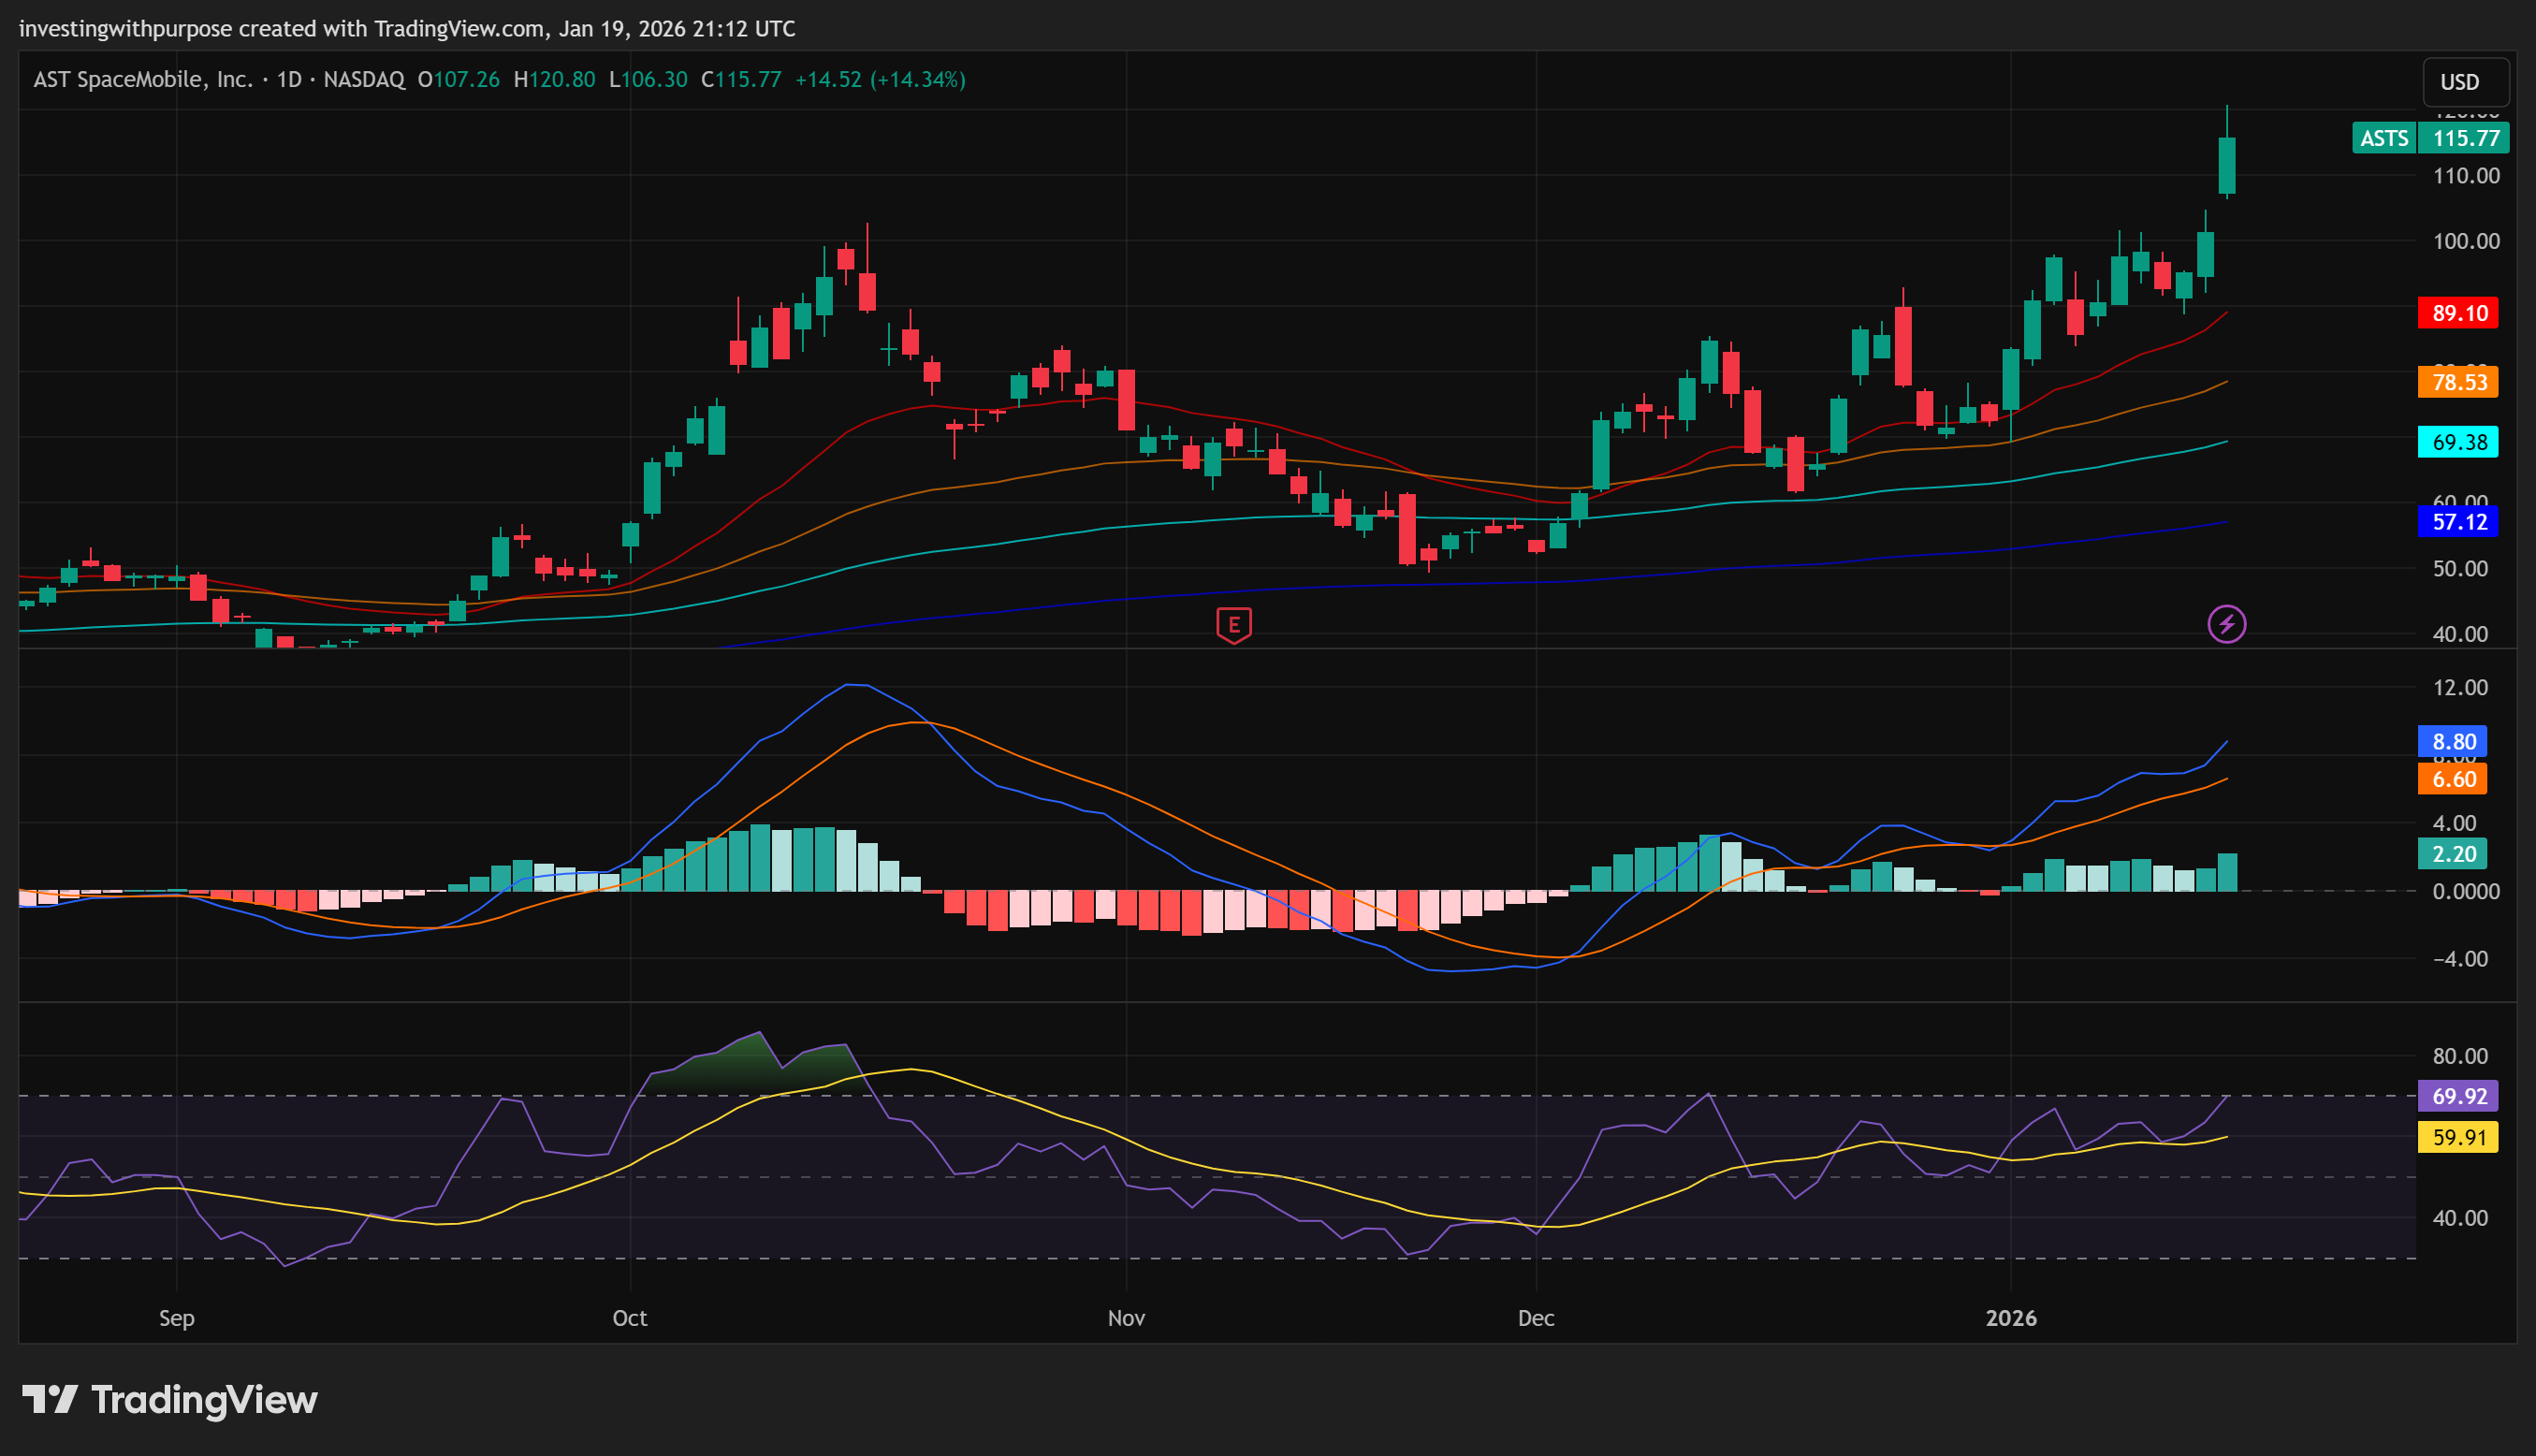
First, the trend is strong. Weekly and daily trend strength remain elevated, and momentum is still positive across timeframes. This is not a fragile move. Pullbacks, when they come, are more likely to be pauses than trend breaks.
Second, price is stretched short term. ASTS is currently trading above its daily and weekly volatility bands and has tagged major measured move targets around 116 to 120. That does not mean the move is over. It does mean upside from here is no longer easy or low-risk.
Third, the risk map has shifted higher. What used to be resistance is now support. The most important levels to watch are:
114 to 115 as near-term support
108 to 110 as the first meaningful pullback zone
100 to 102 as the prior breakout shelf and a higher-quality reset area
As long as ASTS holds above the low 100s, the bigger uptrend remains intact. A loss of that zone would not kill the story, but it would tell us the stock needs time to cool off and rebuild.
The key takeaway is simple: This is no longer a “catch the breakout” chart. It is a manage the trend chart.
Our Updated Trade Plan
This is a high-vol stock. The plan is built to keep you in the trend, without donating your gains back to Mr. Market.
Current reference points from the chart: Price recently closed 115.77 with an intraday high 120.80.
Key zones:
Near support 114 to 115
First pullback zone 108 to 110
Higher-quality reset 100 to 102
Breakout trigger daily close above 121
Next targets 130, 141, 157
Plan for existing holders
You are no longer trying to “buy cheap.” You are trying to stay with the trend and avoid a big giveback.
Hold, trim, or add rules
Rule 1: If price is above 102, the trend is still your friend.
102 is the line that keeps the structure clean. Lose it and fail to reclaim it, and the trade changes character.
Rule 2: Use trims at targets, not emotions.
A simple framework:
Trim some into 121 if it rejects again
Trim more into 130
Trim again into 141
Keep a runner for 157
This way you lock gains while still giving the trade room to surprise you.
Rule 3: Only add if one of these happens
Pullback holds a key zone (108 to 110 or 100 to 102)
Breakout confirms with a daily close above 121 and then holds 120
Stops and invalidation for holders [choose your style]
Conservative holder (protect profits): Stop on a daily close below 108:
Why: that is usually the first real sign the move is cooling off, not just a normal dip.
Balanced holder (give it room) Stop on a daily close below 102:
Why: that level is your structure line. Below it, upside becomes less clean.
Aggressive holder (trend rider): No hard stop, but you must trim into targets and accept you can sit through big swings. Only for people who truly can handle it.
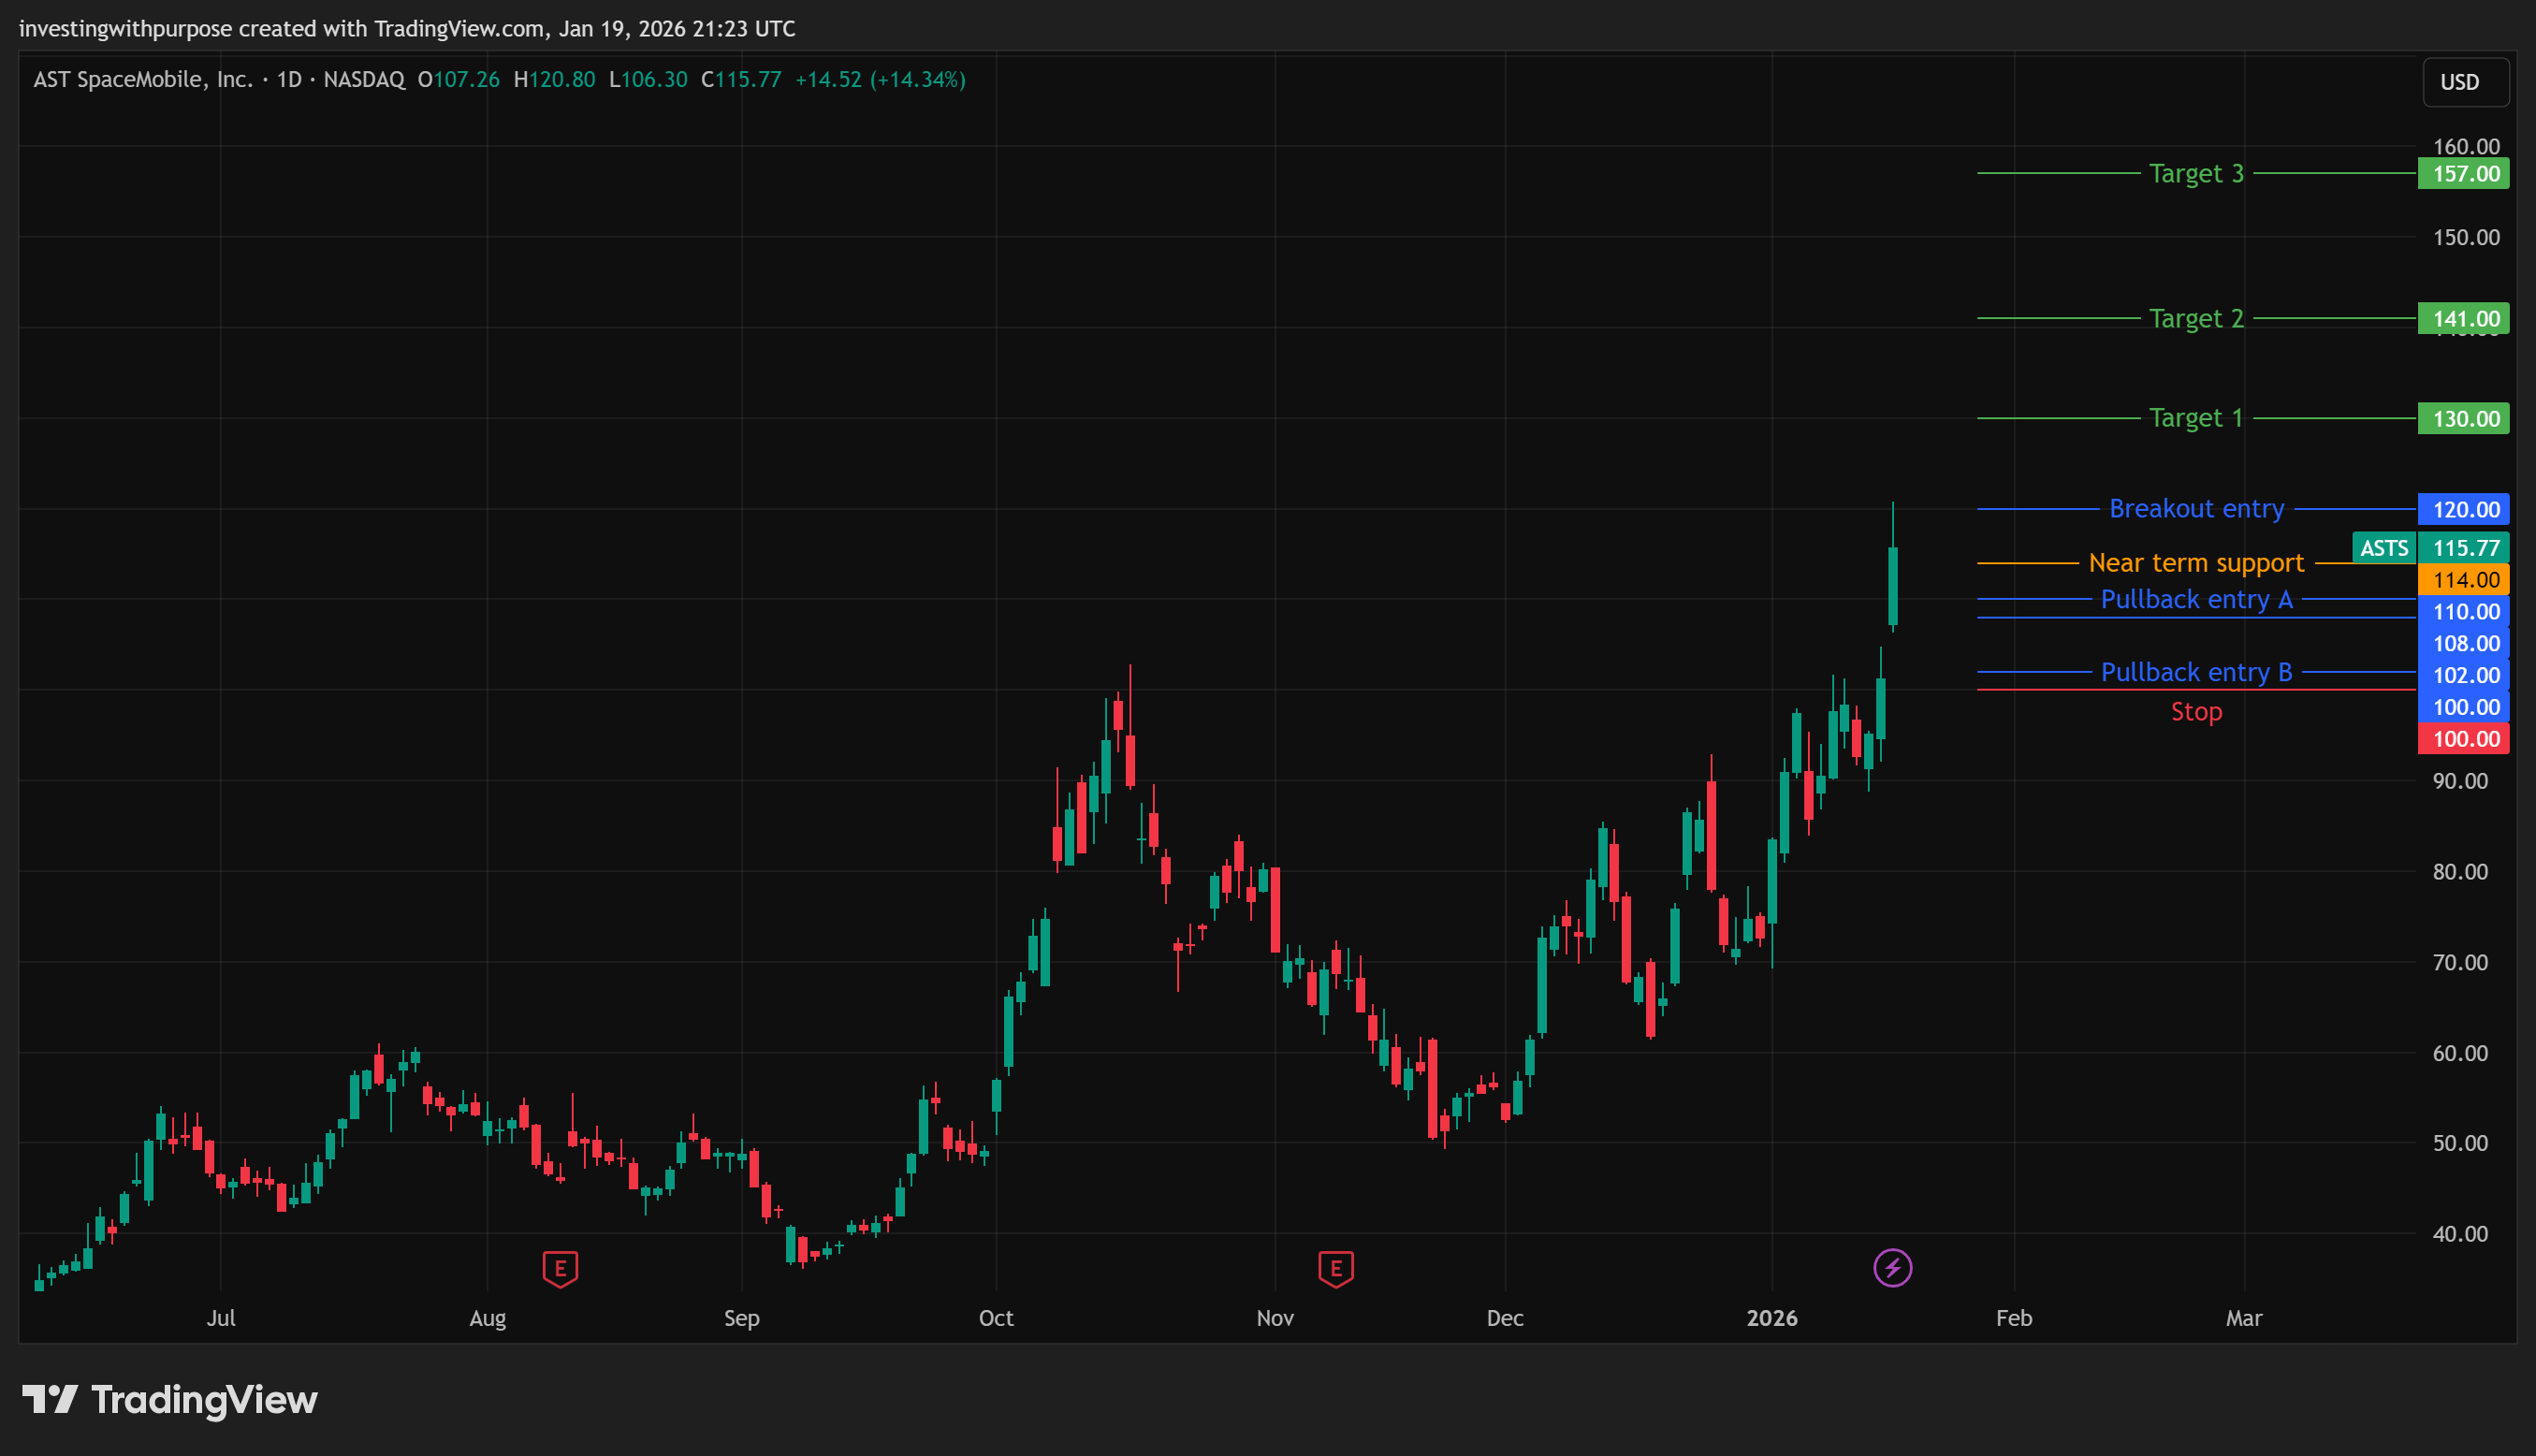
Plan for non-holders [two clean ways in]
You have two options. Do not mix them.
Option A: Buy pullbacks (best risk control)
Entry 1: First pullback zone: Buy zone: 108 to 110
This is where strong trends often reset after a hot move.Stop: daily close below 102
Targets: 121, 130, 141, 157
Good because: you are buying fear, not fireworks.
Bad because: it might not pull back that far.
Entry 2: Higher-quality reset: Buy zone: 100 to 102
This is the “if I miss the first dip, I want the good dip” zone.Stop: daily close below 96 This gives room for normal noise and avoids getting clipped by one ugly candle.
Targets: 114 to 115 first, then 121, 130, 141, 157
Good because: best risk to reward.
Bad because: you may never get it if the stock stays hot.
Option B: Buy the breakout (momentum plan)
Breakout trigger Daily close above 121: Then ideally a retest that holds 120.
Entry Buy the breakout close above 121, or buy the first retest that holds 120.
Stop on a daily close back below 114 f it breaks out and then loses 114, that is usually a failed breakout.
Target 1: 130 | Target 2: 141 | Target 3: 157
Good because: you only buy when price proves it wants higher.
Bad because: breakouts can fake out. That is why the stop exists.
General Profit-taking blueprint
A clean, repeatable approach:
Take partial profits at 121
Take more at 130
Take more at 141
Leave a runner for 157
If you are right, you still participate.
If you are wrong, you still get paid.
If a 10% swing would mess with your sleep, your size is too big. ASTS moves fast. The plan only works if you can follow it calmly.
Bottom line
ASTS is no longer an idea. It is a trend.
Our December thesis played out almost level by level. Support held, the breakout above 82 confirmed, and price pushed through 95, 110, and into the 115 to 120 zone. Depending on how it was played, the move delivered roughly 40 to 70 percent. That did not happen by accident. It happened because the plan respected structure and risk.
Today, the business is still early and the financials are still messy. But execution risk has gone down, partnerships have firmed up, and the market is now pricing a higher probability of success.
From here, the chart is telling us two things at once:
the trend is strong and still intact above 102
upside is no longer easy after such a sharp run
For holders, this is about managing a winner, not rushing for the exit.
For non-holders, patience matters more than excitement. Either wait for a pullback into 108 to 110 or 100 to 102, or demand proof with a daily close above 121.
ASTS can go higher. Targets at 130, 141, and 157 are real if momentum continues. But risk is now higher than it was in December, and discipline matters more than conviction.
This is exactly why we plan trades before they move, and update them after they do.
Stay patient. Stay structured. Let the market do the heavy lifting.
This content is provided for educational and informational purposes only and reflects our personal analysis and opinions at the time of writing. It is not investment advice, a recommendation, or an offer to buy or sell any security.
Investing in equities, especially high-volatility stocks like ASTS, involves significant risk, including the potential loss of all invested capital. Past performance, including any historical trade examples discussed, does not guarantee future results.
All trade plans, levels, and scenarios are illustrative and should be evaluated in the context of your own financial situation, risk tolerance, and investment objectives.