
BERKSHIRE HATHAWAY: Buying the Pullback (Update)
Relief bounce confirmed; targets and rules inside.

Berkshire Hathaway (BRK.B) pulled back to the 200-day and just put in a textbook relief bounce. That price action matters, but what really matters is the beneath-the-surface strength: an enormous cash and short-term treasury pile (hundreds of billions), steady operating cash flow, a rising book value per share, and a management team that deploys capital deliberately. Those elements don’t make Berkshire immune to market drawdowns, nothing does, but they turn market shocks into optionality. In downturns Berkshire’s diversified operating earnings and insurance float provide cash flow resilience, while the cash hoard and conservative balance sheet let the company buy assets or repurchase stock when prices are depressed. That combination is why a risk-defined, confirmation-based swing entry here looks asymmetric: limited downside into proven support, meaningful optional upside if the market gives breadth and volume.
Market conditions & direction
Powell’s Jackson Hole remarks shifted the backdrop: the Fed signaled a mildly dovish tilt while staying data-dependent, which lifted risk assets in the short run, but the rally is contingent on incoming labor and inflation data. In plain terms: rate-cut expectations can fuel a multi-week risk rally (good for cyclical/insurance assets), but a surprise in inflation or a sticky labor print would rapidly reverse gains. For Berkshire this means upside is higher-probability if macro breadth and buyback activity accelerate; downside is magnified if insurance or investment income weakens in a risk-off move.
Fundamental update
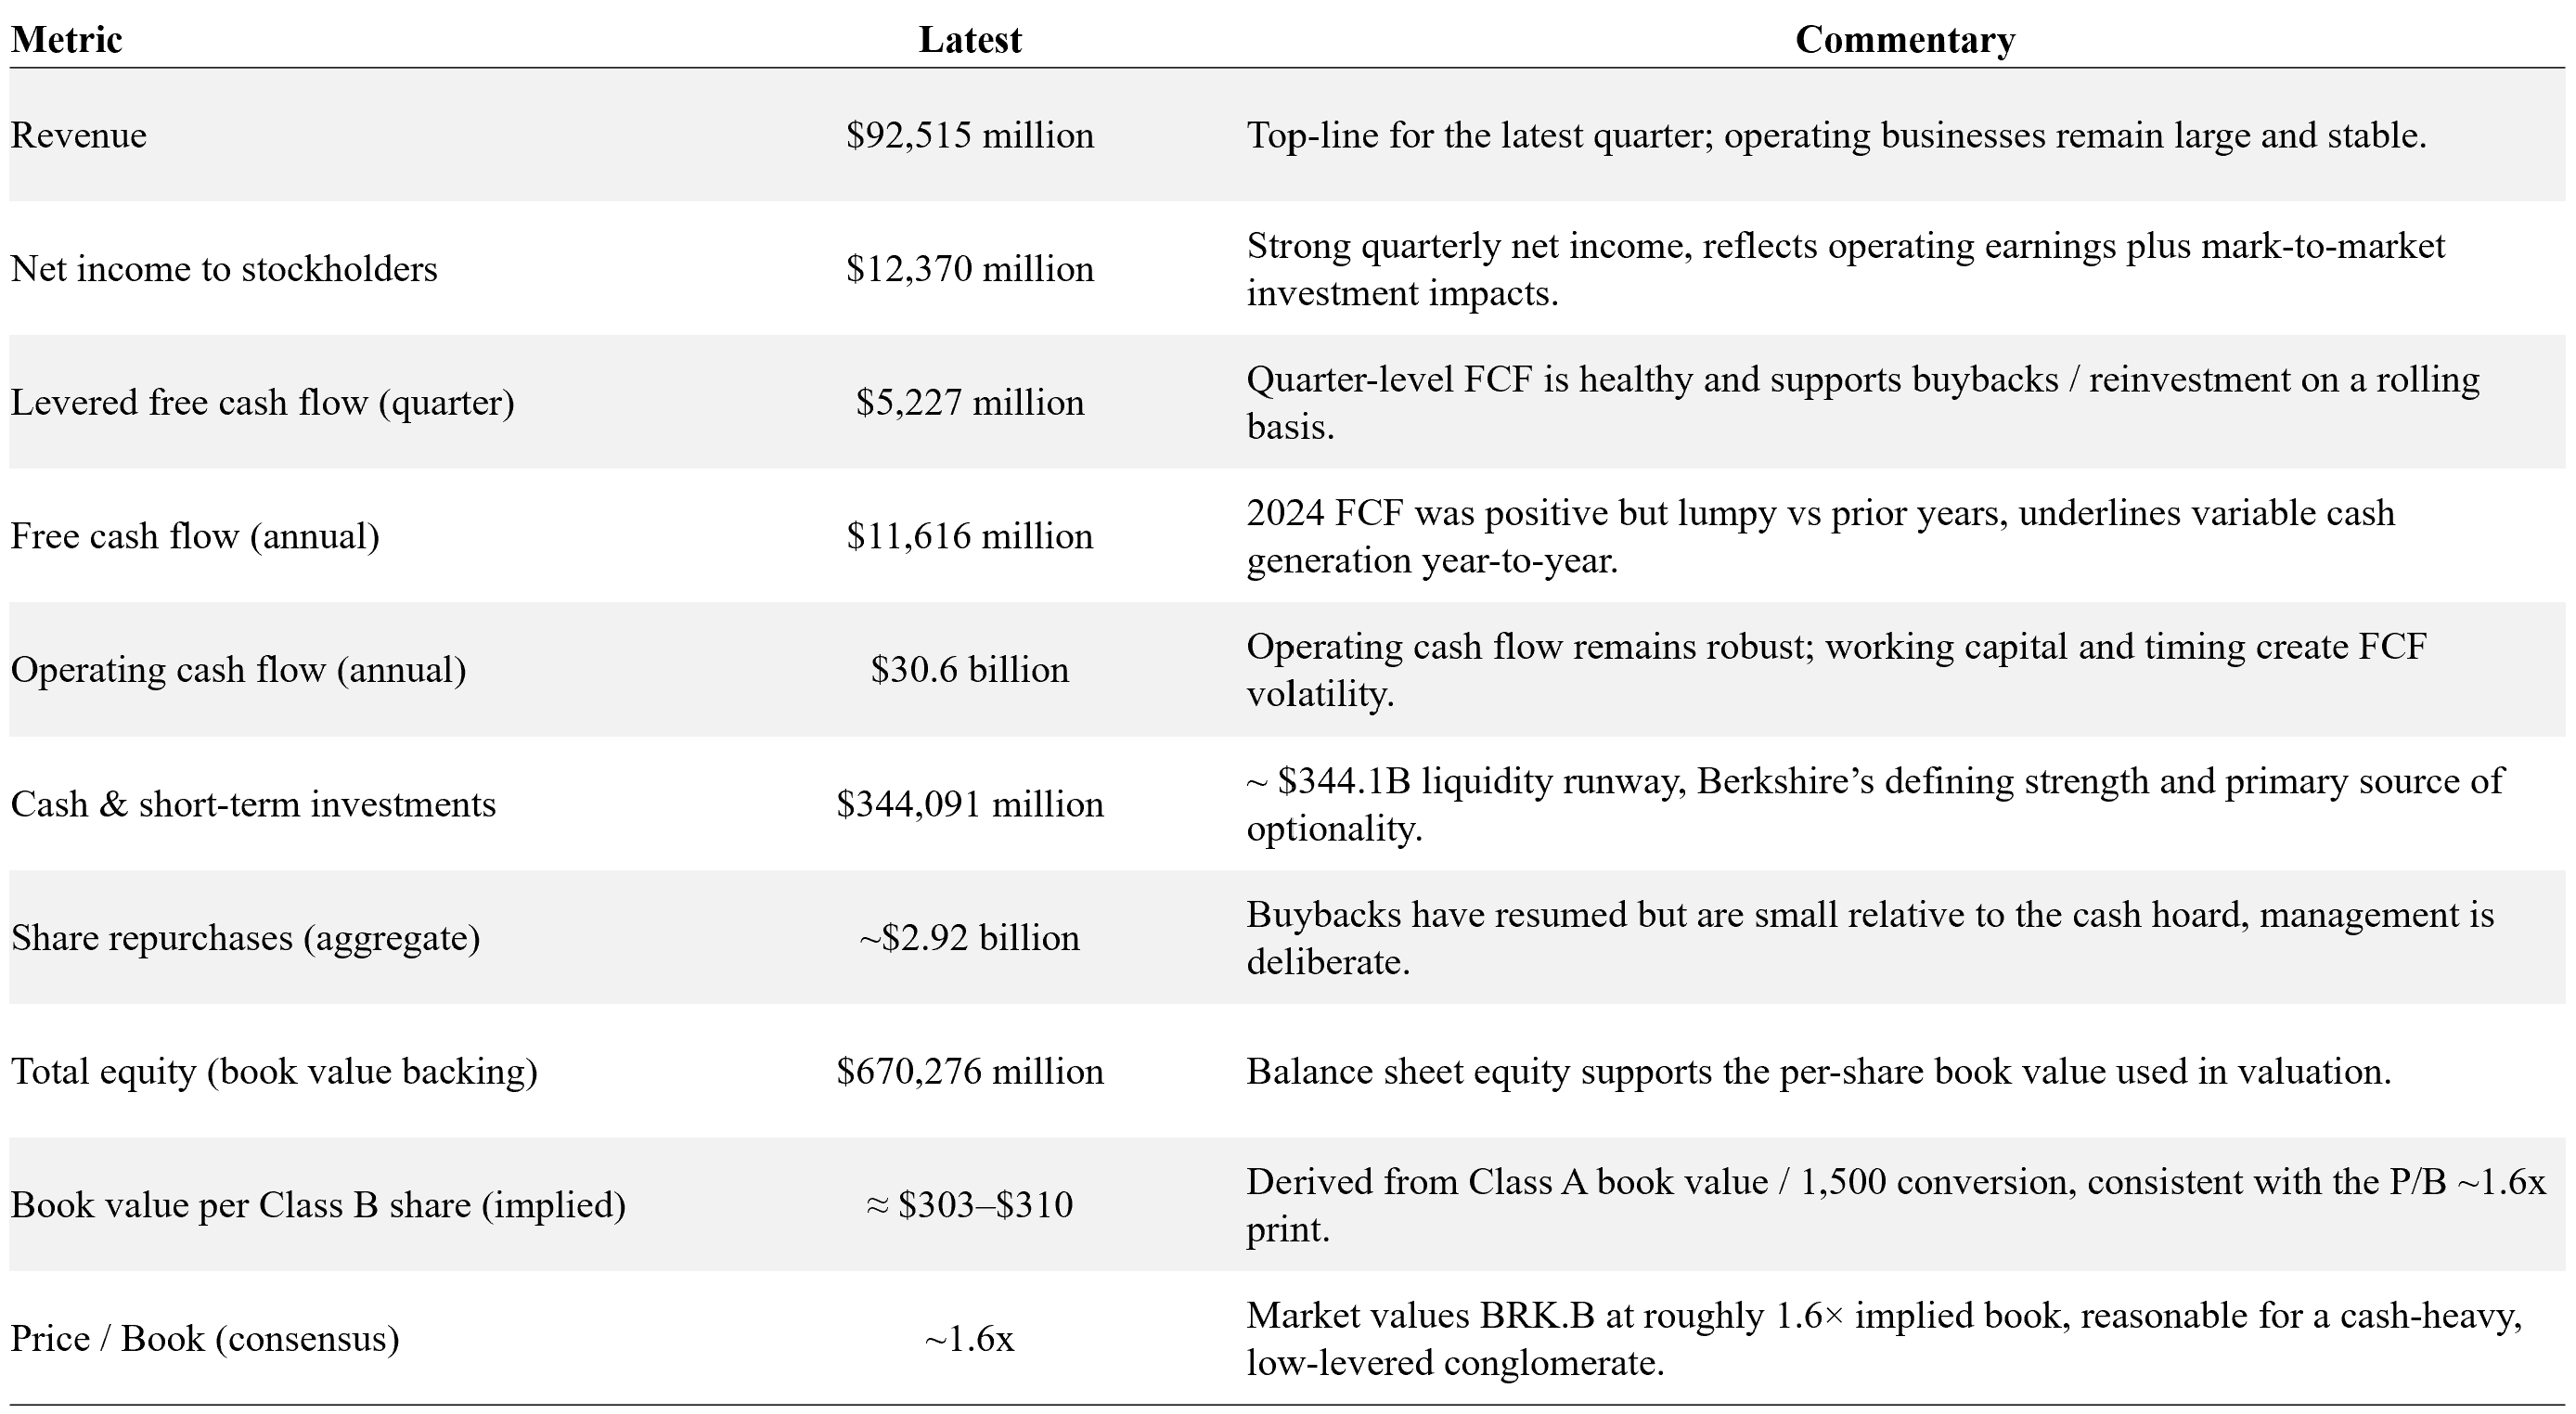
Berkshire’s balance sheet is its defining characteristic: enormous liquidity that cushions downside and funds opportunistic buybacks or acquisitions. Operating cash flow (measured at the business level) is robust but total free cash flow swings with investment and tax timing — which explains conservative buybacks. The recent Q2 balance sheet shows roughly $340B+ in cash and short-term Treasury bills; management remains deliberate about deploying it.
Technical Analysis Update
Timeframe: Primary focus is daily + weekly to capture the swing context (2–8 weeks bias) while using 2H for fine timing.
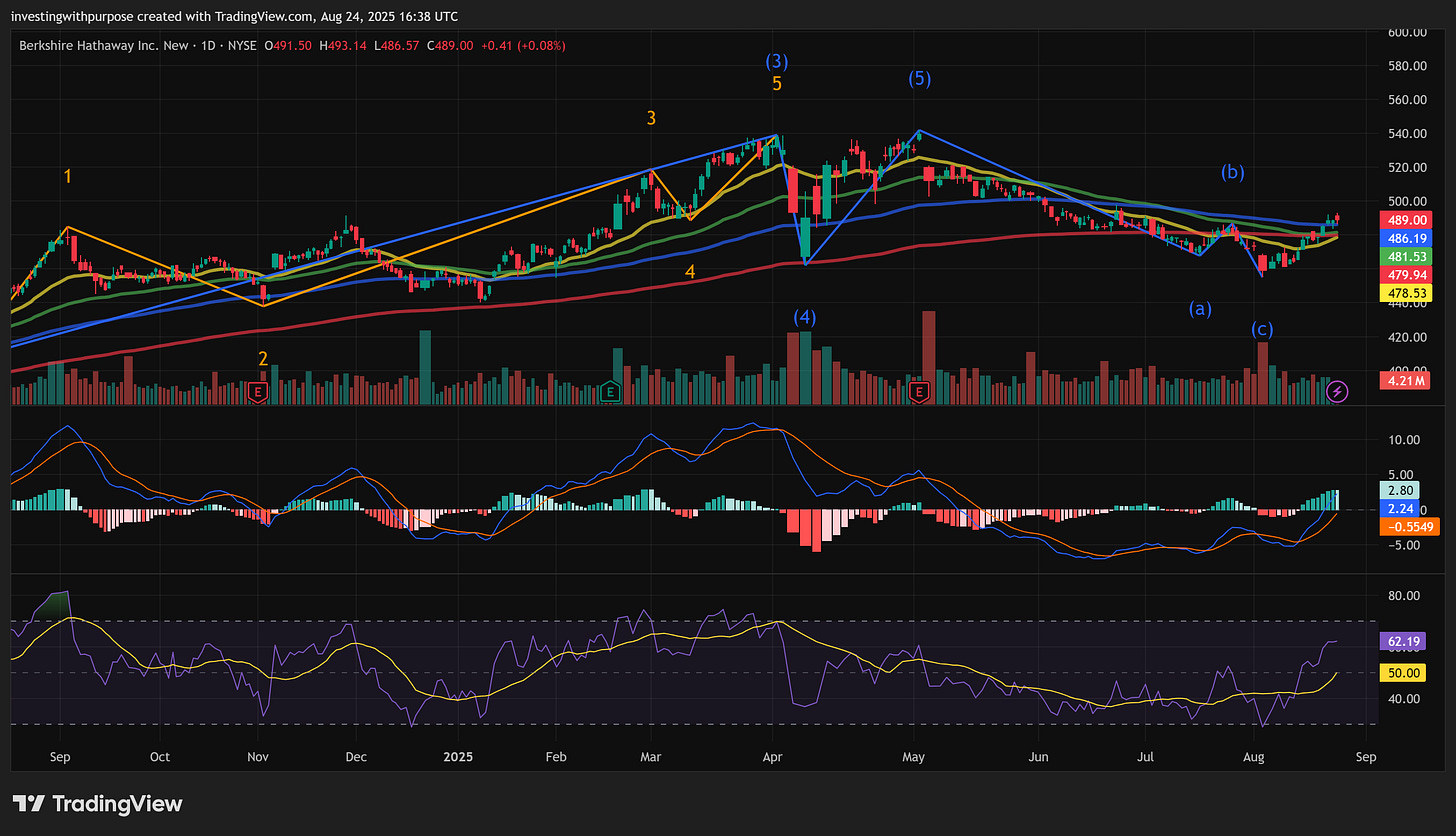
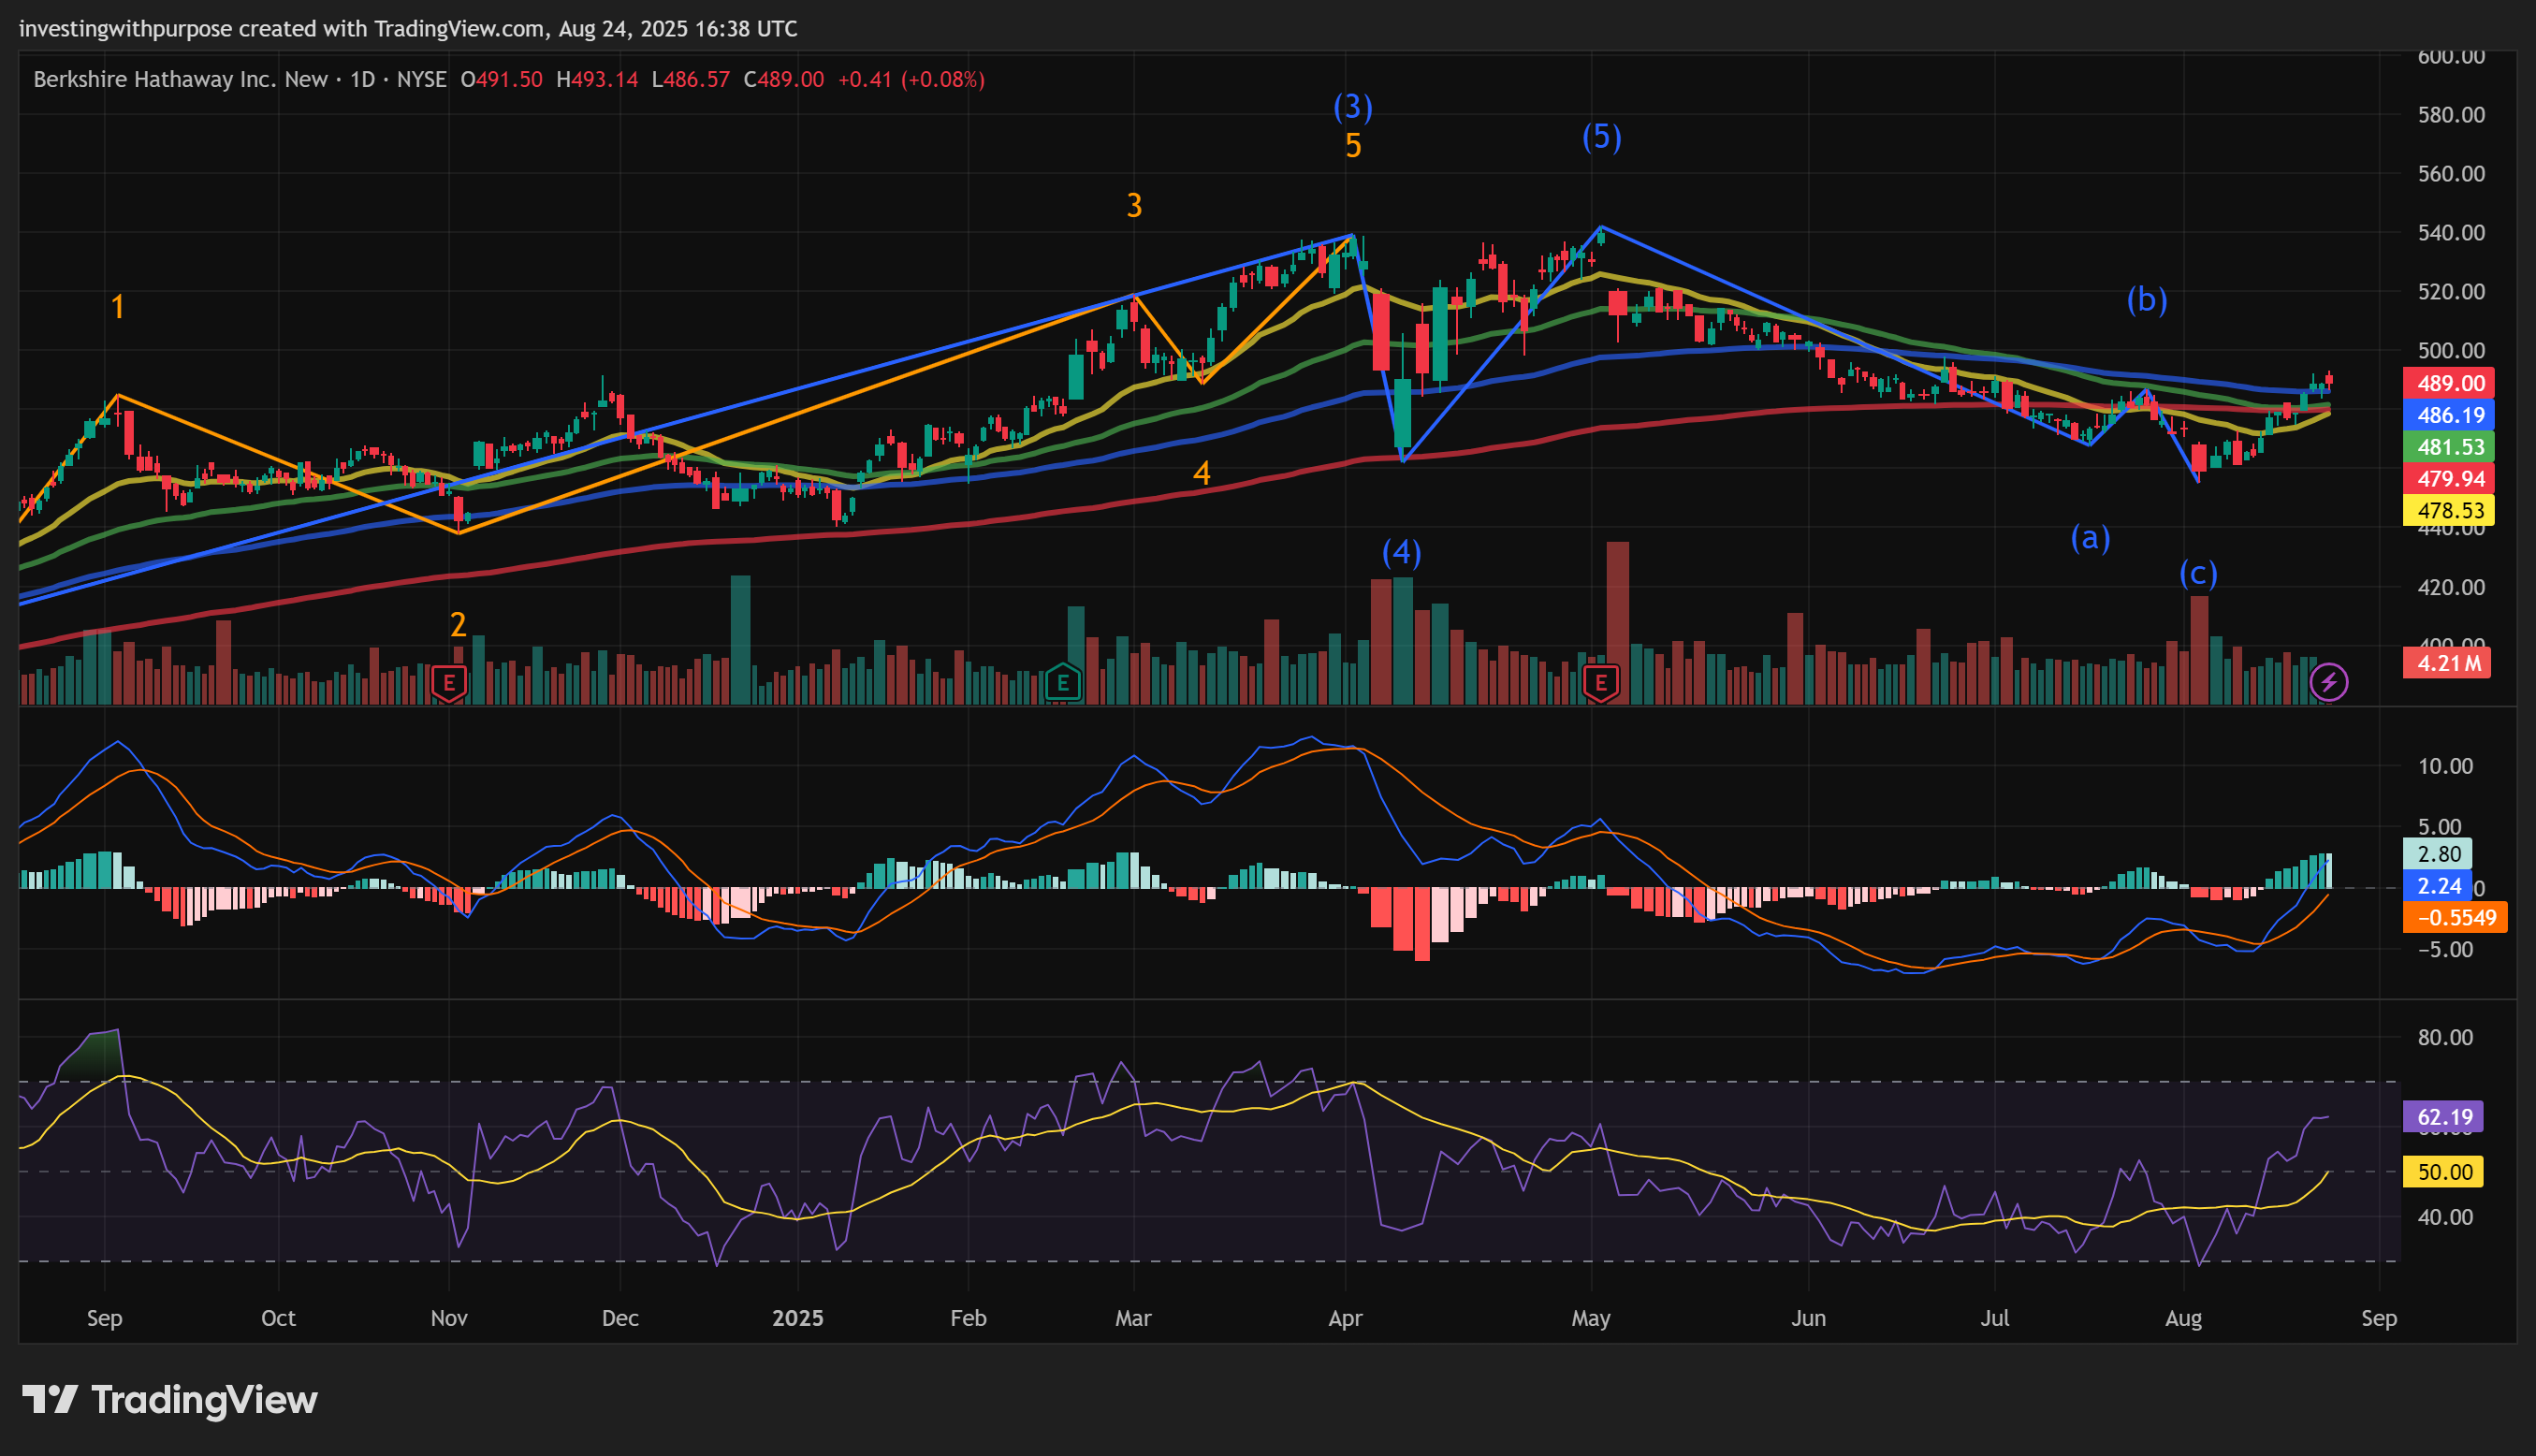
Price action: Price bounced from the 200-day / 0.786 fib confluence (~$457–$463) and has rallied into the SMA ribbon.
Moving averages: 20/50/100/200 SMAs are converging in the $493–$508 band, creating a supply zone that must be cleared to resume the medium-term uptrend.
Support structure: Immediate support sits at the 200-day near $480, with secondary support in the $463–$457 fib band where the recent low formed.
Resistance structure: The SMA ribbon ($493–$508) and the 0.236–0.382 retracement levels above it act as the first meaningful overhead cap.
Momentum (daily): RSI (~60) and MACD have turned positive on the daily, indicating short-term bullish internal momentum.
Momentum (weekly): Weekly ADX in the low–mid 20s shows trend strength is not yet robust — the move needs follow-through to become a sustained trend.
Volume profile: On-balance-volume and the daily bars show a flattening rather than a clear pickup in buying — volume confirmation is still missing.
Volatility: ATR has contracted slightly after the low, consistent with a relief bounce rather than an impulsive breakout.
Chart morphology: The pattern looks like a classic relief rally inside a larger up-channel; a decisive break above the SMA cluster converts it into a higher-probability continuation pattern.
Extensions & targets (technical read): On a clean breakout, logical extension targets are the 1.272 ($508–$513) and 1.618 ($527) measured moves from the recent swing.
Invalidation / fail signal: A daily close below the $463–$457 fib zone, and especially below $450, would flip the technical picture back toward a deeper retracement.
Our trade Plan
Core entry: buy on a daily close > $495.
Aggressive entry: scale in at $485–$490 (200-day / fib confluence).
Core stop: $480 (protects under the 200-day).
Aggressive nibble stop: $475.
Targets:
T1 $508 (trim ~35%)
T2 $527 (trim ~35%)
T3 $570–$595 or trail
Position sizing: risk 2% of account on the core position.
Management rules: after T1 move stop to breakeven; after T2 trail with the 20-day low or a 10% trailing stop.
Volume rule: require above-average daily volume on the move through $495 before materially adding.
That’s it: tight risk, defined rules, scale into strength.
Bottom line
This isn’t a speculative long; it’s a position anchored to one of the strongest balance sheets in corporate America. Berkshire’s mix of recurring operating earnings, insurance float, and a massive cash runway gives it real resilience in stress periods and the freedom to act when others are forced sellers. The trade is simple: buy confirmation above the SMA/fib cluster, protect capital under the 200-day, and scale only as the market proves the rally with volume and breadth. If the macro and corporate headlines remain constructive, that conservative optionality can compound into meaningful gains; if not, you have a clean exit and preserved capital. Steady compounding wins.