


Berkshire Hathaway reported a record $397.4B of gross cash and Treasury bills, 31.7% of its total assets, after 14 straight quarters of selling more stock than it bought. The market has charged it for the patience: the shares are up 3.5% in 12 months. Then, quietly, the cash started doing its job.
One of the largest liquidity positions ever assembled is either a drag or an option. This year it started acting like an option.
The premise checks out, and then some. Berkshire ended the March quarter with a reported $397.4B of gross cash and Treasury bills, a record in dollars and, at 31.7% of total assets, as a share of the company too; net of a $17.2B payable for unsettled bill purchases, the figure is closer to $380B. Either way, cash is now about 44% of the investment portfolio and roughly 37% of the company’s market value.
The lazy read is that Berkshire has become a parked car with an insurance company attached. The better read, and this piece’s thesis: the cash is a priced instrument, earning substantial short-term income while functioning as a call option on somebody else’s bad day, and the first year of Greg Abel’s tenure has shown what makes Berkshire exercise it. 3 numbers frame everything below: $397B, the roughly $487 per B share where management actually repurchased stock in March, and Saturday, August 1, 2026, when the next report is expected. Prices are based on the July 17, 2026 close of $490.91.
Key Takeaways
The cash: a reported $397.4B gross ($380B net of unsettled bill purchases), a 14th consecutive quarter of net stock selling, and the $339B of bills alone producing roughly $12.5B a year at current yields.
The machine underneath: Q1 operating earnings rose a reported 17.7% to $11.35B, with profitable underwriting across all 3 insurance units, BNSF up about 13%, and a $176.9B insurance float funding the structure.
The deployments the market noticed: a reported $31B Alphabet stake, which Warren Buffett says he personally initiated, and the first buyback of the Abel era, roughly $235M in March near $487 per B share.
The cost: the stock is up 3.5% over 12 months, materially behind the index, and with just 4 analyst ratings, coverage is remarkably thin for a $1.06T company.
The setup: $490.91 sits at 1.46x book. Support stacks at 482 to 488, a band that contains management’s actual March repurchase price, with a deeper shelf at 464 to 472. The report is expected Saturday, August 1.
The Machine Under the Cash
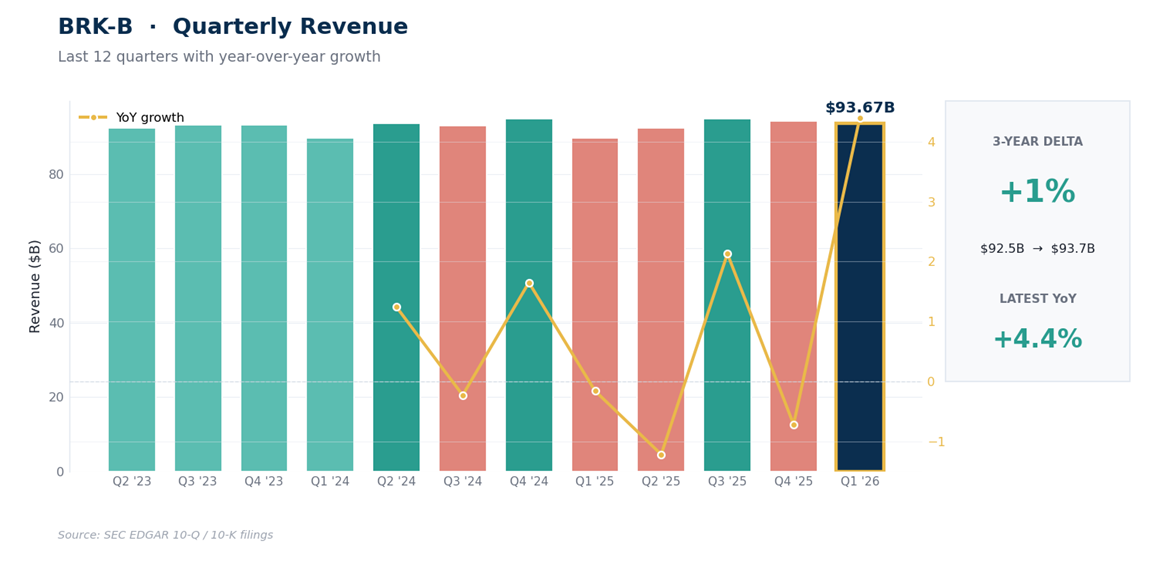
Before the cash means anything, look at what generates it. On revenue of $92.07B, first-quarter operating earnings rose a reported 17.7% to $11.35B, with all 3 insurance units (GEICO, the primary group, and reinsurance) underwriting profitably, BNSF’s earnings up about 13%, and the manufacturing and retail collection growing mid-single digits. One asterisk, applied immediately: GAAP net earnings were a lower $10.11B, and while that figure more than doubled from a year ago, the comparison is noise, because accounting rules push unrealized investment swings through the income statement every quarter. Operating earnings are the number that describes the business; Berkshire has said so for years.
The strategic core, and the part most coverage skips, is the float. Berkshire’s insurance operations hold $176.9B of policyholder money, premiums held before claims are paid. When underwriting runs at a profit, as it did across the board in Q1, that $176.9B is better than free: Berkshire is effectively paid to hold other people’s capital and invest it.
The float is why the cash pile isn’t what it would be at any other company. A normal balance sheet holding this much in bills is dead weight; a structure where $177B of the funding costs less than nothing, backed by $727B of equity at 0.18 debt to equity, is a permanent, unleveraged bid waiting for a price. That’s the design, and it has been for 60 years.
What $397B Actually Is
Run the arithmetic like an owner, with the assumptions shown. Of the gross total, about $339B sits in short-term Treasury bills, which at roughly 3.7% yields produce something like $12.5B a year of near-risk-free nominal income; count the operating cash too and the annual carry runs $13B to $15B. That income arrives while the position’s option value rises exactly when everything else falls, which is why big cash looks dumbest late in bull markets and smartest a quarter after they end.
The cost is real; we’ll get to it. But 2026 has shown the hurdle in action, and the evidence is selective rather than sweeping. Berkshire stayed a net seller of equities in Q1, roughly $24.1B sold against $15.9B bought, while also spending about $9.7B on acquisitions, mostly the reported $9.5B OxyChem transaction. Out of all that activity, 2 deployments captured the market’s attention.
The first was Alphabet: a reported $31B position that Buffett has publicly said he initiated himself. The second was Berkshire’s own stock: roughly $235M repurchased in March at an average near $487 per B share, about 1.44x that quarter’s book value, with Abel writing that shares will be bought back “when they trade below our estimate of intrinsic value, conservatively determined.” Note what the test isn’t: a book multiple. It’s intrinsic value, conservatively judged. Abel’s February message called the balance sheet “a strategic asset to be deployed at the right time,” and you don’t have to take the sentence on faith; the Alphabet purchase is what it looks like in practice.
The Cost of Patience
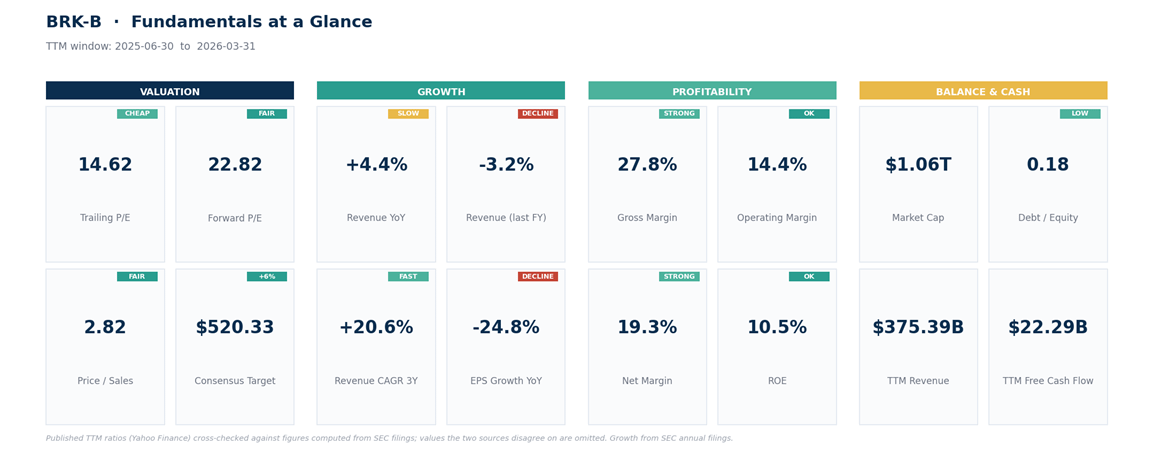
Now the honest ledger. A 3.5% return over 12 months is materially behind the index, and the drag is structural while the cash sits: roughly 37% of the company’s market value earning bill yields in a year when equities compounded far faster.
The size problem is permanent; at $1.06T, even a $31B Alphabet stake moves the needle modestly, and the universe of needle-moving acquisitions is a short list of companies that rarely go on sale. Succession isn’t theoretical anymore but remains an overhang: Buffett stays chairman while his personal stake is reportedly being distributed on a schedule running to 2034. And a quirk worth knowing before the valuation section: the trailing 14.6x earnings multiple is built on GAAP income swollen by investment gains, while the forward multiple screens near 23x because estimates track operating earnings.
Neither is wrong; they’re measuring different things, which is why book value is the cleaner yardstick here.
What the Price Assumes
At $490.91 the stock trades at 1.46x a book value of roughly $337 per B share. Our scenarios, built on the book multiple: a bear case at 1.3x, roughly $438, takes a recession that turns the underwriting cycle and marks the equity portfolio down together.
A base case at 1.5x, roughly $506, assumes the operating engine keeps compounding and the cash keeps earning its carry.
A bull case at 1.6x, roughly $539, needs a deployment event that converts optionality into assets and re-rates the multiple toward the record near $542. 2 markers help calibrate: management actually repurchased near $487, about 1.44x book, and a strict 1.4x-book reference sits near $472, an analytical level rather than Berkshire’s price. The thin 4-analyst consensus mean of $520 lands between our base and bull.
The Technical Map
Primary trend: a quiet, intact long-term uptrend consolidating sideways. The entire 52-week range spans 13.5%, from $455.19 to $516.85, and the stock moves about 1.5% on an average day, the calmest tape this letter has covered all year.
Structure: since April the range has tightened further: a May 5 low at $464.30, a July 7 high at $512.60, and price now mid-range at $490.91 with every major daily moving average flattened between $488 and $494.
Support: 482 to 488, where the 61.8% retracement of the May-to-July advance (the point where most of a move has been given back), the lower volatility band, and the 100-day and 200-day averages all stack; the band also contains the roughly $487 management actually paid in March. Below that, 464 to 472 pairs the May low and the halfway retracement of the longer advance with the 1.4x-book analytical reference.
Resistance: 501 first, then 507, then the July high at 512.60, then the 52-week high at $516.85, with the record near $542 above.
Momentum: daily RSI, a 0-to-100 momentum gauge, is 48, as neutral as the number gets; the weekly trend drifts mildly higher with no strong pressure either way.
Invalidation: a daily close below 462 breaks the May low and the lower shelf together, which for this name would be a genuine character change.
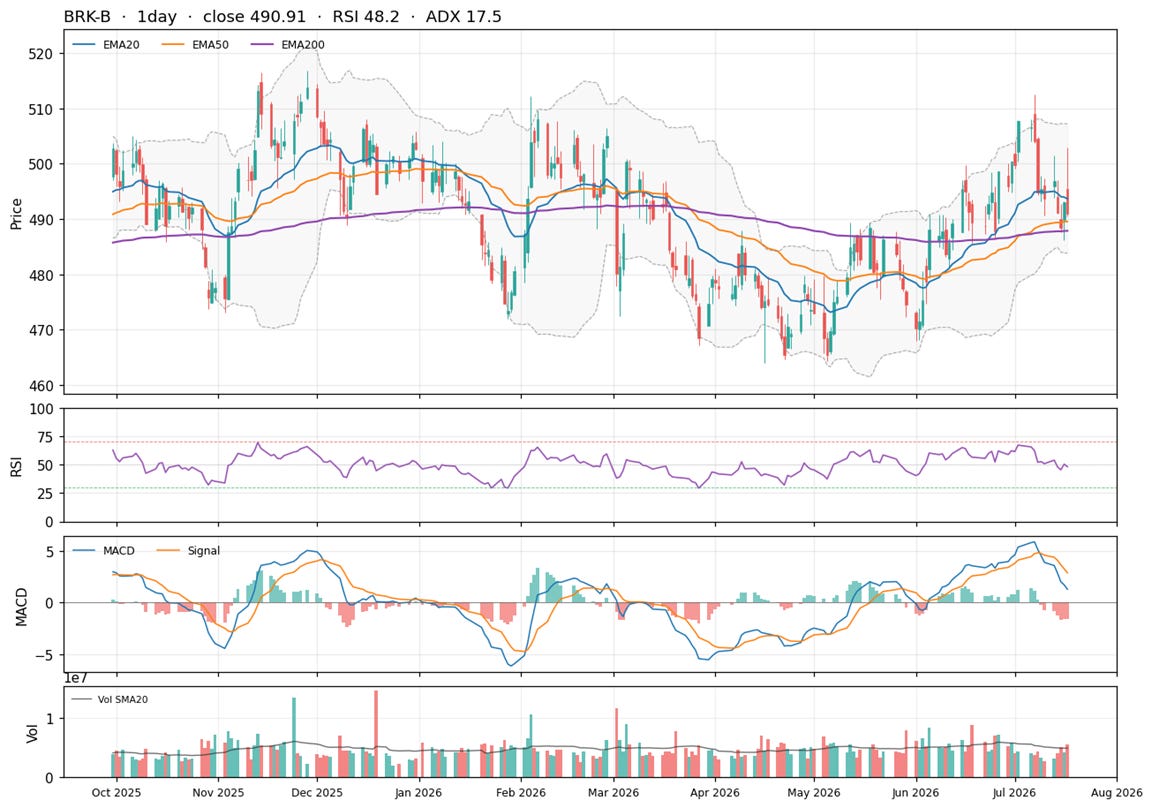
Net read: a low-volatility coil inside a long uptrend, sitting just above a support band that happens to contain management’s own repurchase price. The Saturday report is the next scheduled disturbance.
One possible framework, not a promise.
