


Bloom fell from a $351.28 June record to $157.66 in about a month, including a drop of as much as 16% on the very day it reported, on fears that big data-center projects were slipping. Then the numbers landed: revenue up 165% to a first-ever billion-dollar quarter, margins up 6 points, operating income up 8-fold, and guidance raised to roughly 100% growth for the year. The stock gapped up by double digits at this morning’s open. Here’s what the company actually does, what the quarter proved, and what the new map looks like.

The AI buildout needs power faster than the grid can deliver it. Bloom sells time.
Bloom doesn’t solve the AI industry’s cheapest-power problem. It solves its time-to-power problem, and this week showed how valuable, and how violent, that distinction has become. The company entered Tuesday’s report having lost more than half its value in about a month, fell as much as 16% during Tuesday’s session before closing down 11% at $166.84, then reported the strongest quarter in its history after the bell. The stock jumped 11% in late trading and gapped up by double digits at this morning’s open; pricing that fluid is part of the story, so the analysis below anchors to Tuesday’s close. Prices are based on the July 28, 2026 close of $166.84; results are from the company’s release and call.
Key Takeaways
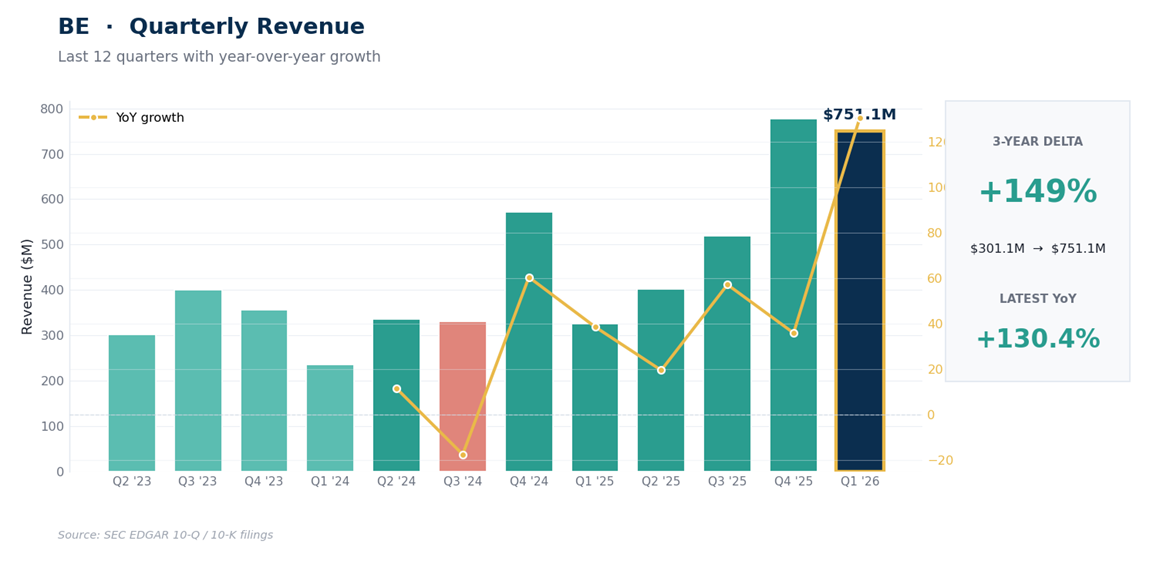
The quarter was a step change, not a beat: revenue of $1.1B grew 165% (the first quarter above $1B), product revenue grew 215%, non-GAAP gross margin reached 34.3% (up 604 basis points), and non-GAAP operating income hit $239.6M against $28.6M a year ago.
Guidance moved with it: full-year revenue of $3.9B to $4.2B, roughly 100% growth over 2025, with non-GAAP operating income of $800M to $900M and non-GAAP EPS of $2.55 to $2.85.
The July crash had specific causes: reports of possible delays in large deployments tied to Oracle and American Electric Power, plus profit-taking in a stock that had risen roughly 10-fold from its 52-week low to its June record.
Valuation, anchored to Tuesday’s close: 62x the midpoint of the freshly raised EPS guide and about 12x this year’s guided revenue, before this morning’s gap; every 10% the gap holds adds roughly 6 turns to that earnings multiple.
The new map: pullback zone 178 to 188, invalidation at a daily close below 156, repair above 230, references 262, 320, and the 351 record.
What Bloom Actually Does
Bloom makes solid-oxide fuel cells: modular outdoor power units that convert natural gas, biogas, hydrogen blends, or hydrogen into electricity on-site, without combustion, installed in months rather than the years a new grid connection can take. That last clause is the whole investment case right now.
AI data centers need hundreds of megawatts on schedules the interconnection queue can’t meet, and Bloom’s boxes are one of the few ways to get large, reliable power onto a site quickly. CEO KR Sridhar’s claim on the call, that Bloom “has become a standard for on-site power in the AI market,” is the company’s framing, but the revenue mix backs it: product revenue, the boxes themselves, grew 215% year over year.
Around the hardware sits a long-tail service business, roughly $14B of contracted service backlog spanning 10 to 15 years, and a financing structure worth understanding precisely: the expanded $25B Brookfield framework can help fund customer deployments, reducing financing friction and potentially limiting the project capital Bloom must provide itself. It’s an enabler, not $25B of funded backlog.
The Quarter That Broke the Weakest Version of the Bear Case
The numbers read like a different company from the one the market spent July selling. Revenue of $1.1B grew 165%. Non-GAAP gross margin expanded 604 basis points to 34.3%, with product margins at 37.2% and service margins nearly doubling to 22%. Non-GAAP operating income was $239.6M versus $28.6M a year earlier, and operating cash flow swung to $226M, a $439.5M improvement year over year. Non-GAAP EPS of $0.78 nearly doubled the $0.41 consensus. Management’s own summary line carried the operating-leverage story: revenue grew 166% while non-GAAP operating expenses grew 48%. And the guide moved up to $3.9B to $4.2B of revenue, which at the midpoint doubles 2025’s $2.0B, with $800M to $900M of non-GAAP operating income.
The bear case into the report was that big projects tied to Oracle and American Electric Power were slipping, and that a stock up 10-fold from last year’s low couldn’t survive a delay. The release didn’t name-check every project, but a quarter this large, with cash collection this strong, is hard to square with a demand problem. What it doesn’t settle: timing risk on any single deployment, customer concentration, backlog conversion, capacity-expansion execution, and the natural-gas dependence of most installations. That’s the surviving bear case, and it’s about execution, not demand.
What the Price Now Assumes
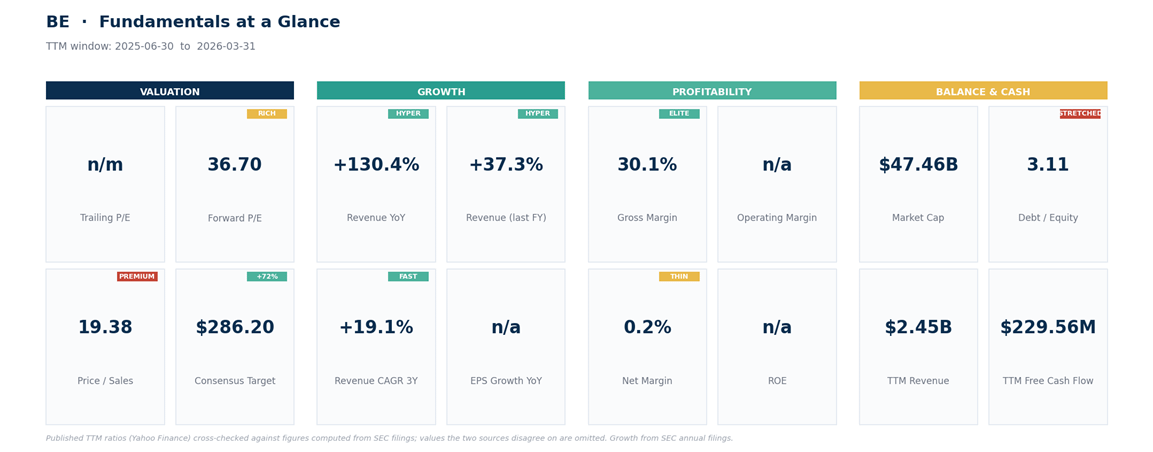
Valuation stays anchored to Tuesday’s $166.84 close, because the morning’s pricing is still moving: at that close, the stock traded near 62x the midpoint of the freshly raised EPS guide and about 12x this year’s guided revenue, and every 10% the opening gap holds adds roughly 6 turns to the earnings multiple. The consensus forward multiple sits near 37x next year’s estimates.
That’s a premium in the GE Vernova class: the market pays it because the growth is triple digits and the margin curve just proved itself, and it charges for it whenever a single project wobbles, which July demonstrated. GAAP context still matters: the quarter pushed trailing GAAP earnings just into positive territory, roughly $0.75 of trailing diluted EPS by simple addition, but the resulting trailing multiple is in the hundreds and offers little support, so the multiples above lean on the company’s own non-GAAP guide. The Street’s targets (mean $286.20, range $70 to $390) are mostly pre-crash artifacts; read them as a dispersion gauge, not a valuation.
The Map After the Whiplash
One possible framework, not a promise, and a volatility warning first: Bloom’s 14-day average true range is about 17% of Tuesday’s close, the widest of any name we’ve mapped this season, and the last 5 sessions include a 15% down day and this morning’s double-digit gap up. Levels here are zones, not lines, and gaps are the norm.
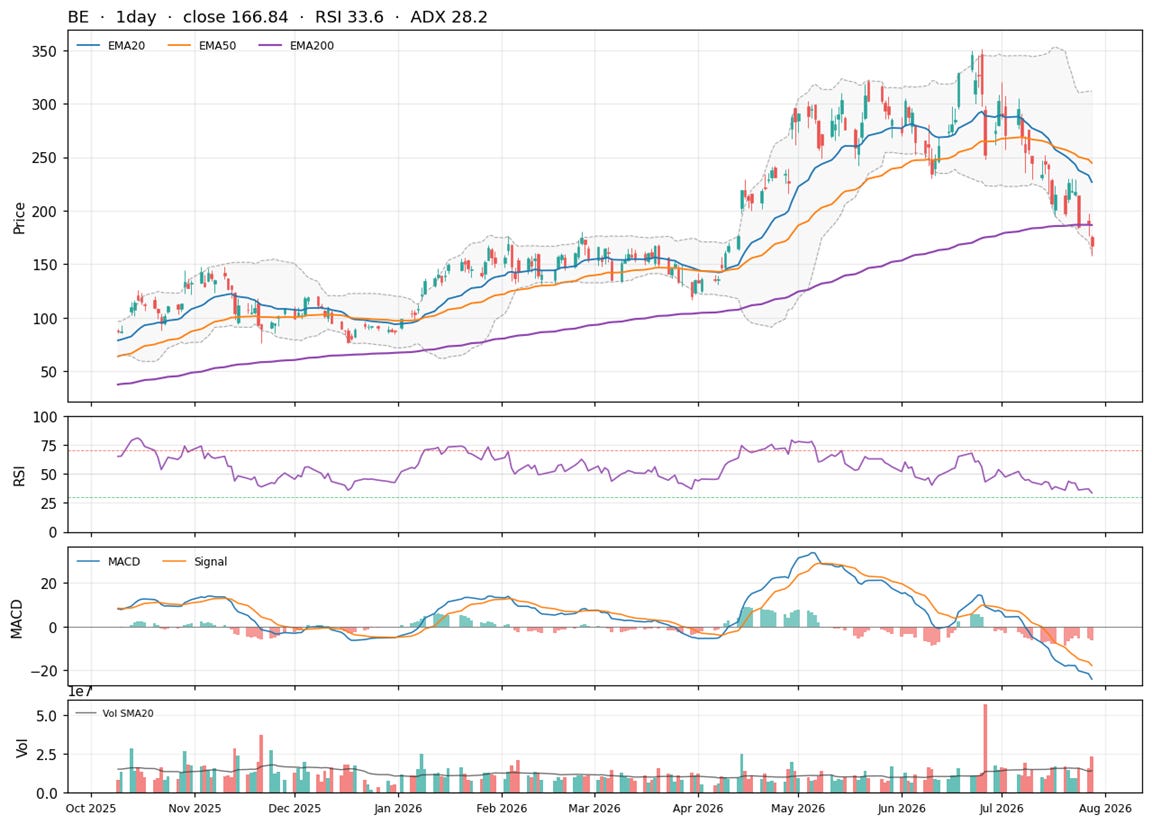
Pullback zone: 178 to 188, where the earnings gap launched (Tuesday’s after-hours trade near $185.60), the 200-day average at $186.58, and last week’s 184.89 and 188.18 closes all cluster. A gap-fill retest that holds this zone converts the reversal into a base.
Invalidation: a daily close below 156, under Tuesday’s $157.66 capitulation low. Below that, the earnings reaction has fully failed and the July downtrend is back in charge.
Repair: a daily close above 230 clears the pre-breakdown shelf (3 straight highs near $229.90 in the week before the collapse) and both the 20-day and 100-day averages just underneath it.
References above: 262 (the 38.2% retracement of the June-to-July collapse), 320 (the early-July high), and the $351.28 record.
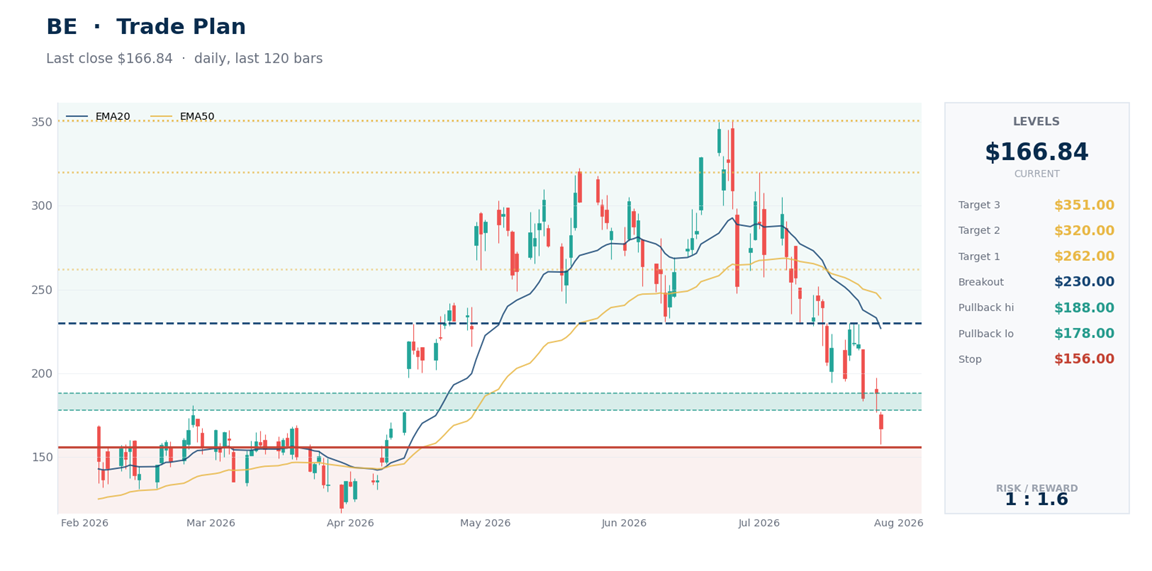
For fresh capital (illustrative): chasing a double-digit gap in a 17%-range stock is the weakest entry available. The disciplined routes are a retest of 178 to 188 that holds on a daily close, or the 230 repair for those who’d rather pay up for a confirmed trend change. From a $183 fill against the 156 line, the planned distance is about 15%, and in this name a gap can exceed it; size so a 25% adverse move stays inside your portfolio risk budget, and treat that as a real possibility rather than a tail case.
The evidence between now and the next report: any disclosed progress on the Oracle and AEP deployments, capacity-expansion updates, and whether the 178 to 188 zone holds its first test.
Bottom Line
Both moves made sense, which is the uncomfortable part. The crash priced a real risk, single-project timing in a stock that had run 10-fold from last year’s low, and the rebound priced a real result, the quarter where scale, margins, and cash showed up together. The company is genuinely interesting: its advantage is compressing the time between a data-center plan and an energized site, the scarcest thing in the AI buildout.
The price is genuinely demanding: 62x this year’s guide before this morning’s gap, more after it, in the most volatile name we’ve mapped. Those 2 facts coexist. The framework handles it the usual way: let the 178 to 188 retest or the 230 repair make the entry decision, let 156 define where the recovery thesis is wrong, and let the volatility set the size, not the enthusiasm.
This is research and commentary, not personal investment advice. Levels and trade plans are illustrative; size positions to your own risk tolerance and time horizon. The author may hold positions in names discussed.