

Broadcom Didn’t Just Break Out. It Repriced the Entire Narrative.
A 36% move in under 2 months, accelerating AI revenue, and a trend that now demands patience, not chasing. The easy money was made at 310. The smarter money is made right here.

Our subscribers and those who follow our work will know that our last Broadcom analysis on March 5 was on point. Price was sitting around 310 in a well-defined base, the setup was clean, and the thesis was straightforward. Strong business, defined risk, breakout pending.
Since then, AVGO 0.00%↑ has moved to 422. That is a 36% return in under 2 months. Short- and medium-term targets from the original plan (350, 380, and 400) were hit in sequence. The business delivered, the structure resolved, and the trade worked exactly as framed.
But the conversation has changed. The base is behind us. The breakout has run. This is no longer about identifying an opportunity. It is about managing one that has already played out, and positioning correctly for what comes next.

Key Takeaways
AVGO 0.00%↑ delivered roughly 36% from the base entry near 310 to current levels near 422, with original targets hit
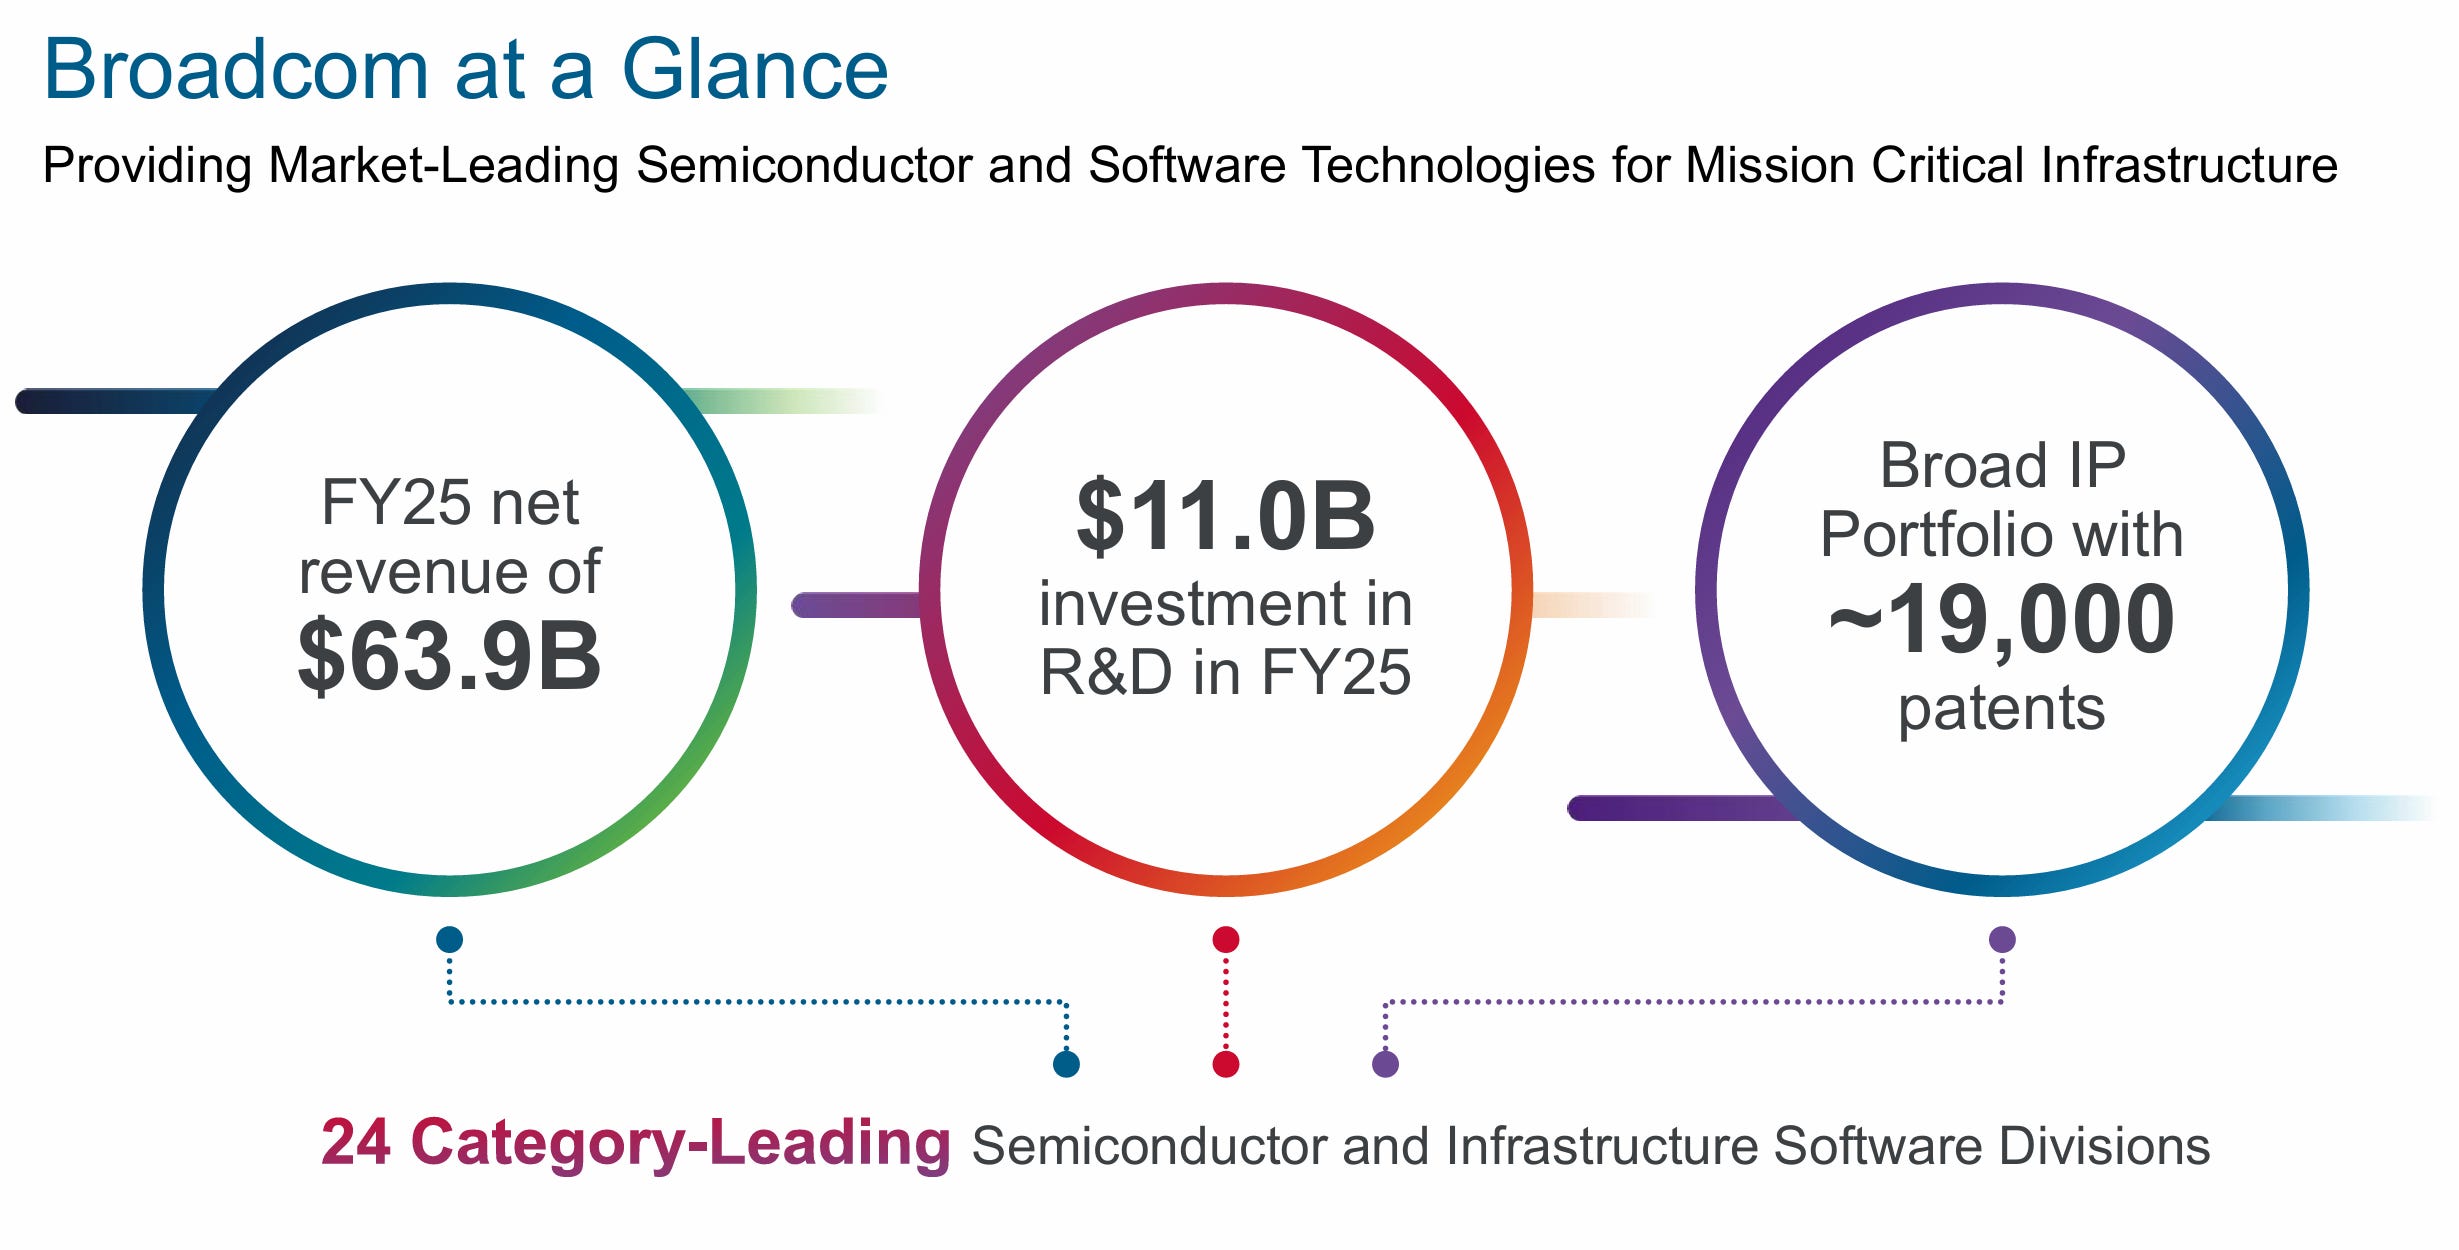
Q1 FY2026 revenue came in at $19.3B, up 29% YoY, with AI revenue of $8.4B growing 106% YoY
Q2 guidance of $22B implies 47% YoY growth, meaning momentum is accelerating, not plateauing
Adjusted EBITDA margins held at 68% and free cash flow reached $8B for the quarter, a 41% FCF margin
The stock has completed a full base-to-breakout-to-extension cycle and is now in a short-term consolidation phase
Short-term technical structure suggests a potential corrective pullback toward 390 before the next leg
400 is the critical structural pivot. Above it, the trend is intact. Below it, patience becomes the strategy.
The next high-quality entry for new positions is not at 422. It is on a controlled pullback into defined support.
Pipeline, Business, and Latest Earnings
Broadcom’s Q1 FY2026 results were not just strong. They were the kind of print that forces a re-rating.
Revenue and growth:
Total revenue: $19.3B, +29% YoY
Semiconductor solutions: $12.5B, +52% YoY
Infrastructure software: $6.8B, stable and high margin
AI semiconductor revenue: $8.4B, +106% YoY, above Broadcom’s own forecast
Q2 guidance: $22B revenue, +47% YoY
AI revenue guidance for Q2: $10.7B
The strategic picture matters as much as the numbers. Hyperscalers are not testing Broadcom products. They are deploying them into multi-year infrastructure buildouts. Custom AI chip design cycles run 18 to 24 months. Deployment lifecycles run 3 to 5 years. That creates revenue visibility almost unheard of in semiconductors.
Two recent partnerships reinforce exactly this:
Expanded collaboration with Google Cloud on next generation cloud networking
Extended infrastructure deployment partnership with Meta
These are long-cycle commitments from 2 of the largest AI spenders in the world. Broadcom is not a beneficiary of the AI buildout. It is becoming load-bearing infrastructure within it.
On the software side, VMware continues to do its job. High margins, recurring revenue, sticky enterprise customers. It is not the growth engine. It is the stabilizer that keeps cash flowing regardless of what any semiconductor cycle does.
Fundamental Analysis
Broadcom is operating at a financial profile that no longer belongs in the same conversation as traditional chip companies.
Profitability:
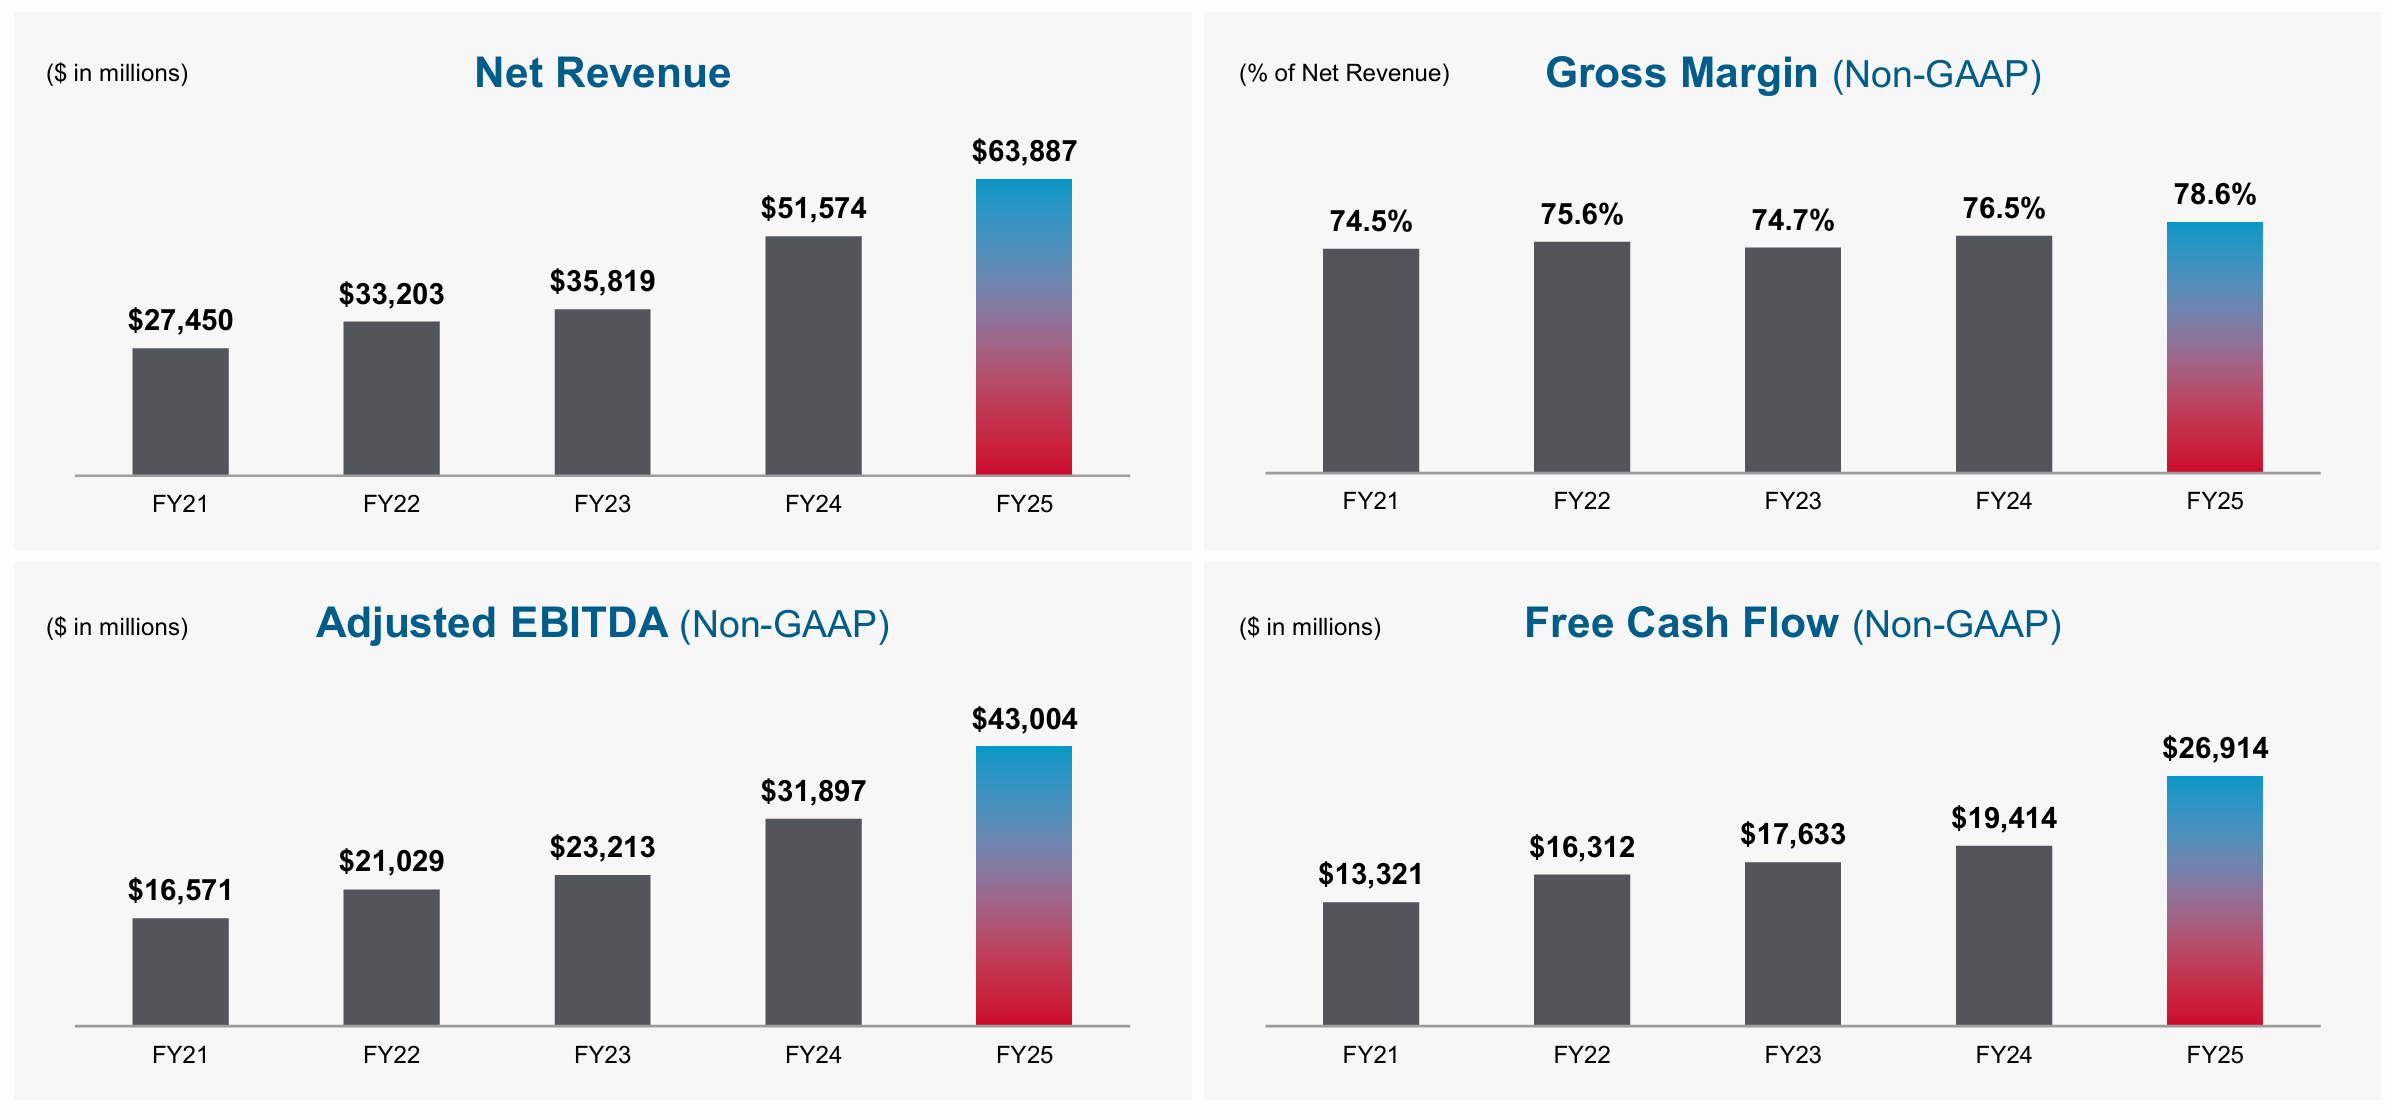
Adjusted EBITDA: $13.1B, 68% margin
Free cash flow: $8B, 41% of revenue
Non-GAAP net income: $10.2B, +30% YoY
Non-GAAP EPS: $2.05, +28% YoY
Capital returns:
$10.9B returned to shareholders in a single quarter
$3.1B in dividends, $7.8B in buybacks
New $10B share repurchase program authorized
Balance sheet:
Cash: $14.2B
Long-term debt: $63.8B, legacy of the VMware acquisition
At $8B quarterly FCF, leverage is manageable and declining
What the numbers mean: a company generating 41% free cash flow margins while growing revenue at 29% is not a semiconductor company anymore. It is a hybrid infrastructure platform being repriced accordingly. The fundamentals justified the move from 310 to 422. They also justify patience about where the next entry sits.
Technical Analysis
Long-Term Structure
The long-term picture is clean and intact.
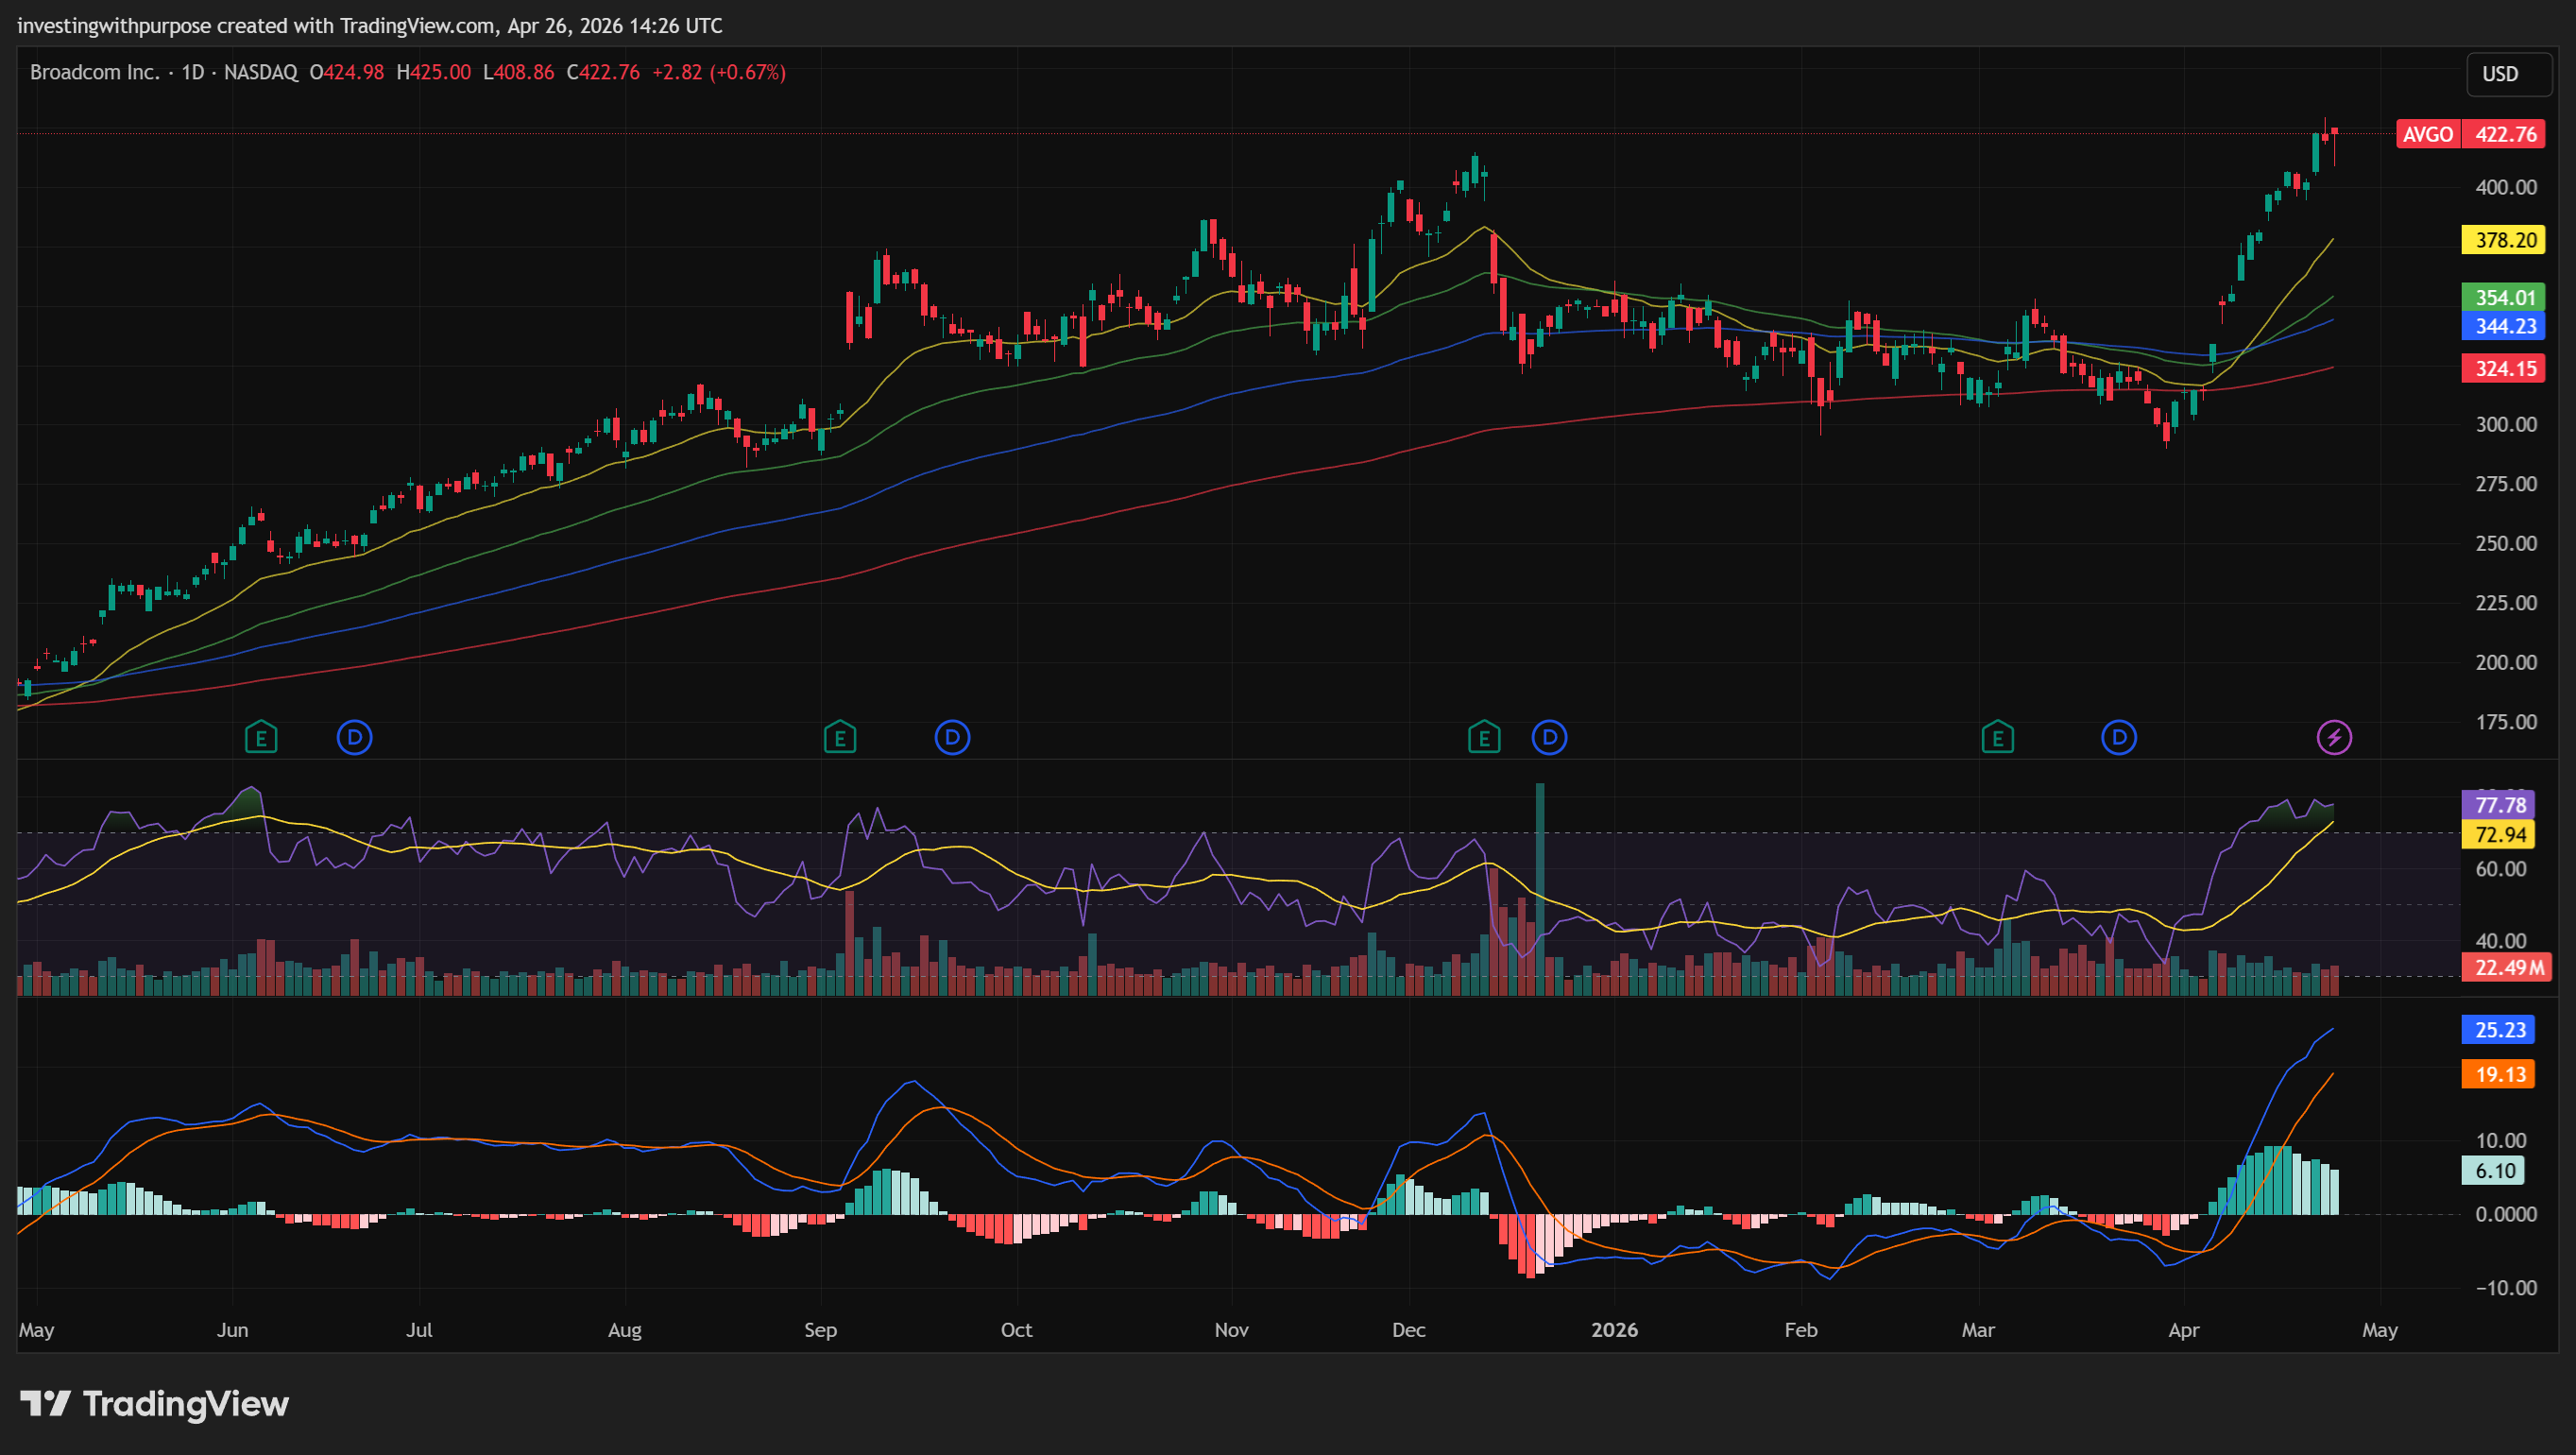
Price is above all major EMAs: 20, 50, 100, and 200 on the daily chart, all rising
Each prior resistance level, 335, 350, 380, 400, has been reclaimed and retested as support
Weekly RSI is elevated but not diverging, consistent with a strong trend in a mature phase
Weekly MACD histogram is in expansion, no signs of distribution
The key read here is that this is not a broken stock consolidating after damage. It is a strong trend taking a breath after a near-vertical move. Those are very different things, and they require different responses.
Short-Term Structure
Short-term is where things get more nuanced.
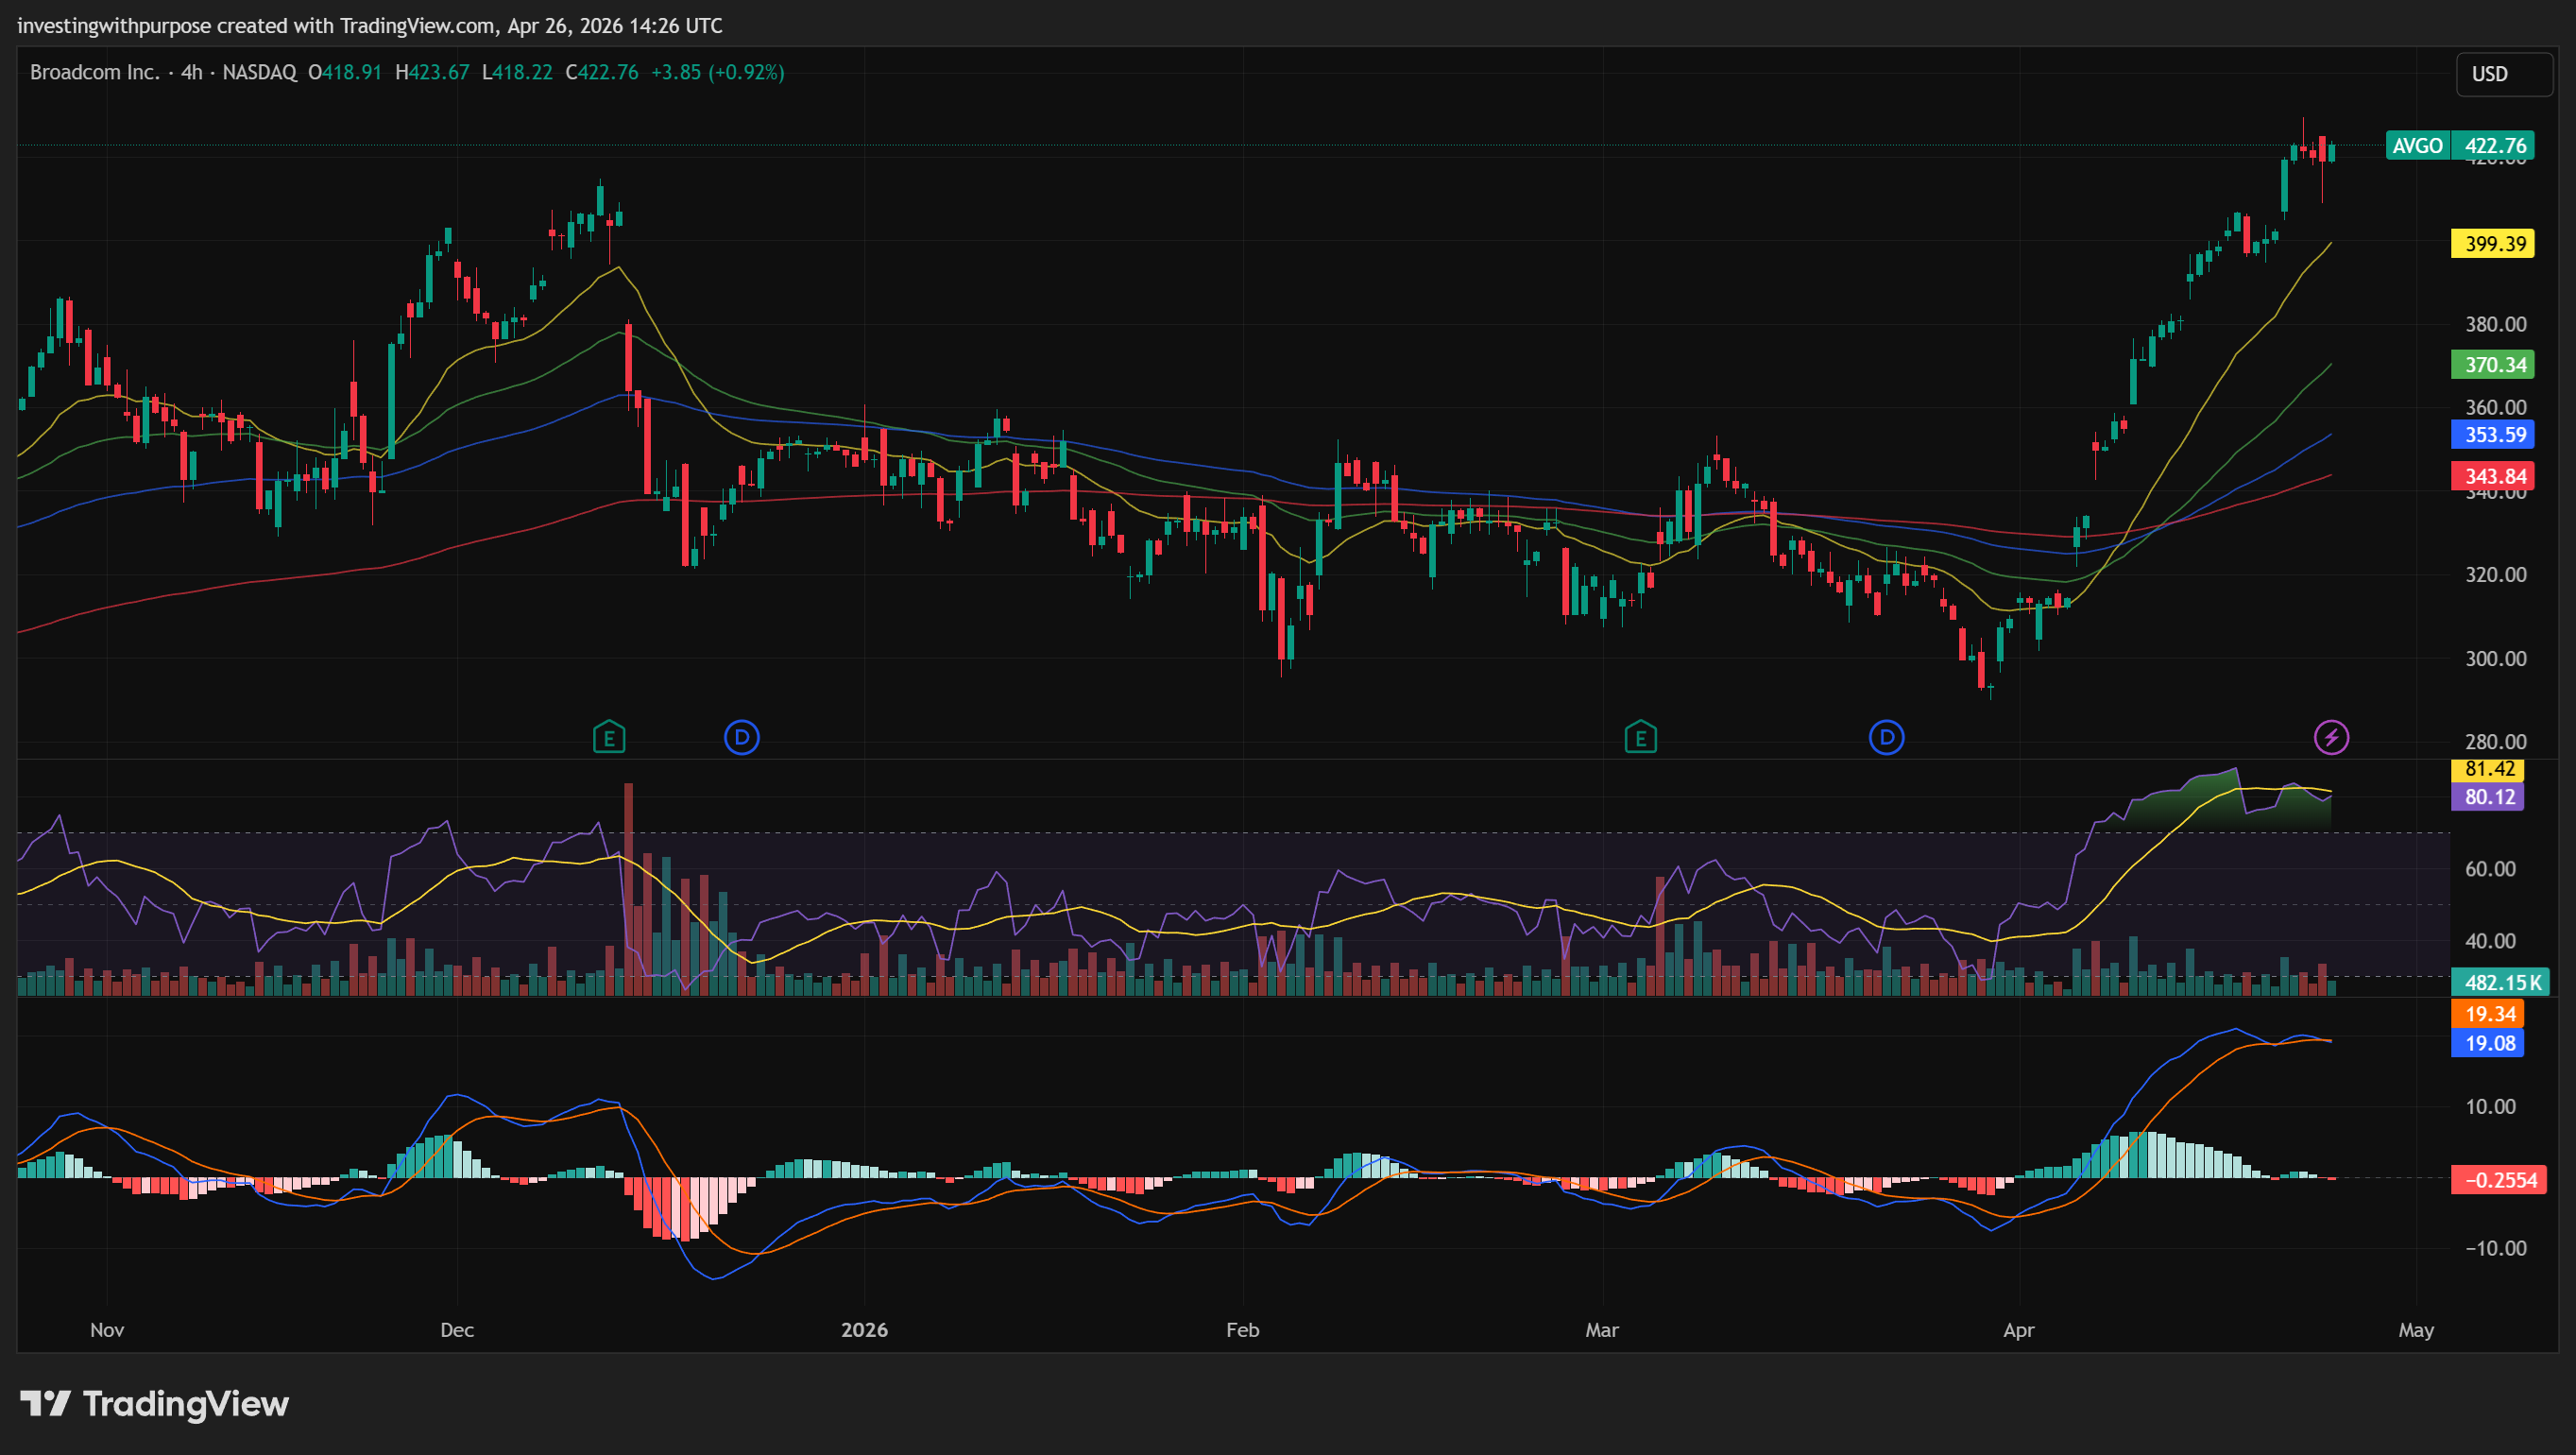
Price ran from 350 to above 425 quickly, creating extension that typically needs to resolve before continuation
Daily RSI has pulled back from overbought levels toward the mid-60s, a healthy reset
Daily MACD is flattening, histogram narrowing, not yet negative but losing momentum
The 400 level has been tested once and held, establishing it as the first meaningful support
EMA20 on the daily is currently near 378, the next structural reference below 400
EMA50 sits near 354, the broader trend base
What this means practically: the stock is cooling off after a strong impulse. Momentum has normalized without breaking down. That is the setup that tends to precede either a base-and-continuation pattern above 400, or a controlled reset toward the EMA cluster before the next leg higher. Either way, chasing at 422 without a new base forming is the lower-quality trade.
The 430 level is the immediate continuation trigger on the upside. A clean break above it with momentum recovering would signal the consolidation has resolved and the next expansion leg is beginning.
Trade Plan
If You Are Already Holding AVGO
Trend is intact. No reason to exit as long as structure holds.
First trailing reference: 400. Daily close below this level is the initial warning.
Secondary protection: 378 to 380 (rising EMA20). A break here signals a deeper reset.
Do not trim purely because the stock feels extended. Trim only if structure weakens or allocation has grown uncomfortably large.
For those in since around 310, a 36% gain is meaningful. Trimming a portion into strength and reloading on a pullback is a disciplined approach, not capitulation.
If You Are Entering a New Position
Pullback entries:
