


A week ago we framed CoreWeave and Nebius as opposite bets at nearly the same price tag: CRWV had to grow into its capital structure, NBIS had to grow into its valuation. Both reported this week, and the verdict landed hard in Wednesday’s session: CRWV closed up 19.3% at $107.73, NBIS up 34.1% at $259.20. Here’s the finding that matters more than the fireworks, and it isn’t symmetric. CRWV’s trailing-sales multiple barely moved. NBIS’s actually compressed, because revenue and profitability both grew faster than the stock did.
Key Takeaways
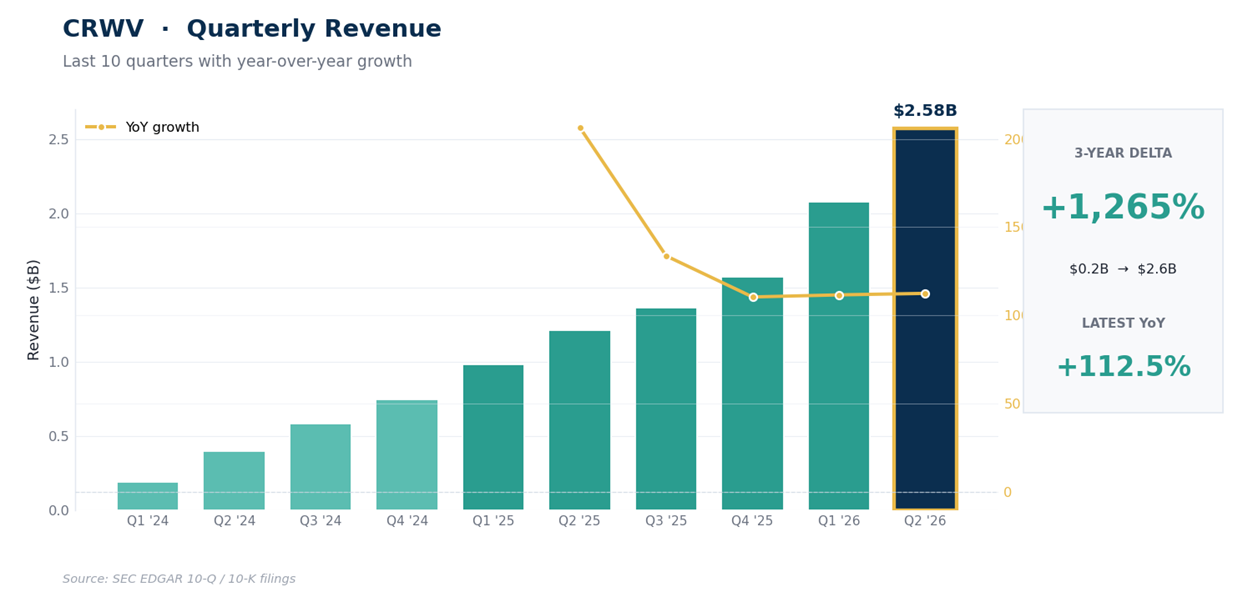
CRWV revenue hit $2.575 billion, up 112.5% YoY, and management raised full-year guidance to $12.4 to $13.2 billion in revenue and $35 to $39 billion in capex, evidence the demand story isn’t a one-quarter beat.
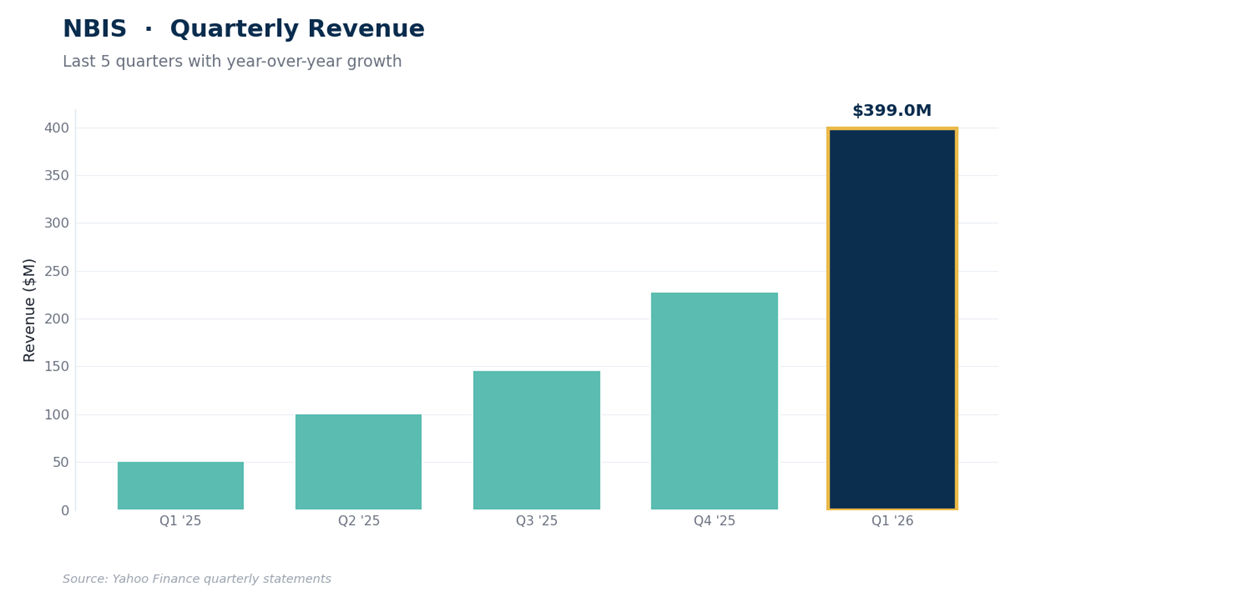
NBIS revenue was $582.3 million, up 454% YoY, decelerating from Q1’s 684% almost exactly as predicted, but adjusted EBITDA swung to a $236.2 million profit from a $21 million loss, margin jumping from 32% to 41%.
On trailing sales, CRWV is roughly flat at about 7.8x versus 7.9x a week ago; NBIS is cheaper at an implied 49x versus 54.4x, genuine compression despite the bigger stock move.
CRWV’s $104 billion revenue backlog and its total liabilities both grew this quarter; the balance sheet expanded alongside the growth, it didn’t get safer.
Michael Burry added to his NBIS short at $247 the same day it closed at $259.20, flagging that Nebius stretched its server depreciation schedule from 4 to 5 years.
CRWV: The Multiple Held, and the Guidance Raise Is the Real News
Last week’s question was simple: hold triple-digit growth and show contracted capacity keeps arriving ahead of financing. Revenue answered at $2.575 billion, up 112.5% YoY and 23.9% sequentially. More consequential: management raised full-year revenue guidance to $12.4 to $13.2 billion and capex guidance to $35 to $39 billion.
The quarter was adjusted-operating-income positive at $128 million, even though GAAP operating income was still a $49 million loss, an improvement from Q1’s $144 million loss; net loss narrowed 15.4% sequentially to $626 million, even as it more than doubled YoY against an easier $290 million comparison. CoreWeave’s own revenue backlog, its defined metric for enforceable customer commitments, sits at roughly $104 billion against a market value near $59 billion.
The balance sheet didn’t get safer, whatever the stock price says. Total liabilities jumped 41.8% in a quarter, from $50.8 billion to $72.0 billion, while cash grew even faster, from $2.2 billion to $5.5 billion.
A P/S multiple alone can hide that, so pair it with an enterprise value: using the most recent isolated debt figure available, $35.1 billion from Q1’s breakout, against the fresh cash and market cap gives an EV near $89 billion, about 11.7x revenue, cheaper than the roughly 13.2x the same math implied a week ago, since the growing cash pile more than offset the equity re-rating. Last week’s line still applies: this is a bet that contracted AI demand outlasts a balance sheet built like a leveraged utility.
Tuesday’s print funded another round of that bet, on better terms than the stock price alone suggests.
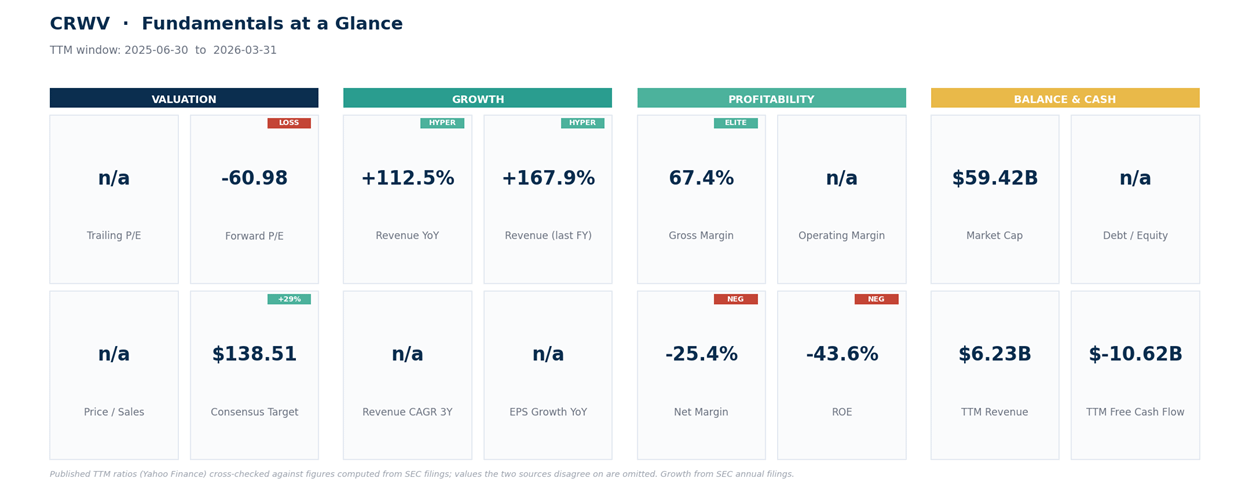
On trailing-12-month revenue of $7.59 billion (up from $6.23 billion pre-print) against the $59.4 billion market cap, the multiple works out to about 7.8x sales, a hair below last week’s 7.9x.
That’s a narrower, more defensible claim than saying the market refused to pay more: trailing multiples reset mechanically as a new quarter rolls in, and this one simply held. The mean analyst target, $138.51 across 38 analysts, is essentially unchanged from last week, still implying nearly 29% upside, but built on estimates the print hasn’t reached yet.
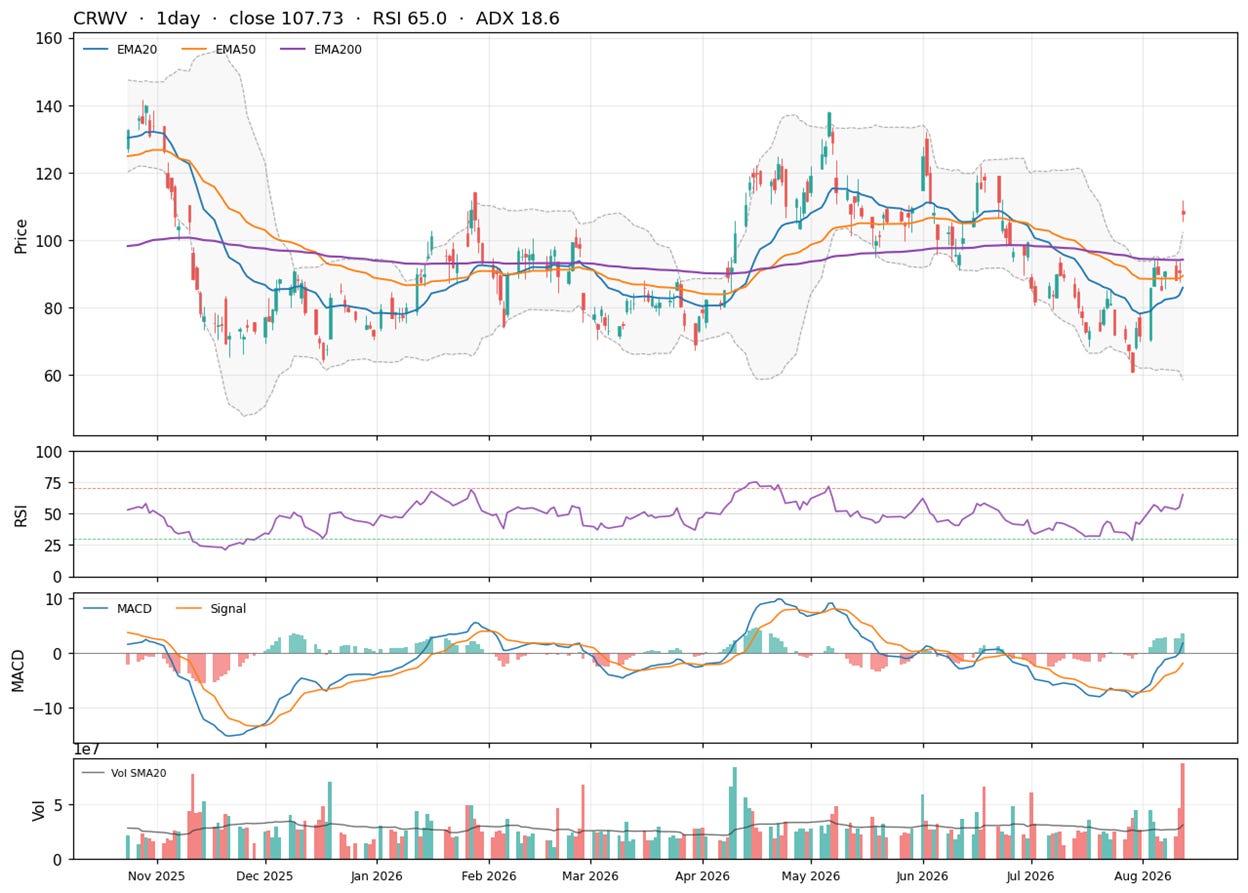
Technical levels below are based on the August 12 close. The stock gapped from Tuesday’s $90.32 close to a $108.70 open and traded as high as $111.82, on volume nearly 3 times average, blowing straight through last week’s $95 breakout trigger and $109 first objective in one session.
Price now sits 14% to 25% above every daily EMA (20-day $85.90, 50-day $89.40, 100-day $93.18, 200-day $94.18), extended and should be read that way; RSI at 65 has room before overbought, but the faster stochastic-RSI reading above 93 says the bounce is stretched short-term. The old $93 to $95 ceiling is now the support to watch, and price spent the entire week before earnings chopping just underneath it, so this isn’t unfamiliar territory to hold.
The business grew into last week’s skepticism on both counts, the good part (guidance, margins, backlog) and the uncomfortable part (a $21 billion larger balance sheet in one quarter). The multiple says it’s roughly a wash; the enterprise-value math says maybe a touch cheaper. The structure says don’t chase the gap, let it come back to test what used to be resistance.
Now the one that broke its own pattern.
NBIS: Growth Decelerated on Schedule, but Profitability Inflected Hard Enough to Matter More
Nebius carried an uncomfortable precedent into this print. In May, Q1 revenue grew 684% and adjusted EPS beat sharply, but the stock held those gains only until DA Davidson downgraded it to Neutral purely on valuation, even while raising its target from $200 to $250, and NBIS fell almost 9% the following Monday on no change to the business. That’s the real risk here: a downgrade needs nothing but a valuation opinion to erase a week of gains. Wednesday didn’t repeat it.
Revenue came in at $582.3 million, up 454% YoY, decelerating from Q1’s 684% on schedule now that the year-ago base has stopped being tiny, and about 46% sequential, itself a step down from Q1’s roughly 75% pace. The headline growth rate slowed on both counts, exactly as the arithmetic demanded. The market rewarded it anyway, because the number that matters more than the growth rate is profitability: adjusted EBITDA swung to a $236.2 million profit from a $21 million loss a year ago, margin jumping from 32% to 41%. The AI cloud segment alone did $575 million of revenue, up 514% YoY, at a $286 million adjusted EBITDA and a 50% margin. Growth decelerated on schedule; profitability inflected hard enough to overwhelm that story.
Management reaffirmed 2026 guidance of $3.0 to $3.4 billion in revenue at roughly a 40% adjusted EBITDA margin. Michael Burry’s short, disclosed 6 days before the print, didn’t step aside; he added to it at $247 the same day the stock closed at $259.20, still underwater on both entries.
His argument is sharper than a generic valuation call: Nebius extended its server depreciation schedule from 4 to 5 years, which he frames as a bet the GPUs decay slower than the roughly 50% annual rate its own deal economics seem to assume. That’s the valuation risk in one sentence, unresolved by this print.
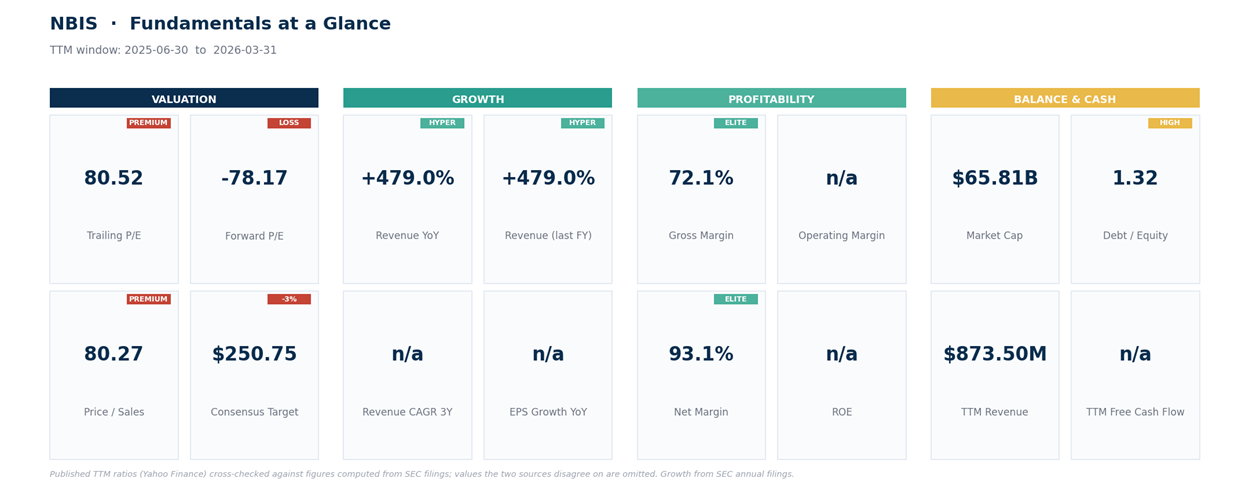
The valuation question is where this quarter’s real news sits. Trailing 12-month revenue is now $1.355 billion against a market cap of $65.8 to $70 billion, depending on share-count convention. Either way the multiple compressed, from 54.4x a week ago to roughly 49x to 52x, because the denominator grew faster than the price. Analyst targets are scattered post-print, from the low $240s to $286 by provider, itself a signal the revision cycle hasn’t settled. Short interest sits near 27% to 28% of float, essentially unchanged, since FINRA’s reporting lags too far behind Wednesday to show any post-earnings covering.
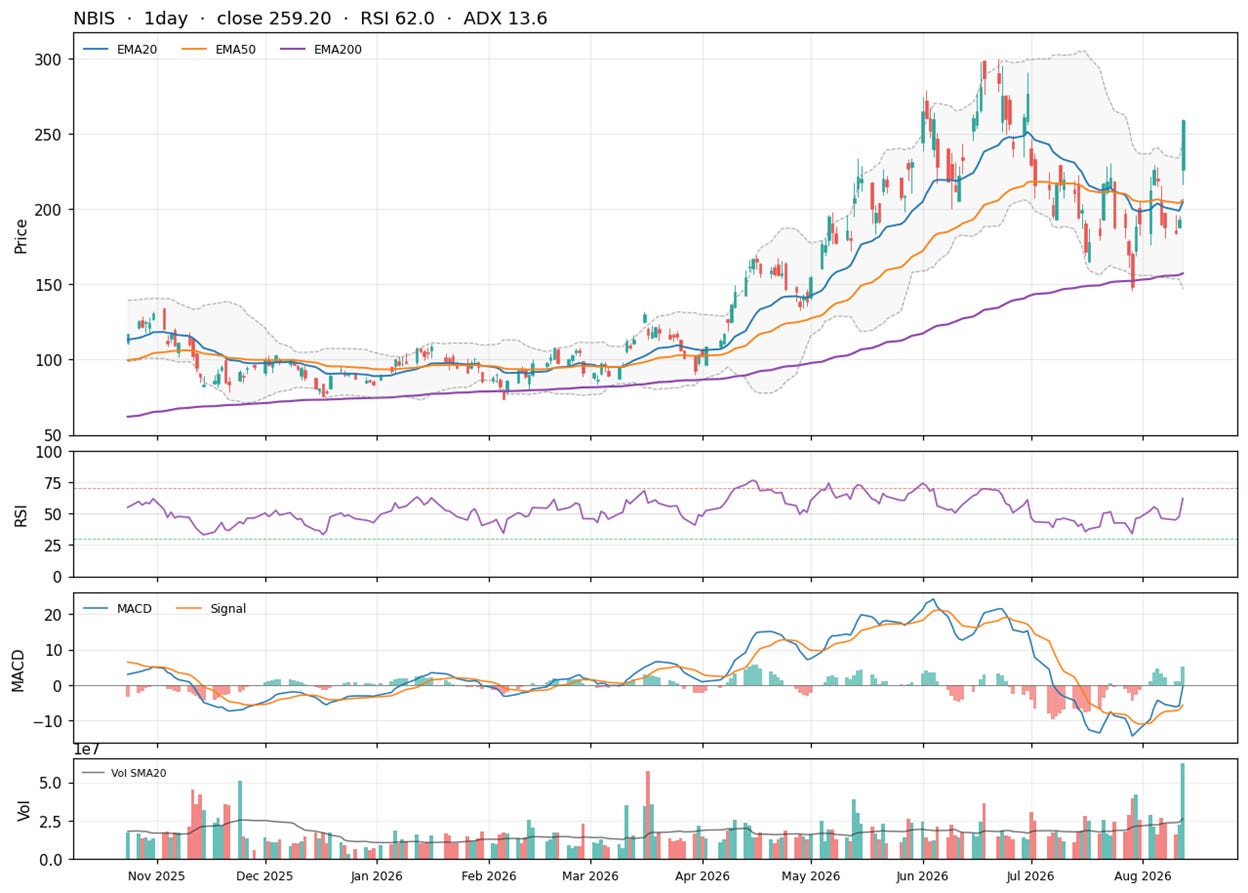
Technical levels below are based on the August 12 close. NBIS gapped from Tuesday’s $193.23 close to a $226 open and traded as high as $259.44 intraday, clearing last week’s entire level ladder, the $207 trigger, the $236 first objective, and nearly the $255 second, in one session. Price is now about 27% above its 20-day EMA ($204.53) and roughly 15% from its $299.86 52-week high.
ADX at 13.6 remains weak, a reminder that one powerful session doesn’t build trend strength, but the buyer-versus-seller readings flipped decisively toward buyers, reversing last week’s near-even split.
Growth decelerated exactly as required, and the market looked past it because profitability inflected hard and the multiple got cheaper doing it. Healthier than the raw 34% headline suggests, but a stock 15% from an all-time high, on an unconfirmed trend, with a credible short seller freshly adding, isn’t one to add to blind. Let it breathe.
What to do with both now.
Post-Earnings Setup
Both level ladders from last week triggered and were exceeded in a single session, so the question now is whether old resistance holds as new support on the first pullback. They’re illustrative levels, not instructions.
CRWV
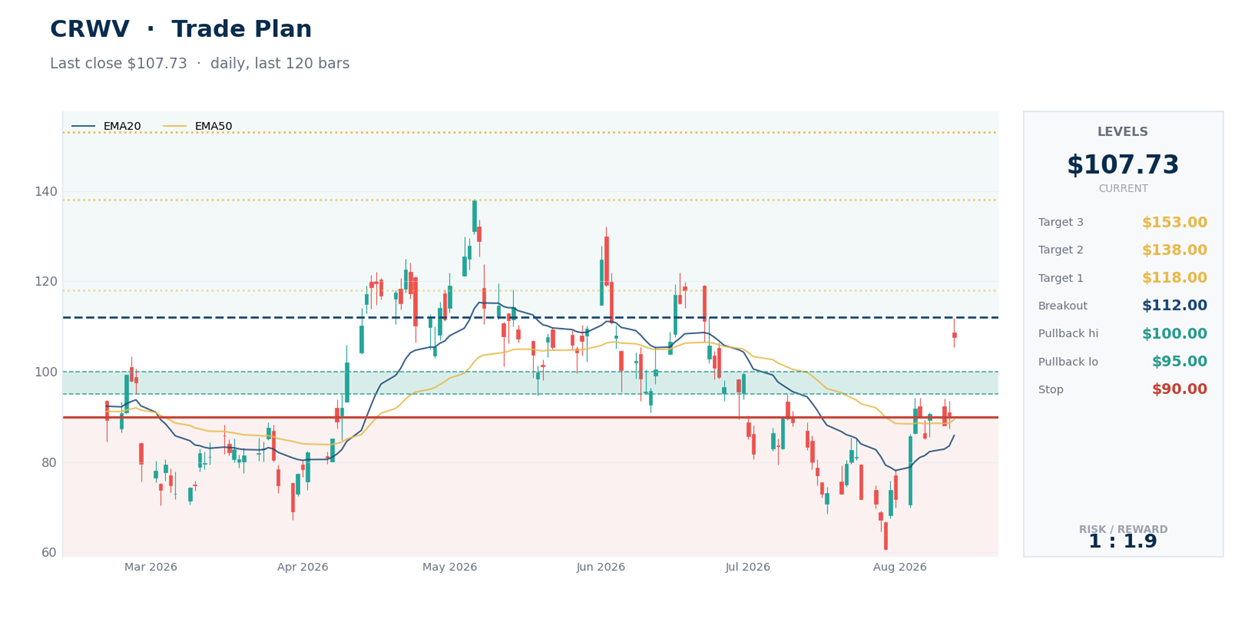
1. Support test: $95 to $100, the former breakout trigger. Holding it on the first pullback confirms the move; failing it wouldn’t erase the quarter, but would say the gap got ahead of itself. Invalidation: a close below $90, which gives back the entire earnings gap.
2. Continuation confirmation: a close above $112, over Wednesday’s high. Objectives: $118 as the first round-number pause, $138 near the spring swing high (almost exactly the $138.51 analyst mean), then $153 at the 52-week high. Invalidation tightens to a close below $105, Wednesday’s low.
3. Estimates aren’t revised yet and the balance sheet is materially larger than a week ago; both the bull and bear case got new evidence, size accordingly.
NBIS
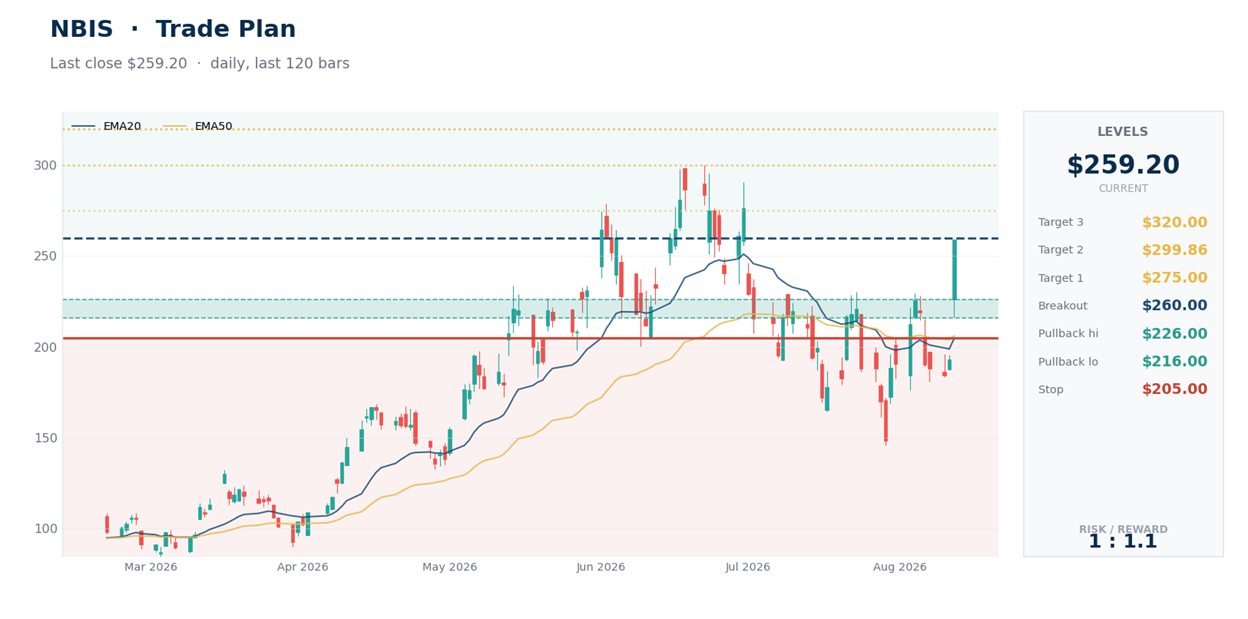
1. Support test: $216 to $226, Wednesday’s low-to-open range and the prior resistance shelf. Invalidation: a close below $205, under the 50-day EMA, erasing most of the re-rating.
2. Continuation confirmation: a close above $260, over Wednesday’s high. Objectives: $275 as a round-number waypoint, then the $299.86 52-week high, with anything beyond untested territory this stock has never traded. Invalidation tightens to a close below $238, roughly Wednesday’s own midpoint.
3. Scattered, fast-moving analyst targets, a still-weak ADX reading, and a credible short seller who just added: that combination argues for patience over chasing the next leg.
Bottom Line
Last week’s frame holds up, but its 2 halves resolved differently.
CRWV proved demand and execution while making its capital structure bigger, not smaller, and its trailing multiple sits almost exactly where it did a week ago, roughly 7.8x sales, with the enterprise-value math suggesting it may even be a shade cheaper once the fresh cash is counted.
NBIS proved growth decelerates exactly as scale arithmetic demands, but profitability inflected hard enough that the multiple compressed, from 54.4x to roughly 49x, despite the bigger headline move. CRWV’s multiple held; NBIS’s got cheaper; both grew into the rally by different mechanisms rather than the market simply deciding to pay more.
CRWV still has to prove its capital structure can outrun its own growth; NBIS still has to prove Burry is wrong about how fast the hardware under 41% margins actually ages. Neither question got answered this week. Both got new evidence, and the price moved to reflect it inside a single session.
This is research and commentary, not personal investment advice. Levels and trade plans are illustrative; size positions to your own risk tolerance and time horizon. The author may hold positions in names discussed.