


Nvidia NVDA 0.00%↑ reports July-quarter results after the bell on Wednesday, and the number it prints is close to settled: the company guided to $91.0 billion and consensus sits near $92.2 billion, roughly 1% above the company’s own guide. It has beaten in each of the last 4 quarters and the stock has fallen after every one. That isn’t a forecast that it falls again. It’s evidence the bar has migrated somewhere else, to the October guide and to whether gross margin survives a memory-cost shock and a product transition at the same time. Those 2 things will decide Wednesday. The reported quarter almost certainly won’t.
Key Takeaways
The October guide is the event, and the line is about $104.2 billion, which would be Nvidia’s first $100 billion quarter. Anything merely in line invites the same reaction as the last 4 prints.
Gross margin near 75% is the durability test. DRAM contract prices rose about 90% in the first quarter of this year and 58% to 63% in the second, and high-bandwidth memory sits inside everything Nvidia ships.
Server prices are already moving. Customers were told last week that systems containing Nvidia chips will cost more than 15% more from early next year, on memory costs.
Options price a 5.4% move, about $280 billion, below the 6.5% implied before May and well under the 7.4% average of the last 12 quarters.
Nvidia is about 8% of the S&P 500. Anyone holding a broad index fund has a position in this report.
Levels and readings below are the Monday August 24 close of $208.48, the last completed session.
Start with what the pattern actually shows.
Beating Stopped Working a Year Ago
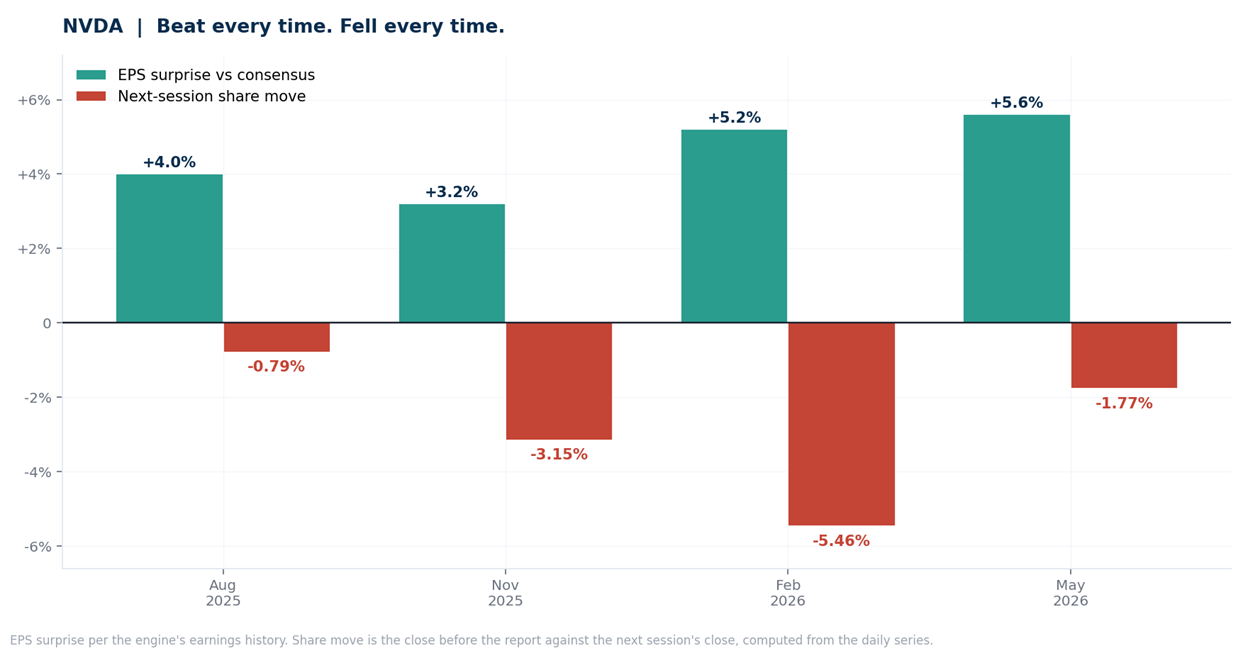
4 consecutive beats, 4 consecutive declines. August 2025: beat 4.0%, fell 0.79%. November: beat 3.2%, fell 3.15%. February, the worst: beat 5.2%, fell 5.46%. May: beat 5.6%, fell 1.77%. The size of the beat has no visible relationship to the reaction.
Read that as a statement about where the hurdle sits rather than a prediction about Wednesday. Backward-looking estimates stopped being the binding constraint some time ago, which is why the most repeated line you’ll see this week, that Nvidia is likely to beat, carries close to no information.
And 4 observations are a pattern, not a probability. The setup is also different this time. Nvidia goes into this print after 7 straight lower closes rather than near its highs, and the options market is asking 5.4% against 6.5% before May and a 7.4% average across the last 12 reports. Less optimism is embedded than in February. The hurdle has moved, and it may also have come down.
The quarter itself.
What They’ll Print
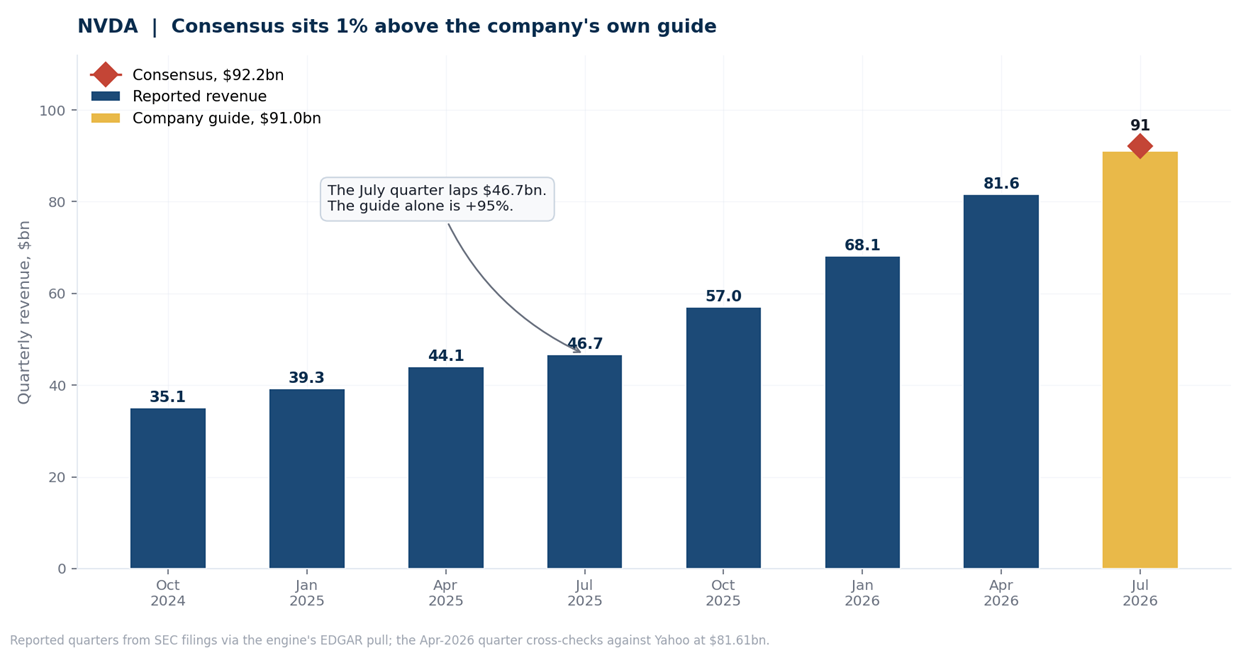
Nvidia guided to $91.0 billion give or take 2%, gross margin of 74.9% reported and 75.0% adjusted, and operating expenses near $8.5 billion. Consensus has crept to about $92.2 billion and $2.09 a share, so the Street is asking for roughly 1% more than management already promised. The quarter laps $46.7 billion, which makes even the guide 95% growth.
Last quarter did $81.6 billion, a figure the filings and the aggregator feeds confirm independently, with data centre at $75.2 billion, up 92% on the year. Operating margin reached 65.6%, up from about 61% 18 months ago. Use operating margin rather than the headline net figure here: reported net income is inflated by $15.9 billion of gains on equity securities in that quarter alone, which says nothing about selling accelerators. Ignore the 49% printed in the April 2025 quarter as a baseline: it carried a $4.5 billion H20 charge and was closer to 59% without it.
Now the 4 things that decide the reaction.
2 Numbers and 2 Narratives
Number 1, the October guide. This is the event, and the line is about $104.2 billion, which would take Nvidia through $100 billion in a quarter for the first time. That number gives you a decision framework rather than a vibe. A guide meaningfully above it forces the Street to revise the forward earnings path higher. A guide that lands on it says Nvidia has not moved that path at all, which is what produced the last 4 reactions. A guide below it says growth is decelerating faster than investors assumed, and nearly 100% growth in the reported quarter becomes irrelevant.
Number 2, gross margin. Management targets the mid-70s this fiscal year. Be precise about where the pressure actually sits, because the popular version of this argument is wrong. Conventional DRAM contract prices rose about 90% in the first quarter of this year and another 58% to 63% in the second. High-bandwidth memory, the kind bolted to the accelerator itself, has not moved like that: TrendForce has HBM3e prices roughly flat to slightly higher in 2026, with the multiple-fold increase expected in 2027 as HBM4 becomes the mainstream generation. So today’s squeeze is at the rack level, in system memory and the rest of the bill of materials, rather than on the chip. The HBM cost step is ahead of Nvidia, not behind it.
That distinction is visible in the pricing. Bloomberg reported on August 22 that contract manufacturers building systems for Microsoft, Google and Oracle have told customers prices will rise more than 15% on systems shipping early next year, on memory costs, covering both Grace Blackwell and Vera Rubin configurations. Somebody is absorbing that, and the release should tell you who. The real question isn’t whether memory inflation squeezes Nvidia. It’s whether Nvidia can hold roughly 75% while ramping a new architecture, shipping ever more complex rack-scale systems, and operating in a supply chain whose component economics are changing underneath it. Hold the margin and it still sets the terms. Slide into the low 70s while revenue is booming and suppliers and customers are starting to take a share. That question outlives Wednesday.
Narrative 1, the Blackwell hand-off. Nvidia said in July that Vera Rubin had reached full production, and names cloud partners running it; Reuters’ preview this week still describes first shipments as an autumn event. The reconciliation matters less than the risk underneath it, which Reuters names directly: this is a hand-off from Blackwell, and any supply hiccup or slower upgrade cycle shows up in guidance fast. Transitions cost margin before they earn it. What matters is whether Rubin extends the cycle or interrupts it.
Narrative 2, China. This has moved and most previews haven’t caught up. Washington changed the licensing rule in January, and for months almost nothing shipped. That’s no longer true: ByteDance and Tencent each took delivery of roughly 10,000 H200s in recent weeks, the first real thaw. But volumes are running near 13% of the licensed ceiling, and the binding constraint is now Beijing rather than Washington, with companies steered to keep most units outside the mainland. Nvidia assumed no China data-centre compute revenue in its outlook, so this is unmodelled upside rather than a free option. It can still move expectations, mix and tone even when it isn’t in the guide.
Why this reaches past the ticker.
The Index Is Long This Whether It Wants to Be
Nvidia is worth $5.05 trillion and is the largest company in the S&P 500 at roughly 8% of the index, ahead of Apple near 7%. The top 10 names are more than a third of it. Anyone who owns a broad index fund has a position in this report and mostly doesn’t think of it that way.
That’s why a 5.4% implied move matters beyond the stock. It represents about $280 billion of market value, more than the entire market capitalisation of about 90% of S&P 500 members, and the correlation into everything else with AI exposure is high.
The macro backdrop is doing its own work. The 30-year Treasury yield touched 5.33% on August 18, its highest since 2007, on inflation that won’t settle, deficits near $2 trillion and foreign holders trimming. Long rates that high compress the present value of earnings arriving years out, and the cheap-looking version of Nvidia’s multiple is exactly that: about 22 times consensus for the fiscal year ending January 2027, falling to roughly 16 times the year after. The 97% growth figure is a single quarter’s year-over-year rate, so don’t set it against a full-year multiple. They measure different things.
What the price says.
The Setup
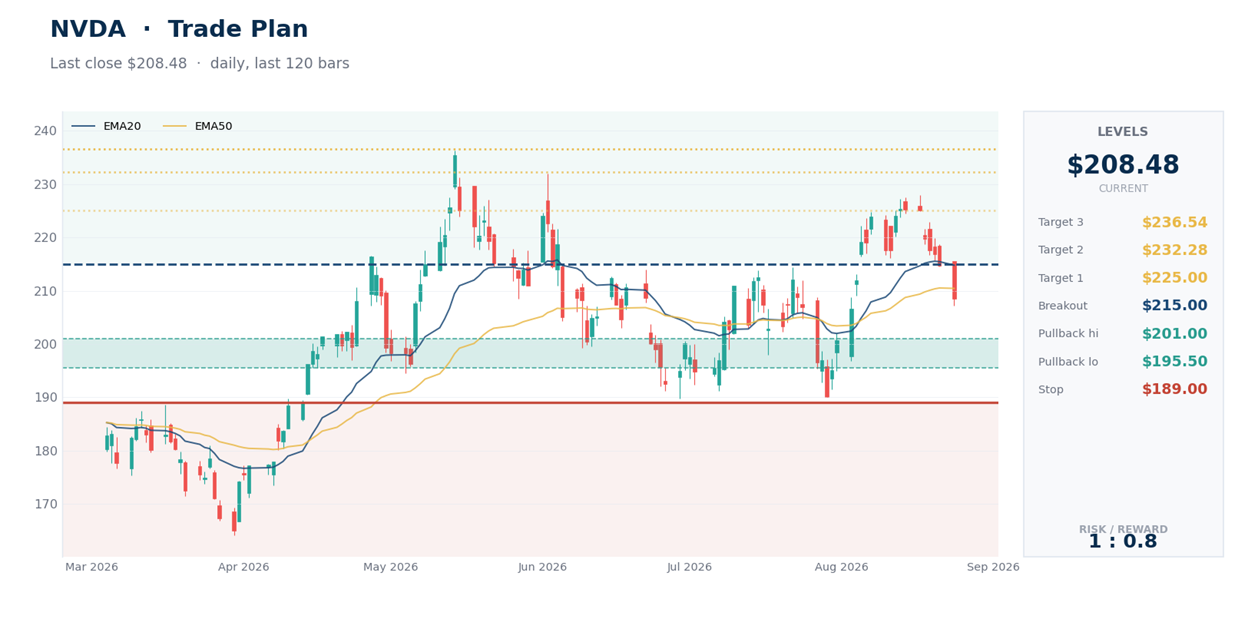
Nvidia sits below its 20-day and 50-day averages at $214.79 and $210.46, above the 100-day at $205.44 and well above the 200-day at $195.72, after 7 straight lower closes and a 7.5% slide from August 13. Sellers hold the directional readings, though ADX near 17 says no trend has established itself, so this reads as de-risking into an event rather than a breakdown. The faster stochastic-RSI gauge is at 1, about as oversold as that reading goes. Average true range is $6.40, roughly 3% of price, so the implied move is under 2 sessions of normal movement delivered at once.
A 5.4% move from Monday’s close is $197.22 or $219.74. The downside sits close to the 200-day average at $195.72 and the 50% retracement at $200.41. That’s a confluence worth noting, not a floor: the implied move describes expected magnitude, not where selling stops.
1. Accumulation: $195.50 to $201, holding the 200-day average and the 50% retracement. Invalidation is a close below $189, beneath the 60-day low at $189.80. From the middle of that zone you risk about $9 to reach $225, roughly 2.9 to 1.
2. Reclaim: a close back above $215, over the 20-day average. Objectives $225, then $232.28 at the 60-day high, then $236.54 at the 52-week high. The geometry is poor, about 0.8 to 1 to the last objective against the same stop, which is the arithmetic version of not chasing a gap up.
3. Not into the print. Implied volatility is elevated because an event premium is embedded in it, which is normal rather than a signal, and it typically collapses afterwards. Buying protection the day before is paying for the event at full price.
Bottom Line
The useful question isn’t whether Nvidia beats. It’s whether an October guide near $104 billion and a gross margin near 75% can both be true at once, because that pairing is what a company still setting the terms of its own supply chain looks like. The 4-quarter losing streak is evidence the market already thinks in those terms; it isn’t a reason on its own to expect a 5th. And something has changed this time: in February the stock went in near its highs, and it goes in now 7.5% off them, with options pricing a smaller move than before May and well under the 12-quarter average. Less optimism is embedded than the pattern implies. If you want to own it, the area where the implied downside and the 200-day average overlap is a more considered place to do that than $12 higher on Wednesday afternoon.
This is research and commentary, not personal investment advice. Levels are illustrative; size positions to your own risk tolerance and time horizon. The author may hold positions in names discussed.