


CoreWeave and Nebius carry nearly the same price tag, $49.5 billion and $47.7 billion, and both report Q2 next week: CRWV on Tuesday, August 11, NBIS on Wednesday, August 12. The matching market caps are misleading, because the risks live in opposite places. CRWV has to grow into its capital structure. NBIS has to grow into its valuation. That’s the sentence everything below has to prove. With roughly one-fifth of CRWV’s float and nearly one-third of NBIS’s reported short, next week’s prints are set up for outsized reactions.

Key Takeaways
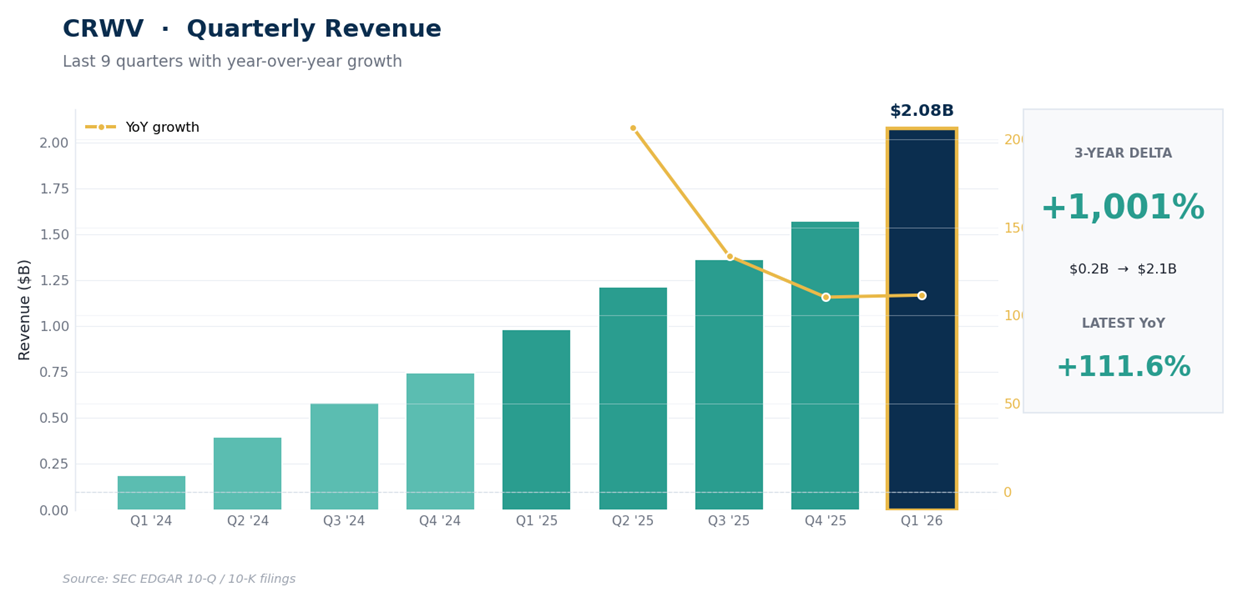
CRWV’s latest reported quarter (Q1, ended March 31) delivered $2.08 billion of revenue, up 111.6% YoY, on roughly $25 billion of funded debt and total obligations approaching $35 billion.
CRWV generates roughly $6 billion of trailing operating cash flow, but capital spending has run above $16 billion, leaving the business dependent on external capital despite that cash engine.
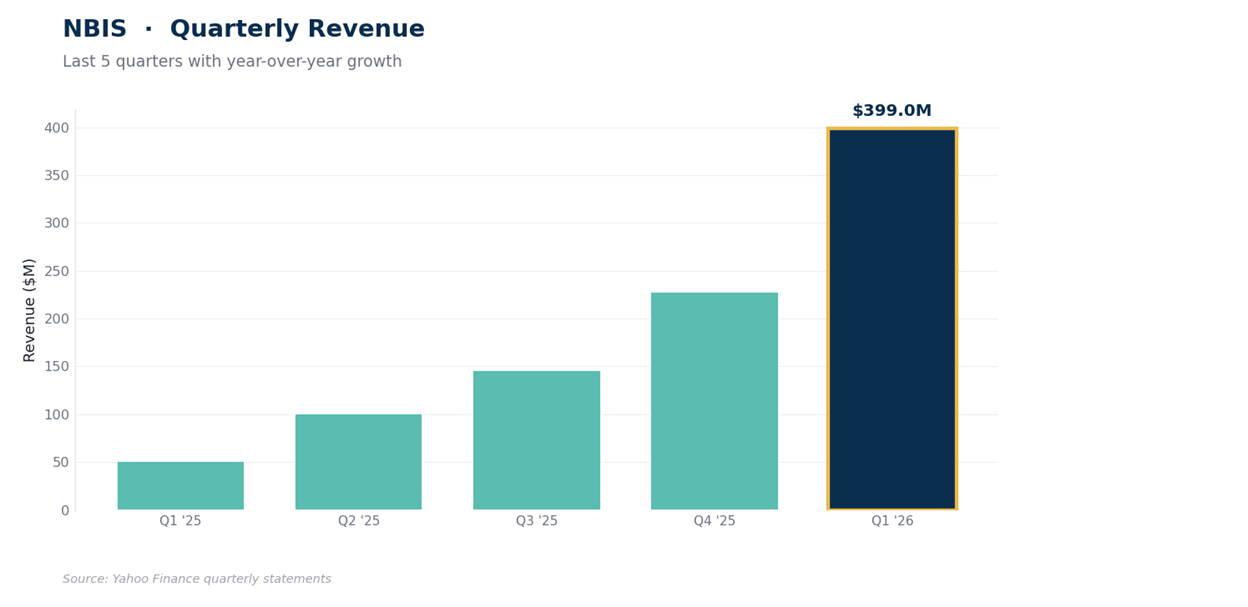
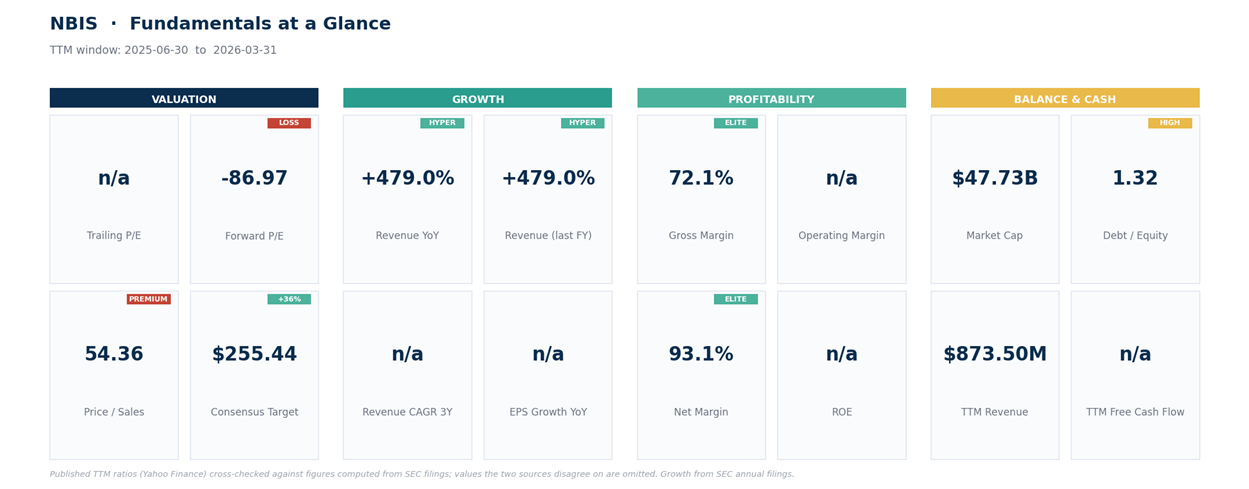
NBIS grew Q1 revenue 683.9% YoY to $399 million, holds $9.4 billion of cash against $9.6 billion of debt, and trades at roughly 7 times CRWV’s trailing-sales multiple.
Latest reported short-interest data show roughly 19% of CRWV’s float and 30% of NBIS’s sold short, and options imply roughly a 13% CRWV earnings move against a daily range near 8%.
Neither stock needs to be chased before the prints. Both sit at well-defined technical decision zones, and earnings will decide which risk the market is willing to tolerate.
The leveraged one first.
CRWV: Scale Now, Balance Sheet Later
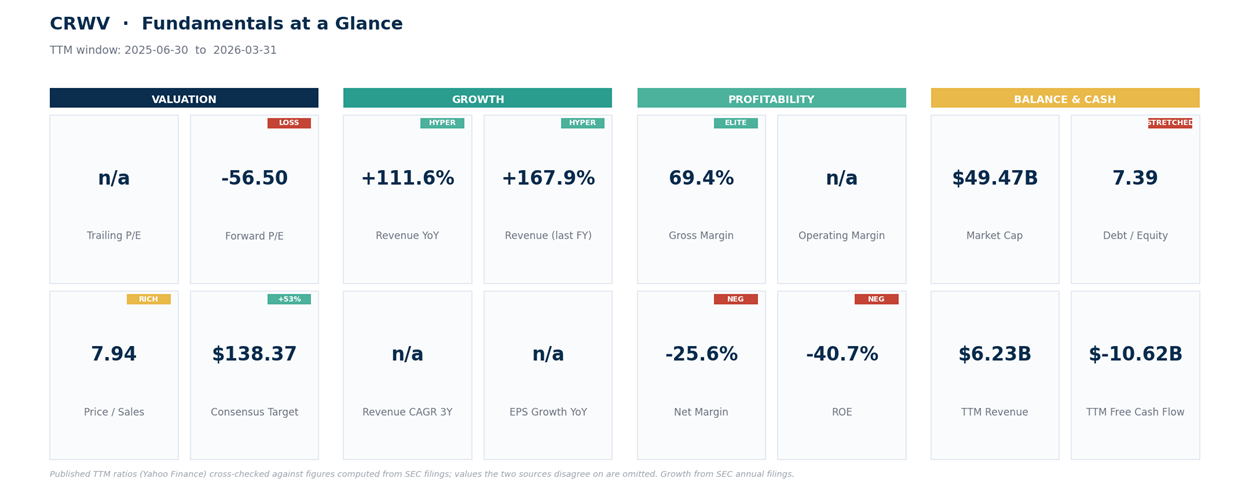
CoreWeave is the scaled one. The revenue arc across the last 9 reported quarters runs from $189 million in early 2024 to $2.08 billion in Q1 2026, an 11x ramp in 2 years, with fiscal 2025 revenue up 167.9% and the latest quarter still growing 111.6% YoY (reported). Trailing 12-month revenue is $6.23 billion at a 69.4% gross margin, and the quarter’s GAAP results still land red: a $144 million operating loss and a $740 million net loss, or $1.40 per diluted share.
The financing behind that ramp is the story. CRWV carries roughly $25 billion of funded debt, with total debt and lease obligations approaching $35 billion, against $2.3 billion of cash and a current ratio of 0.32. The more telling number is the cash-flow gap: roughly $6 billion of trailing operating cash flow against capital spending above $16 billion, which leaves the business dependent on external capital despite enormous operating cash generation.
At 7.9x trailing sales, the multiple looks tame next to Nebius. Analyst targets remain bullish on average, but the enormous ranges on both names, $36 to $303 here, underline how unsettled the terminal economics remain, and it doesn’t help the mood that a CEO stock sale of $28.2 million rounds out the pre-earnings headlines. What Tuesday needs to show is simple: revenue holding triple-digit growth, and evidence that new capacity keeps getting contracted before it gets financed.
This is a bet that contracted AI demand outlasts a balance sheet built like a leveraged utility.
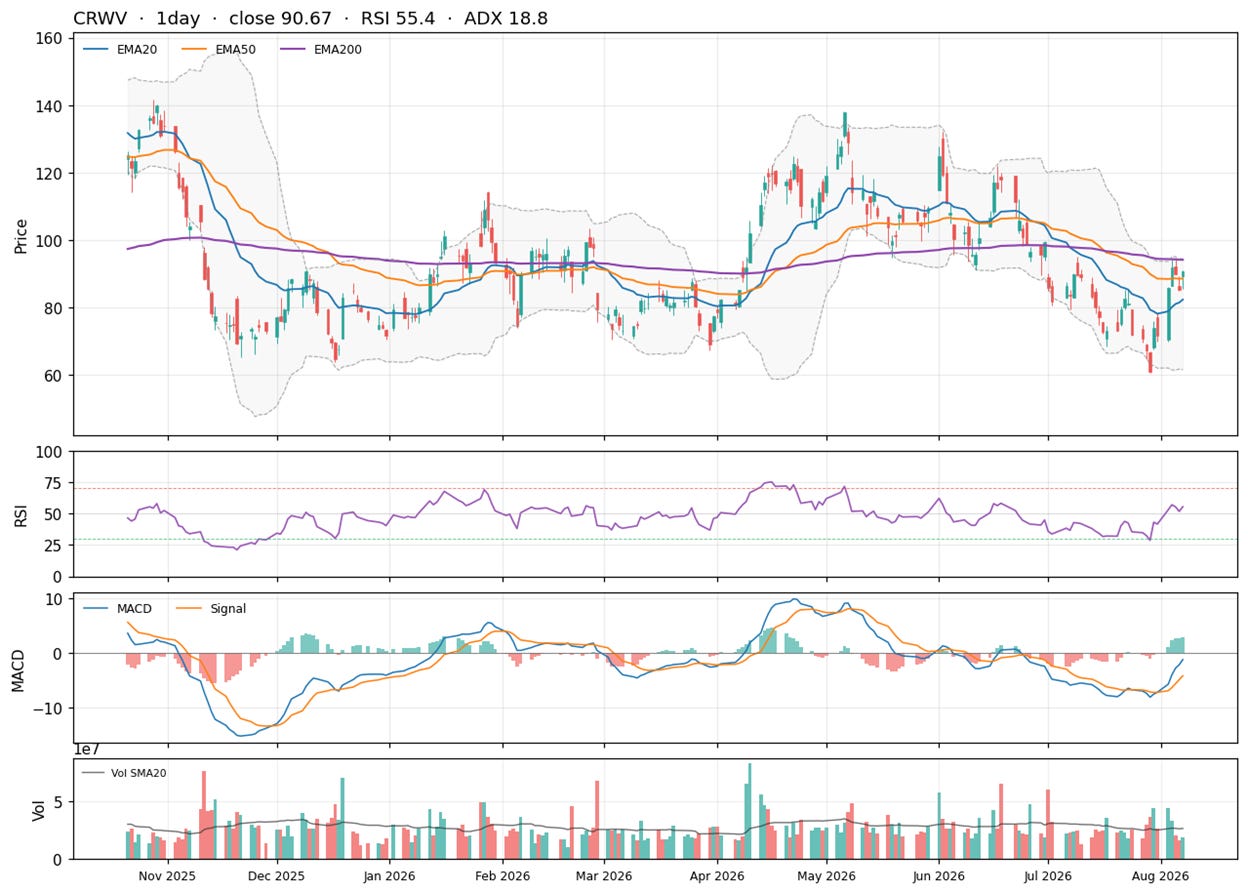
Technical levels here and below are based on the August 7 close. From a June high near $132, CRWV lost more than half its value to a $60.55 low, and the rebound to $90.67 has reclaimed the 20-day EMA at $82.33 and the 50-day at $88.60.
Momentum has improved, with the MACD line at -1.16 back above its signal at -4.13 and the downside momentum from June now fading, but price is pressing directly into the $93 to $95 ceiling formed by the 100-day EMA, the 200-day and the upper Bollinger Band, while ADX at 18.8 says no new trend has formed yet.
An average true range of $7.58 is about 8% of the price in an ordinary day; it’s the kind of number that says Tuesday’s report can overwhelm every level on the page overnight.
The business is executing. The equity remains a leveraged claim on that execution. And 3 days before earnings, price has rallied directly into the zone where that tension gets tested.
Now the expensive one.
NBIS: A Cash-Rich Balance Sheet at a Nosebleed Multiple
Nebius is the inverse, and one sentence carries the whole section: the balance sheet has bought Nebius time; the valuation has removed its margin for error. The growth is even steeper, revenue of $50.9 million, $100.7 million, $146.1 million, $227.7 million and $399 million across the last 5 quarters, a 683.9% YoY jump in Q1 and 479% for fiscal 2025.
The reported $621 million GAAP profit overstates the underlying business, though. It was driven primarily by a roughly $781 million revaluation gain tied to ClickHouse, while the operating line still lost $128 million. The dashboard’s 93.1% trailing net margin deserves the same asterisk.
The time comes from liquidity: $9.6 billion of total debt almost fully offset by $9.4 billion of cash, with a current ratio of 8.3. That liquidity is real, but it shouldn’t be confused with internally generated free cash flow; recent customer advances and external financing contributed materially to the cash build.
The missing margin for error is the multiple: 54.4x trailing sales on about $0.87 billion of trailing revenue. Side by side, the pair reduces to one line: similar market cap, one-seventh the trailing revenue, roughly 7 times the sales multiple. The bull case is that the sequential ramp (+75% quarter-over-quarter in Q1, at a 72.1% gross margin) compounds into that multiple within quarters, and what Wednesday needs to show is equally simple: another steep sequential step, because at this valuation deceleration is the event.
Positioning adds the accelerant. Roughly 30% of the float is sold short per the latest reported data, some of which may reflect convertible hedging rather than outright bearish positioning, and Michael Burry has disclosed a bearish NBIS position, adding a high-profile skeptic to an already crowded setup. The stock is still up 167.6% over 12 months against 21.7% for the S&P 500, so plenty of momentum capital sits on profits it may want to protect into Wednesday.
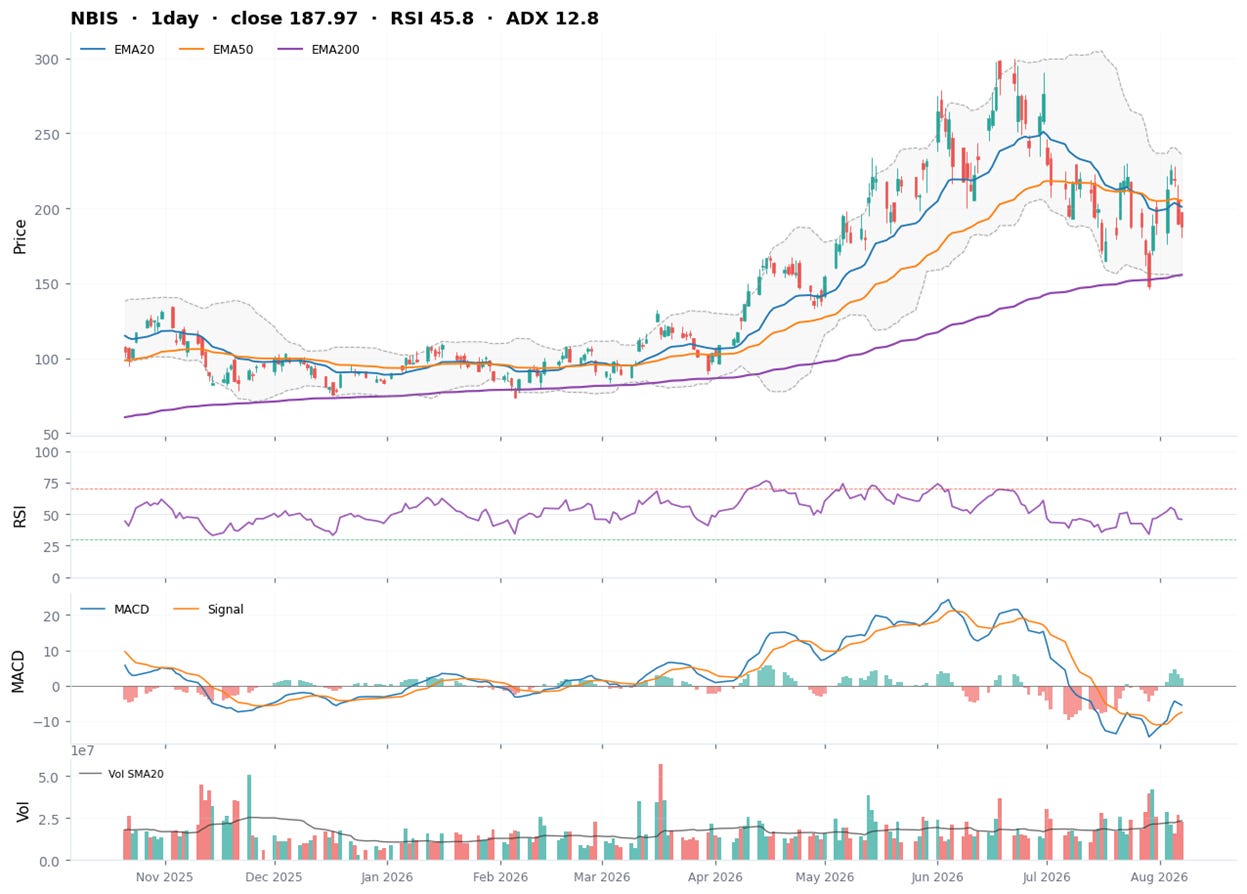
The price structure is a stock still digesting a blowoff. From a $299.86 June high, NBIS fell 51% to $145.80 in July and now sits at $187.97, below its 20-day EMA at $200.96 and 50-day at $205.06, resting right on the 100-day at $188.42, with the 200-day far below at $155.56.
The MACD line at -5.54 holds above its signal at -7.58, so the decline is decelerating rather than accelerating, but ADX at 12.8 shows there’s effectively no trend to lean on, and a daily average true range near $25, about 13% of the price, is the kind of volatility that turns ordinary position sizes into oversized ones. That’s the backdrop 4 days before the print.
The growth is real and the liquidity is substantial. But at more than 50x trailing sales, growth itself is the margin of safety. Wednesday decides how much of that growth the market is still willing to prepay.
How to act on it.
Post-Earnings Setup
The honest plan for both names is the same shape: let the reports pick the setup. Any pre-earnings exposure carries materially higher gap risk than a post-confirmation entry, and pre-positioning means accepting binary catalyst risk before price has resolved direction. They’re illustrative levels, not instructions.
CRWV
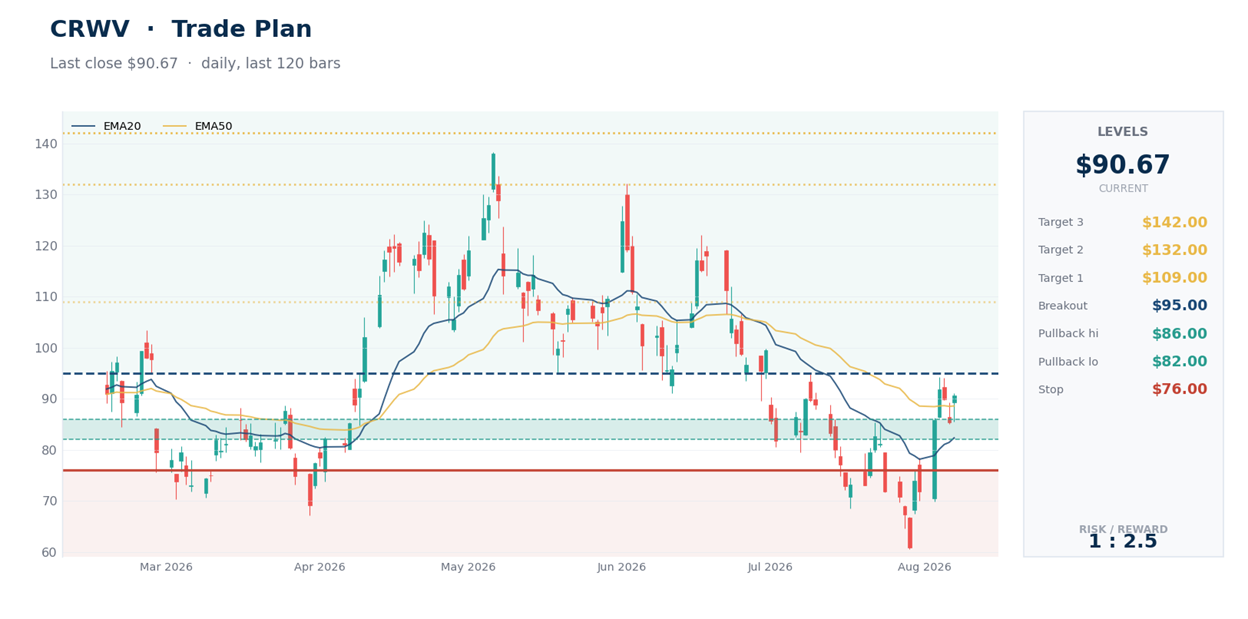
Pullback setup: $82 to $86, around the 20-day EMA and this week’s support. Invalidation: below $76, under the mid-Bollinger shelf at $78.
Breakout confirmation: a daily close above $95, clearing the 100-day, 200-day and upper-band cluster in one move. Objectives: $109 (a computed retracement shelf sits at $108.57), then the $132 June high, then approximately $142 at the consensus median.
Options imply roughly a 13% earnings move against an 8% ordinary day; assume Tuesday redraws the level structure.
NBIS
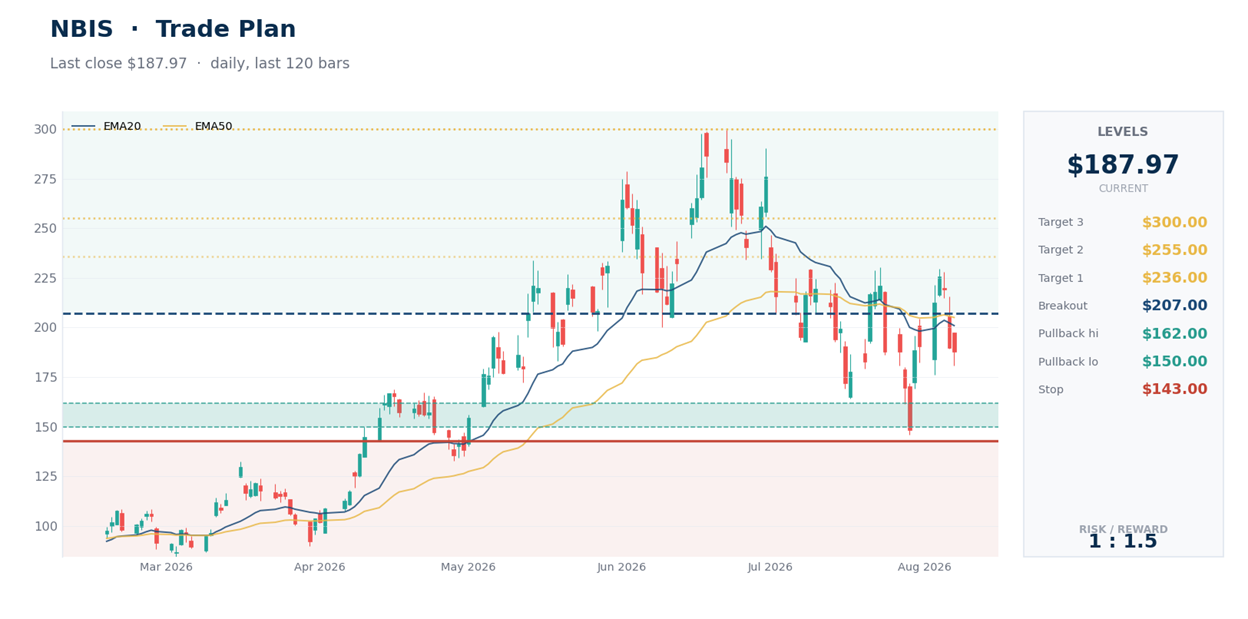
Pullback setup: $150 to $162, around the 200-day EMA and the July support zone above the $145.80 low. Invalidation: below $143, which reopens the air pocket beneath.
Reclaim confirmation: a daily close above $207, back through the 20-day and 50-day EMAs and the daily pivot resistance. Objectives: $236 at the upper band, $255 at the consensus median, then approximately $300 at the June high.
Into Wednesday, patience is a position here.
Bottom Line
If forced to own one through earnings, I still prefer CRWV. Not because the balance sheet is safer, it clearly isn’t, but because the valuation already embeds considerably more skepticism and the revenue base is proven at scale. That discount exists for a reason: CRWV’s capital intensity leaves far less room for financing stress than the sales multiple alone suggests. The cleaner setup is to let earnings determine which thesis earns confirmation rather than requiring either thesis to work beforehand. Same price tag, opposite risks. CRWV must prove that demand and financing can support its capital structure. NBIS must prove that growth can catch its valuation. One has to grow into its liabilities; the other has to grow into its price.
This is research and commentary, not personal investment advice. Levels and trade plans are illustrative; size positions to your own risk tolerance and time horizon. The author may hold positions in names discussed.