


Costco reported its fiscal year after Thursday’s close. Net sales rose 10.1% to $297.2 billion, comparable sales grew 6.6% excluding fuel and currency, earnings per share rose 14% to $20.76, and free cash flow rose 19.8%. In the 16-week fourth quarter, US comparable sales ran at 7.2% on the same adjusted basis.
The market spent Friday morning arguing with itself about it. The stock opened lower at $886.62, fell to $883.10, below the September low, then reversed all of it and reached $921.70. Around midday in New York it sits near $918, up about 2.4% from Thursday’s $896.48 close and 16.1% below its May high.
Those results answer one question well and another not at all. They tell you the operating model isn’t breaking. They can’t tell you what the shares are worth, and that is what the last 4 months have been asking.
Key Takeaways
Membership fees of $5.91 billion were 50.6% of reported operating income, which is not the same as saying half the profit is a subscription.
The tidy explanation, that investors rotated out of expensive retailers, doesn’t survive measurement. Across 20 names ranked on what they actually cost in May, the rank correlation with what followed is minus 0.21.
At about 44 times the year just reported, Costco is on its lowest trailing multiple since January 2024. It is still dearer than 37% of the past 5 years.
Fee income grew 11.0% for the year but only 7.3% in the fourth quarter, because the 2024 price increase has lapped. That belongs in the bear case.
Prices below are Friday intraday unless stated. The peer and valuation history end at Thursday’s close, the last session before these results, and are labelled where they appear.
Where the Money Comes From
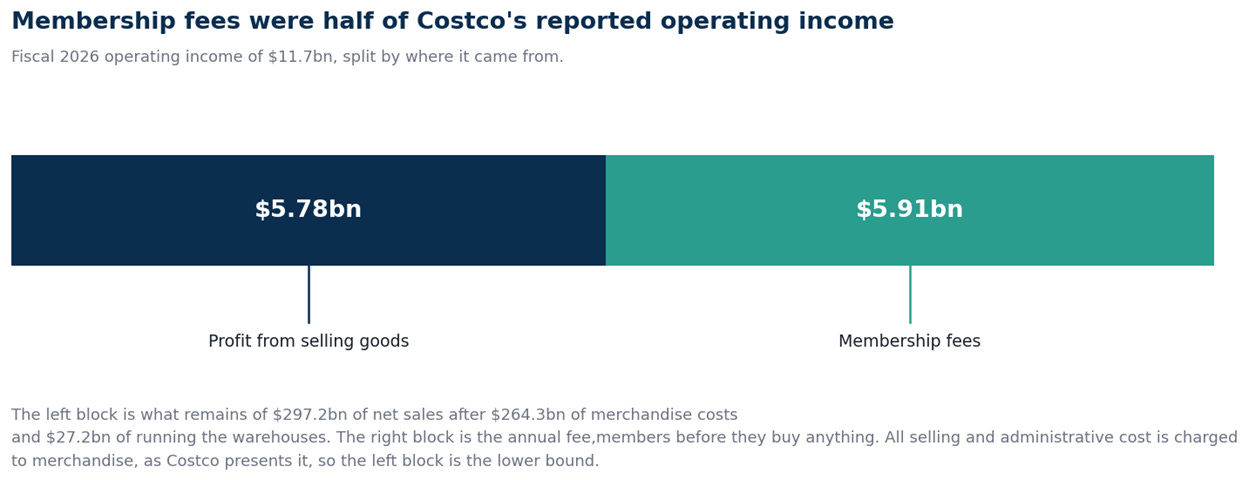
Costco sold $297.2 billion of merchandise last year. After $264.3 billion of buying it and $27.2 billion of selling and administrative cost, $5.78 billion was left. Membership fees were $5.91 billion, which is 50.6% of the $11.69 billion of operating income.
Be careful with what that does and doesn’t establish. Costco charges all of its selling and administrative cost against merchandise, so the $5.78 billion is a lower bound and the split is a reporting convention, not a measurement. The warehouses are part of what the fee buys. There is no separately reported subscription profit, and anyone telling you half of Costco’s profit is a subscription is reading a presentation convention as a segment disclosure.
What survives is still worth having. A fee of $5.91 billion arrives from 84.1 million paid members before anything is scanned, while the retail operation converts $297.2 billion of sales into a 1.9% margin. The renewal rate rose to 89.8%, and executive members, who pay double, grew 9.4% to 42.3 million.
Payables of $22.6 billion exceed inventories of $19.3 billion, so suppliers fund the entire stock and then some, and Costco converts 102% of net income into free cash flow. Growth is 25 net new warehouses, from 914 to 939, plus 6.6% adjusted comps.
The Explanation That Didn’t Hold
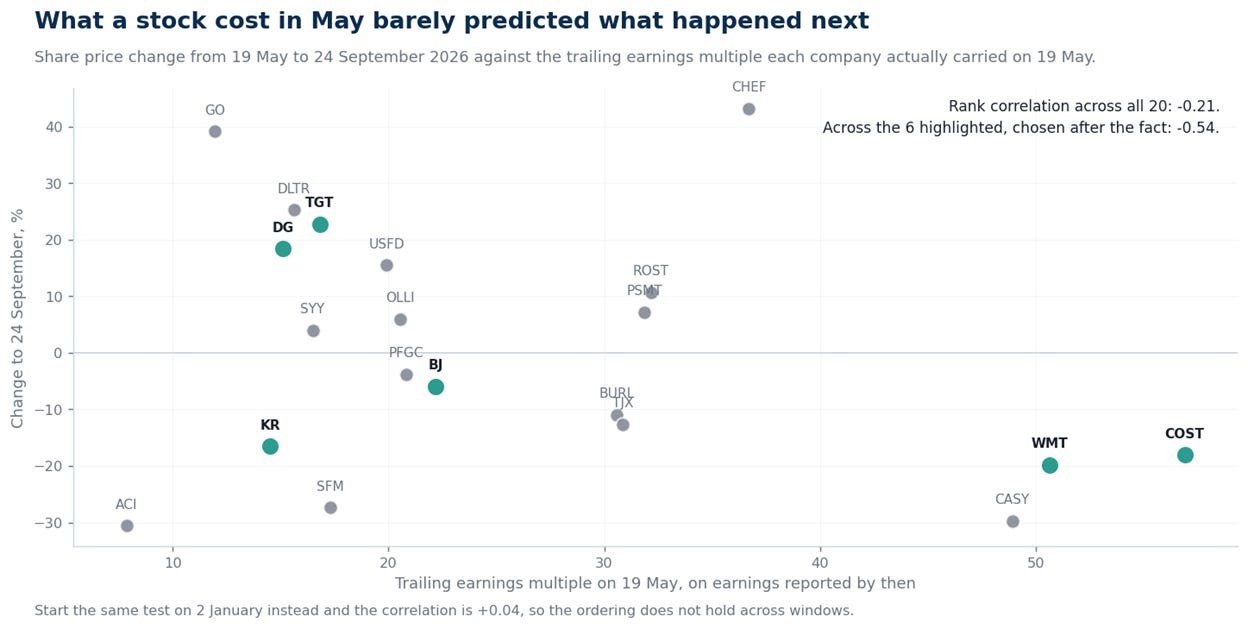
Here is a story I nearly published. Measure the big retailers from Costco’s May 19 peak to Thursday. Walmart fell 19.8%, Costco 18.1%, Kroger 16.5% and BJ’s 6.0%, while Target rose 22.7% and Dollar General 18.4%. Rank those 6 by earnings multiple and the outcomes run almost exactly opposite: investors sold the expensive ones. Tidy, and I was ready to lead with it.
The test is fussier than it looks. Ranking on today’s multiple is circular, because a stock that fell 30% is cheap now precisely because it fell, so the ranking has to use each company’s trailing earnings as actually reported by May 19. Vendor trailing figures won’t do either: Kroger’s real May multiple was 14.5 times, not the 31 its current number implies, and Albertsons was 7.9 times, not 73.
Done that way, across 20 US retailers and distributors, the rank correlation between what a stock cost in May and what happened to it since is minus 0.21. Across the 6, it’s minus 0.54, well short of the minus 0.89 the first cut suggested. Start the same test on January 2 and the correlation is plus 0.04.
The scatter is the real finding. Casey’s was on 49 times in May and fell 30%, but Albertsons was on 8 times and fell 31%. Chefs’ Warehouse was on 37 times and rose 43%, Grocery Outlet on 12 times and rose 39%. Costco’s decline fits a spring stretch in which the expensive half of this group lagged the cheap half by about 10 points, but that gap reverses if you start in January, and the ordering is too scattered to say how much of Costco’s move came from it.
So I can’t explain the de-rating, and I’d rather say that than sell a pattern that dissolves when you measure it properly. The basket is COST, WMT, TGT, KR, BJ, DG, DLTR, ACI, SFM, CASY, PSMT, SYY, USFD, PFGC, CHEF, OLLI, GO, BURL, ROST and TJX. Returns are closing prices, May 19 to September 24.
Costco’s reported operating data do not show a consumer breakdown. US adjusted comps ran at 7.2% in the quarter against 6.6% for the year, with digital up 19.8% and renewals higher, at a retailer serving 150.4 million cardholders. That is evidence of resilience rather than proof that nothing changed in how people shop.
What You Actually Pay
Near $918 Costco is worth about $407 billion. Cash of $20.2 billion plus short-term investments of $1.1 billion less debt of $6.2 billion is $15.1 billion of net cash, which takes the enterprise value to roughly $392 billion. Subtract the reported long-term operating lease liability of $2.4 billion and that net figure becomes $12.7 billion, though that adjustment covers the long-term line only, not every lease obligation. That’s 44.2 times the year just reported and 33.5 times operating income, on a free cash flow yield of 2.3%.
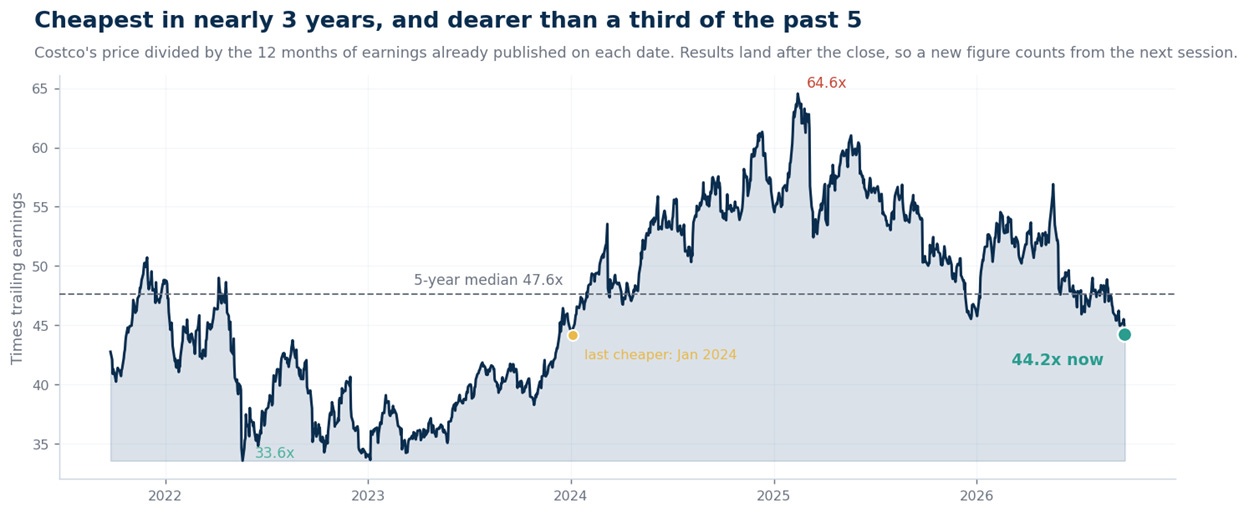
Now put it in its own history. For each session I divide the closing price by the 4 most recent quarterly earnings per share Costco had already published, counting a new figure only from the session after it lands, because these results arrive after the close. On that basis Costco has spent 5 years between 33.6 and 64.6 times, with a median of 47.6.
Worth being careful here. Thursday’s market was still working with $19.88 of trailing earnings, so the observed multiple into the print was 45.1 times, and only the release itself dropped it. Today’s 44.2 is the lowest reading since January 4, 2024, which is to say in nearly 3 years, and still dearer than 37% of the sessions in that 5-year window. The stock got meaningfully cheaper than it has been through its whole recent run, and it did not get cheap.
At the May peak of $1,094.32, against the $19.23 of trailing earnings reported by then, the shares were at 56.9 times. Measured against the year they turned out to deliver, that peak was 52.7 times. The multiple compressed more than the share-price decline alone suggests, because trailing earnings rose from $19.23 to $20.76 over the period.
The Case Against Me
The bull case doesn’t need the multiple to expand. It needs it to stop falling.
Costco has a long record of resilient renewals and rising executive penetration, a strong net-cash balance sheet, and capital spending of 2.2% of sales while still adding 25 warehouses a year.
Against that, 2 things. The fee line is slowing: 11.0% for the year but 7.3% in the fourth quarter, because the increase that took effect in late 2024 has now fully lapped. From here the subscription compounds at the rate members are added, not the rate prices rise, and membership economics are central to the premium investors pay. And a de-rating from 57 times to the low 40s has no obvious floor, because nothing I can measure identifies what drove it.
The tariff line shows the model working as designed. The quarter carried a $0.15 per share benefit from IEEPA tariff refunds, which Costco says it partly reinvested in lower member prices rather than keeping. That is what a company does when it treats the fee as its return and the goods as the service. It’s also why the shareholder’s claim is thinner than the quality suggests.
The Setup
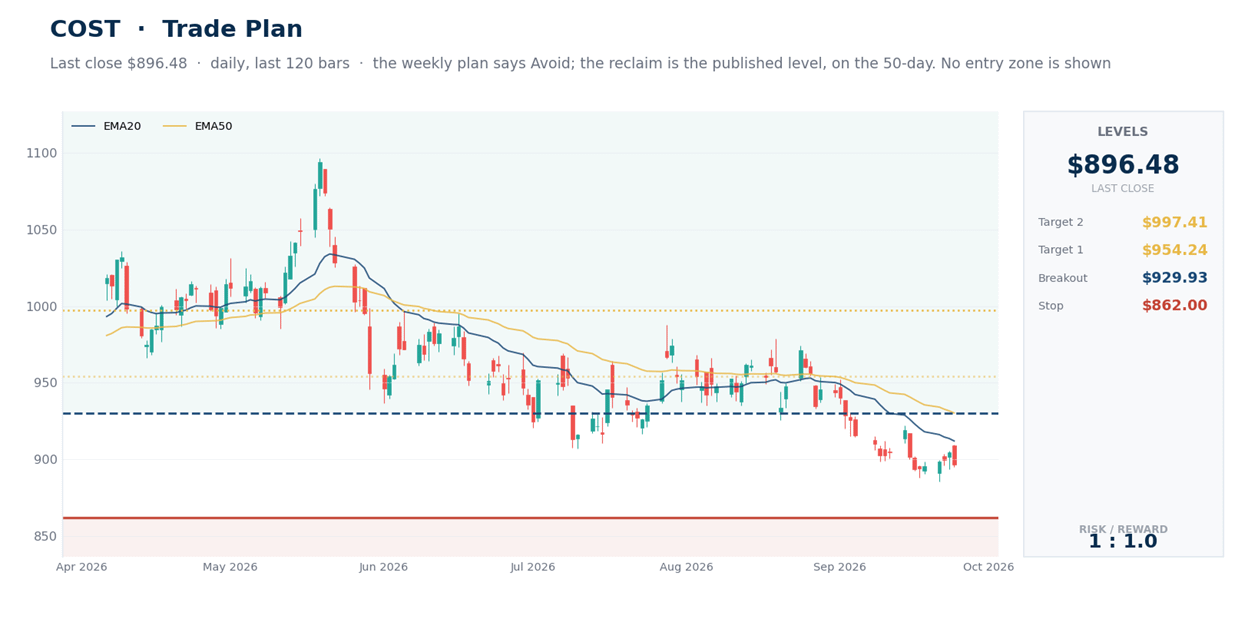
Costco is in the weekly plan I publish: regime Breakdown, reclaim above $929.93, status Avoid. That plan is dated September 12 and no newer one has been issued.
1. The trigger has not been hit, so the instruction stands. Thursday closed at $896.48, under the $898.43 level the plan flagged. Near $918 the stock has recovered above its 20-day average at $911.97 but remains below the 50-day at $930.25 and the 200-day at $954.24. Thursday’s 14-day relative strength reading of 38 and trend strength reading of 18, which signals a weak trend rather than a strong one, described a drift, not a washout.
2. This morning changed the downside reference. The $883.10 low undercut the September 21 low of $885.50 and was bought back within the session, the first thing this stock has done in 4 months that isn’t simply lower. Below it, the next reference is the December low at $844.06.
3. The level that matters is the published $929.93, on the 50-day average. It is about $12 away, or 0.9 times the $13.71 average daily range, against 2.4 times on Thursday.
4. Even the trade the plan allows isn’t generous yet. Buy the reclaim at $929.93 while treating $862.00 as the invalidation and you’re paying about 1 to 1 to the June high at $997.41. That ratio is part of why the instruction is wait rather than buy the trigger.
5. Bidding below the September low is a different trade from the one I’ve published. This morning it would have worked. It isn’t what the plan says, so I won’t dress it up.
Bottom Line
Costco delivered one of its better years, and Thursday’s release gives you very little evidence of an operating breakdown.
That is narrower than it sounds, because most of the 18% decline happened before Thursday, and results published this week cannot explain 4 months of price action that preceded them. The rotation out of expensive retailers that would explain it is too weak and too unstable to carry the weight. I’d rather say so than invent a cause.
What’s left is a valuation question you have to answer on its own terms. Earnings growth and a 4-month fall have taken a genuinely exceptional business to its cheapest multiple in nearly 3 years, and 44 times trailing earnings still leaves very little room for disappointment. The results settled the case against the business. They didn’t settle the case against the price, and until $929.93 goes, the weekly plan still says wait.
This is research and commentary, not personal investment advice. Levels are illustrative; size positions to your own risk tolerance and time horizon. The author may hold positions in names discussed.