

CHAPTER 1: The Ocean Beneath the Charts
Imagine the market is an ocean.
Every price move is a wave. Traders get swept up, dragged under, or - if they know what to look for - ride it like a pro.
That’s the promise of Elliott Wave Theory.
It’s not about guessing every tick. It’s about spotting the structure beneath the chaos.
Impulse. Correction. Emotion. Psychology.
These waves repeat - over and over - because human behavior repeats.
NOTE ON DIRECTION: Bull or Bear?
Before we dive into wave types, here’s something most beginners miss:
Waves don’t always move up.
Elliott Wave describes trend structure- regardless of direction.
In a bull market, the 5-wave impulse is up, and the 3-wave correction is down.
In a bear market, the 5-wave impulse is down, and the 3-wave correction is up.
Same structure. Flipped psychology.
We’ll walk through both.
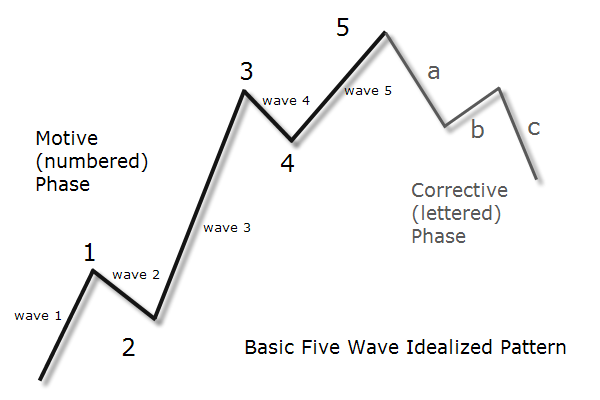
CHAPTER 2: The Impulse – 5 Waves of Emotion
The impulse is the core move—5 waves with the dominant trend.
In a Bull Market, it looks like this:
Wave 1 – The Spark
Smart money moves in. The market rises, quietly. Most traders ignore it.Wave 2 – The Doubt
Pullback. “Another fakeout,” they say. But price doesn’t break down.Wave 3 – The Explosion
Momentum surges. Fundamentals “improve.” Everyone jumps in.Wave 4 – The Pause
Choppy. Sideways. Traders get nervous. Weak hands exit.Wave 5 – The Euphoria
“This will never stop.” Volume fades. RSI diverges. But price pushes one last time.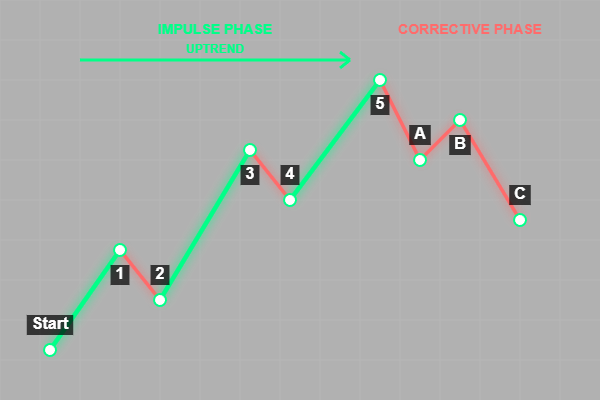

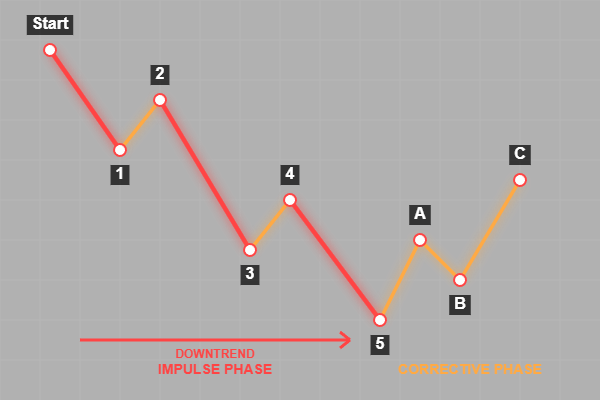
In a Bear Market, it’s the same emotions—in reverse:
Wave 1 – The Crack
Selling begins. Smart money exits. Few notice.Wave 2 – The Bounce
Hope returns. “That was the bottom.” It’s not.Wave 3 – The Panic
Broad selling. Bad news hits. Fundamentals now match price.Wave 4 – The Sucker's Rally
A sharp bounce. People want to believe. They get trapped again.Wave 5 – The Washout
Capitulation. Despair. No buyers left. Oversold… but no one cares.
CHAPTER 3: The Correction – 3 Waves of Psychology
After every 5-wave impulse, the market needs to breathe out. This is the A-B-C correction.
In Bull Markets (correction moves down):
Wave A – First hit. “Buy the dip” works… but it’s weaker.
Wave B – Bounce. “New highs coming!” But internals are weak.
Wave C – Drop. Pain. Stops hit. Then… stabilization.
In Bear Markets (correction moves up):
Wave A – The bounce. “The worst is over.”
Wave B – Pullback. Confusion. Still bearish sentiment.
Wave C – A sharp rally. Feels like recovery… but it’s just a breather.
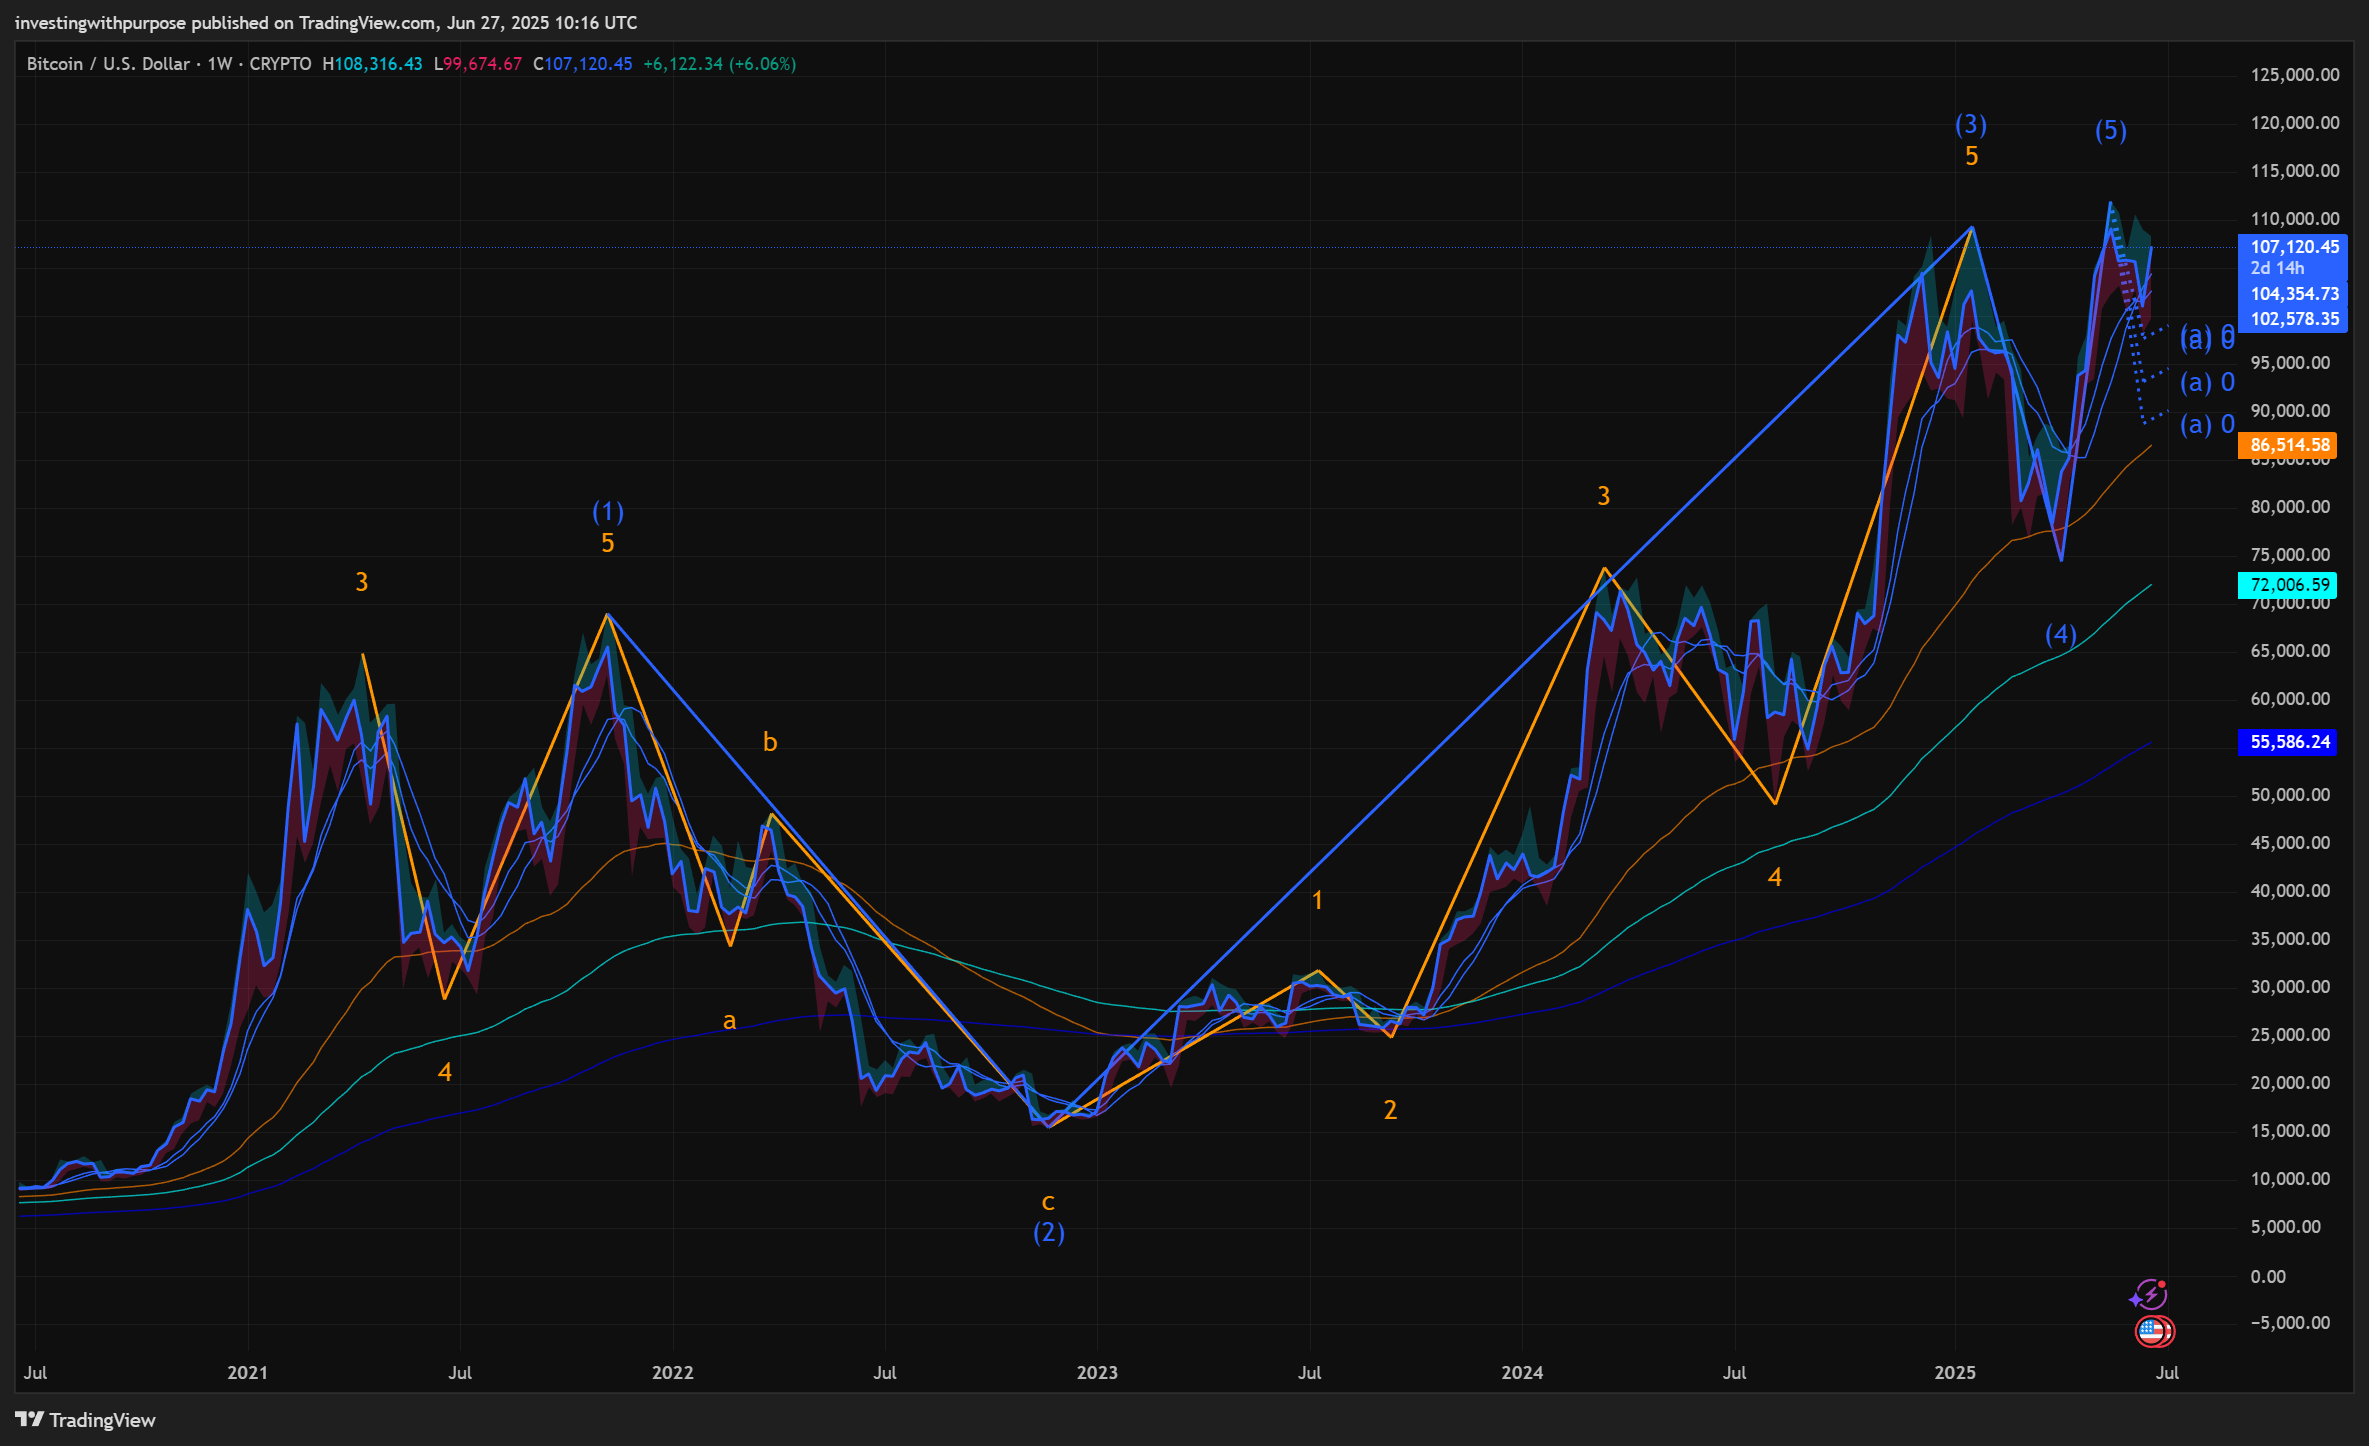
CHAPTER 4: Fractals – Waves Within Waves
Elliott Waves are fractal.
Every wave you see contains smaller waves inside it. Zoom out, and you’ll find that same pattern repeating on larger timeframes.
A Wave 3 may contain 5 smaller waves.
That Wave 3 might itself be part of a larger Wave 1 on the weekly chart.
This is where Elliott becomes powerful - but also messy.
Example: Bitcoin 5 year chart
CHAPTER 5: Tools of the Wave Rider
Waves aren’t magic - they’re probabilistic. To trade them effectively, combine them with:
Fibonacci:
Wave 3 often extends 161.8% of Wave 1.
Wave 2 often retraces ~61.8%.RSI/MACD:
Use to confirm momentum in Wave 3.
Divergence? Could mark Wave 5 or C tops/bottoms.EMAs:
Wave 1 often breaks through the 21/55 EMAs.
EMA flips confirm trend transitions.
Use these tools to validate - not force - your wave count.
CHAPTER 6: Why It Works
Elliott Wave works not because price moves in waves…
…but because people move in cycles.
Fear → Hope → Greed → Complacency → Fear again.
The waves are just footprints of mass psychology.
They aren’t perfect. But they repeat - because we repeat.
CHAPTER 7: From Theory to Practice
Don’t get lost labeling every subwave.
Start simple:
Is the trend up or down?
Are you in an impulse or a correction?
Where’s the momentum?
Study past charts. Practice counts. Track them forward. Refine.
Takeaway
Elliott Wave won’t turn you into a psychic. But it will give you a map.
A way to anticipate structure. To spot the traps. To know when to push - and when to stay patient.
Because when you read the waves,
you stop fighting the market - and start riding it.