
ETHA vs. XRPI : Early Trend Repair or Just a Dead-Cat Bounce?
A technical roadmap for trading the Ethereum and XRP ETFs with clean levels and clear structure.

Two crypto ETFs tied to two very different underlying assets:
ETHA, the ETF tracking Ethereum, and
XRPI, the ETF tracking XRP
are now entering pivotal technical phases.
ETHA looks like it’s completing a textbook corrective pattern and beginning a potential new up-cycle aligned with Ethereum’s broader structure. XRPI, tied to XRP, has likely finished a full 5-wave downtrend and is now attempting to base, but still sits deep inside a primary bearish channel.
This note breaks down the market backdrop, the technical setup on both ETFs, and a structured trade plan framework.

Market Environment
The crypto market is stabilizing after a broad autumn sell-off; volatility is compressing, downtrends are losing momentum, and majors like BTC/ETH are showing early signs of trend repair, while alt-flow remains weak and selective
ETHA is showing early trend repair in line with broader strength in Ethereum, while XRPI is still lagging with a weak XRP backdrop and only showing signs of a corrective bounce, not a full reversal
Over the last couple of weeks, we’ve moved into volatility compression / trend repair, not full-blown euphoria:
ADX has rolled over on both names
Bollinger Bands are tightening
The flows and OBV say selling pressure has slowed, but aggressive accumulation hasn’t really started yet outside of short bursts
In that context, I’m treating both ETHA and XRPI as early-cycle repair stories after damage, not late-stage breakout trades.
Technical Analysis
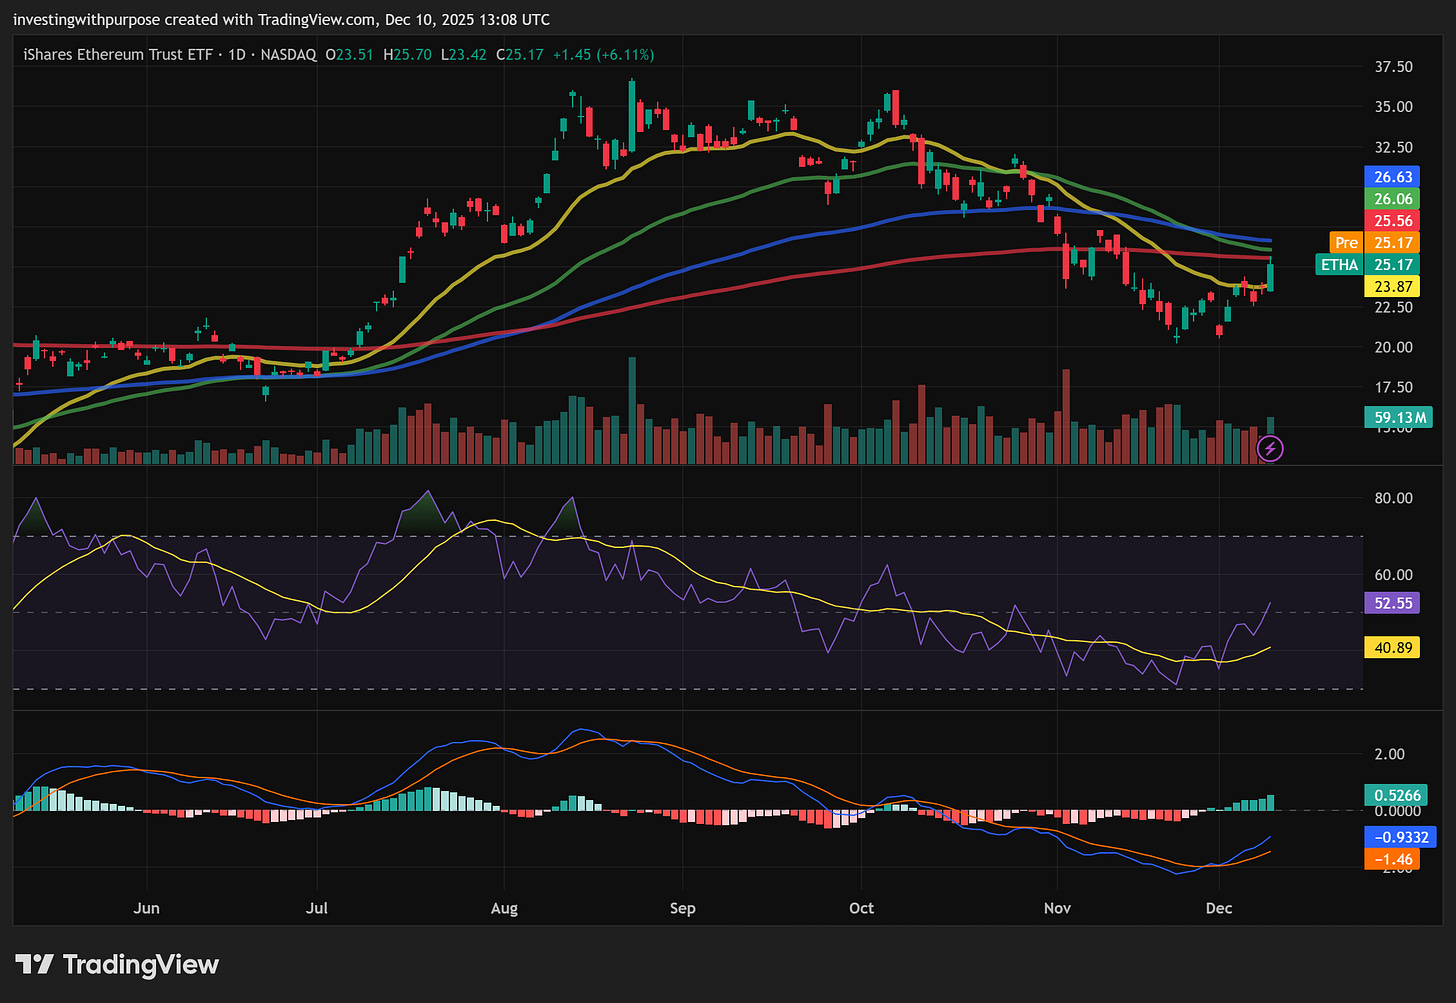
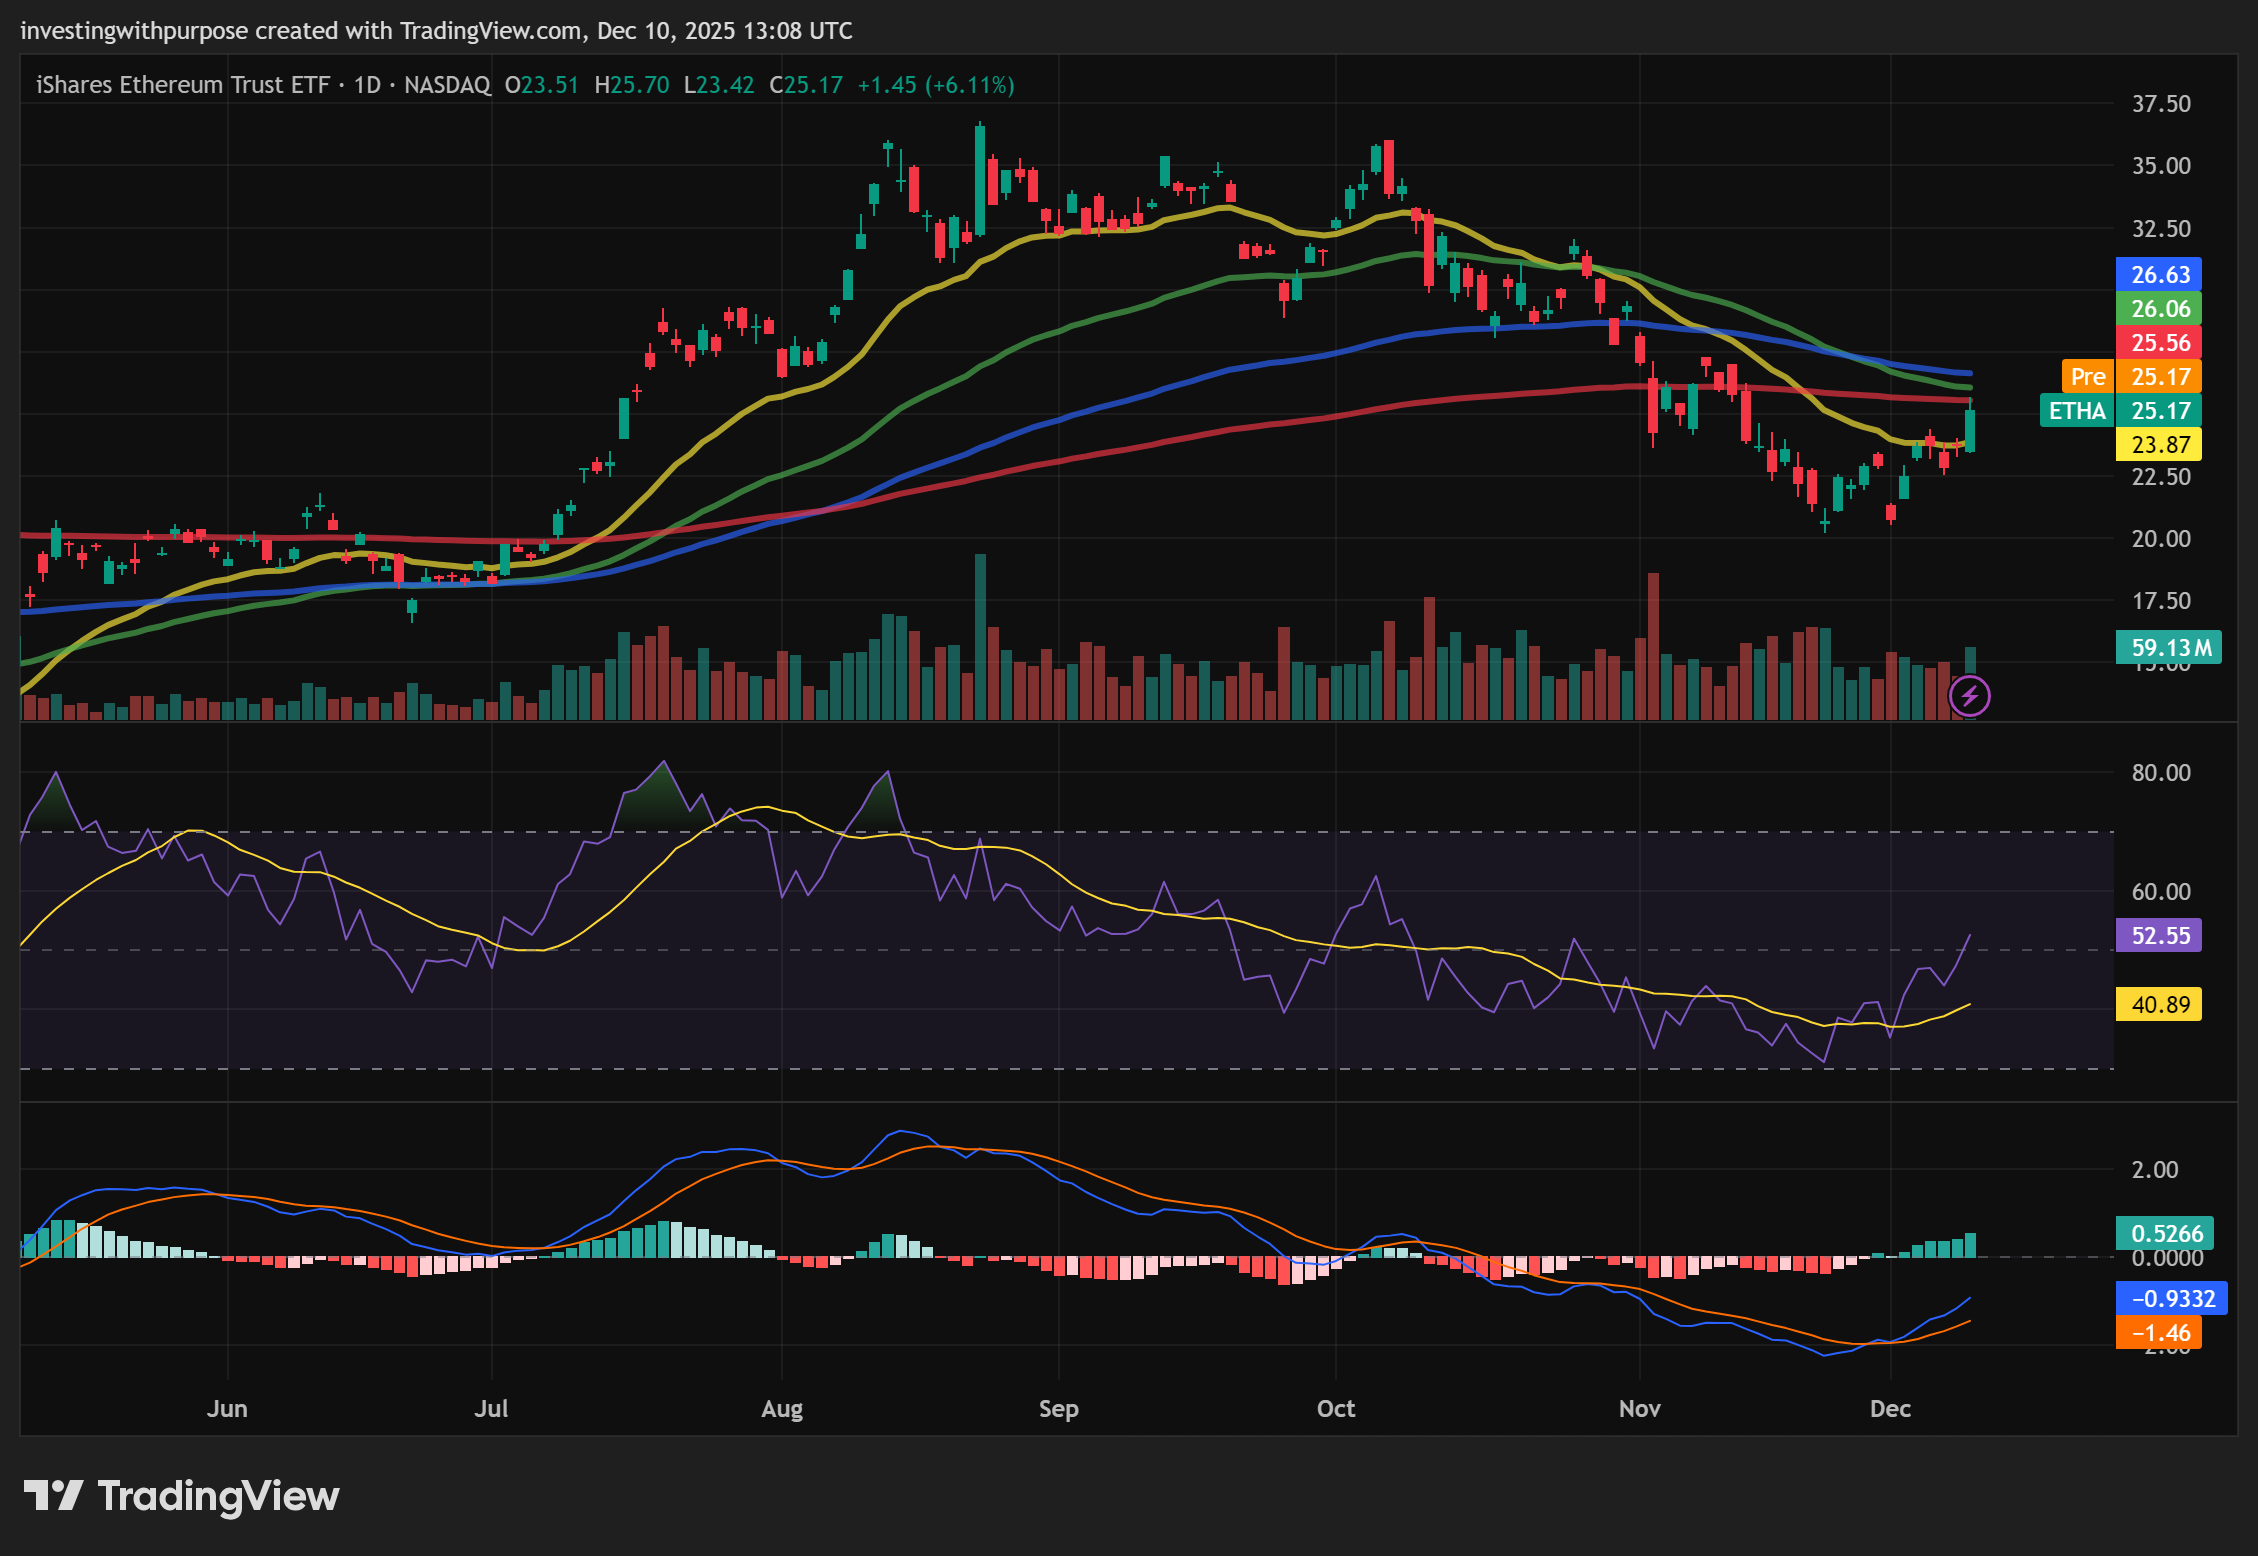
ETHA – iShares Ethereum Trust ETF
Trend & structure
Weekly: Clear 5-wave advance up into the mid/high-30s, followed by a clean ABC correction into the 20–21 area. The C-wave low aligns with the 0.382 retrace (~20.8) of the entire prior advance, which is classic “end of correction” territory
Daily: Price has bounced hard from the 20 low to the mid-20s, reclaiming the 20-EMA and pushing toward a heavy MA cluster at 25.5–26.6 (200/50/100-EMAs)
This MA cluster sits on top of the 0.382 retrace (26.26) of the 36 → 20 decline, and just under the weekly 0.618 (~26.9). Massive confluence
Momentum & volatility
RSI (daily) is back around 50–53, up from 30s. That’s a shift from bearish to neutral-bullish
MACD (daily) has just crossed bullish from deep negative, histogram now positive but still near the zero line – early-stage thrust, not overcooked
Stoch / 4h RSI are overbought, and price is near the upper Bollinger band. That flags short-term stretch even if the bigger picture is turning up
Levels (ETHA)
Support
24.0–24.2: Recent breakout zone / 4h structure. First “healthy pullback” area
23.0–23.5: Bollinger mid + prior pivot lows. Lose this and the thrust is suspect
20.8–21.0: Weekly 0.382 + C-wave low region – primary invalidation for the “correction is done” view
Resistance
25.5–26.0: First serious supply – MA cluster start + short-term fib extensions
26.3–27.0: Daily 0.382 + weekly 0.618 + full MA cluster. Confirmation band
30–32: Daily 0.618–0.786 retrace and prior distribution zone
Above that sits the old high (36) and extensions into 40–45 if ETH really trends
ETHA looks like ABC correction likely complete, now in wave 1 (or A) of a new up-degree. Trend is not fully confirmed until price can break and hold above 27, but structure is constructively bullish with pullback risk in the very near term.
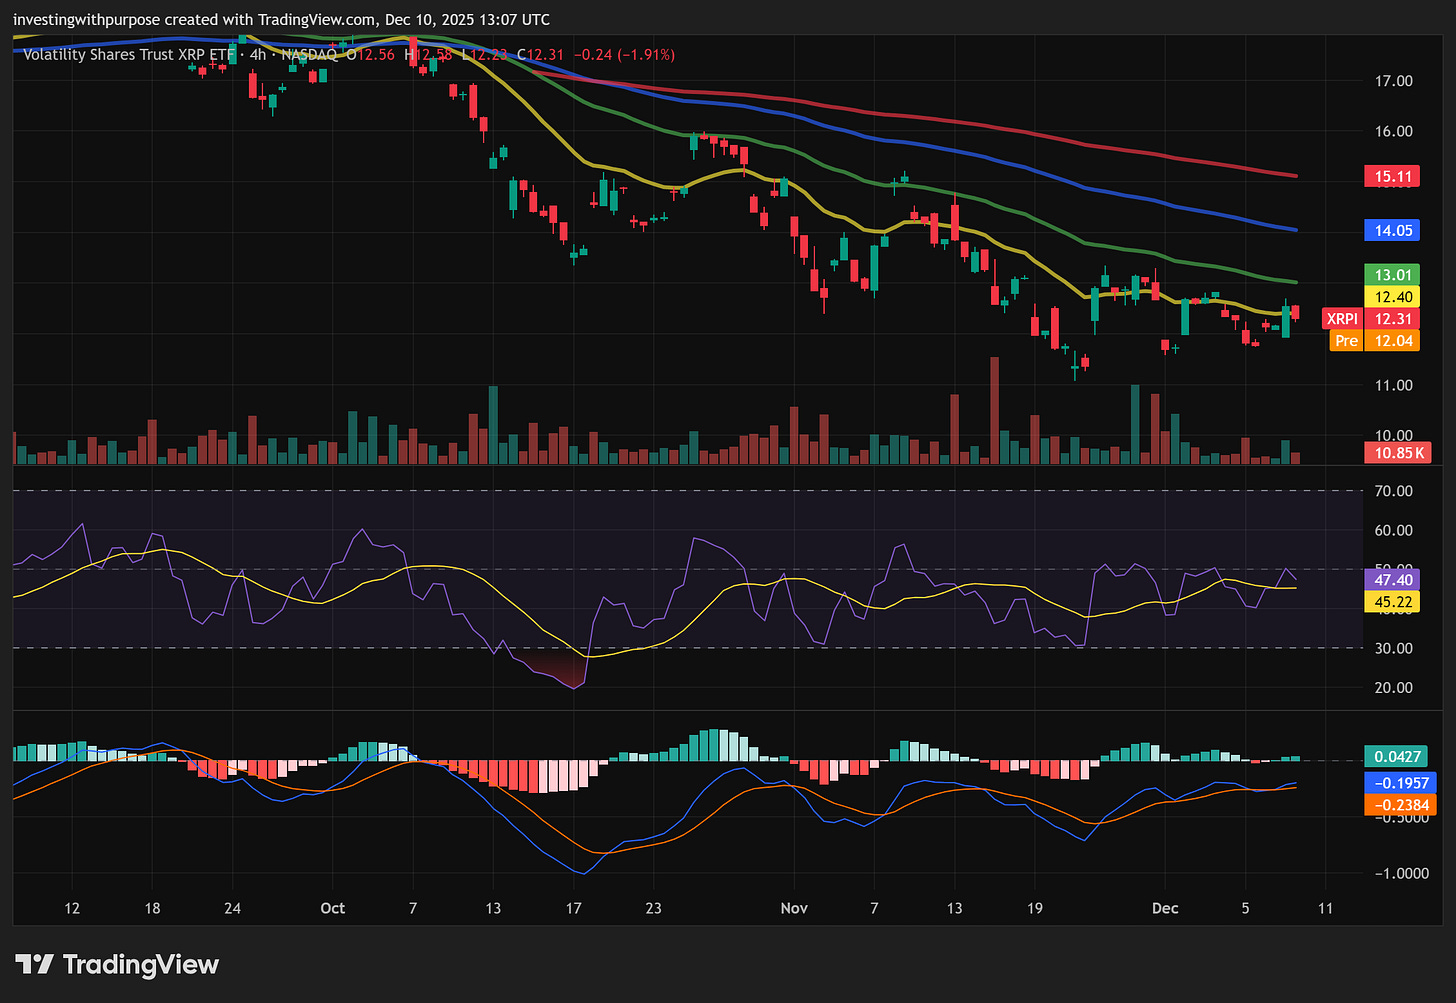
XRPI – Volatility Shares Trust XRP ETF
Trend & structure
Daily Elliott wave shows the opposite of ETHA:
A full 5-wave impulse down from the summer high (upper teens) into 11–11.1
Post-(5), XRPI has moved into a sideways base between 11 and 13, not yet a meaningful up-trend
Fib retrace of the 18.7 → 11.05 decline:
0.236 at 12.86, 0.382 at 13.97, 0.618 at 15.78
Price sits just below the 0.236, which is a very shallow bounce so far.
EMAs & momentum
Daily EMAs: 20-EMA = 12.8, | 50-EMA = 14.0, | 100-EMA = 15.1
Price near 12.3–12.4, still below all EMAs, which are sloping down. Trend remains decisively bearish on the larger frame
RSI (daily) ~45, grinding up from the 30s but still under 50. Neutral-bearish, but repairing
MACD (daily) has crossed up from below, histogram marginally positive – signaling trend exhaustion and early repair, not a dominant bull phase

Volatility, ADX, OBV
Bollinger Bands have narrowed, and price is trading in the middle of the bands → volatility compression / range
ADX has fallen into mid-teens while −DI drifts down: the big downtrend is out of gas
OBV trended lower with the selloff but has flattened recently – selling pressure slowing, not yet clear accumulation
Fib & short-term map (XRPI)
Shorter 4h swing 13.35 → 11.58:
0.382: 12.25 | 0.618: 12.67 | 0.786: 12.97 | 1.0: 13.35
Daily extension off 15.21 → 11.59:
0.618: 12.98 | 0.786: 12.37 | 1.272: 10.61 | 1.618: 9.36
XRPI has probably completed a 5-wave down, now in an ABC or sideways corrective phase. The structure allows for a bounce toward 13.5–14, but unless price can reclaim mid-teens and flip EMAs up, it remains a counter-trend rally inside a larger bear.
Our Trade Plan Framework
ETHA – Swing-long biased
Bias: Bullish, looking for new up-cycle after completed ABC, but expecting near-term pullbacks due to overbought 4h/daily oscillators and overhead resistance.
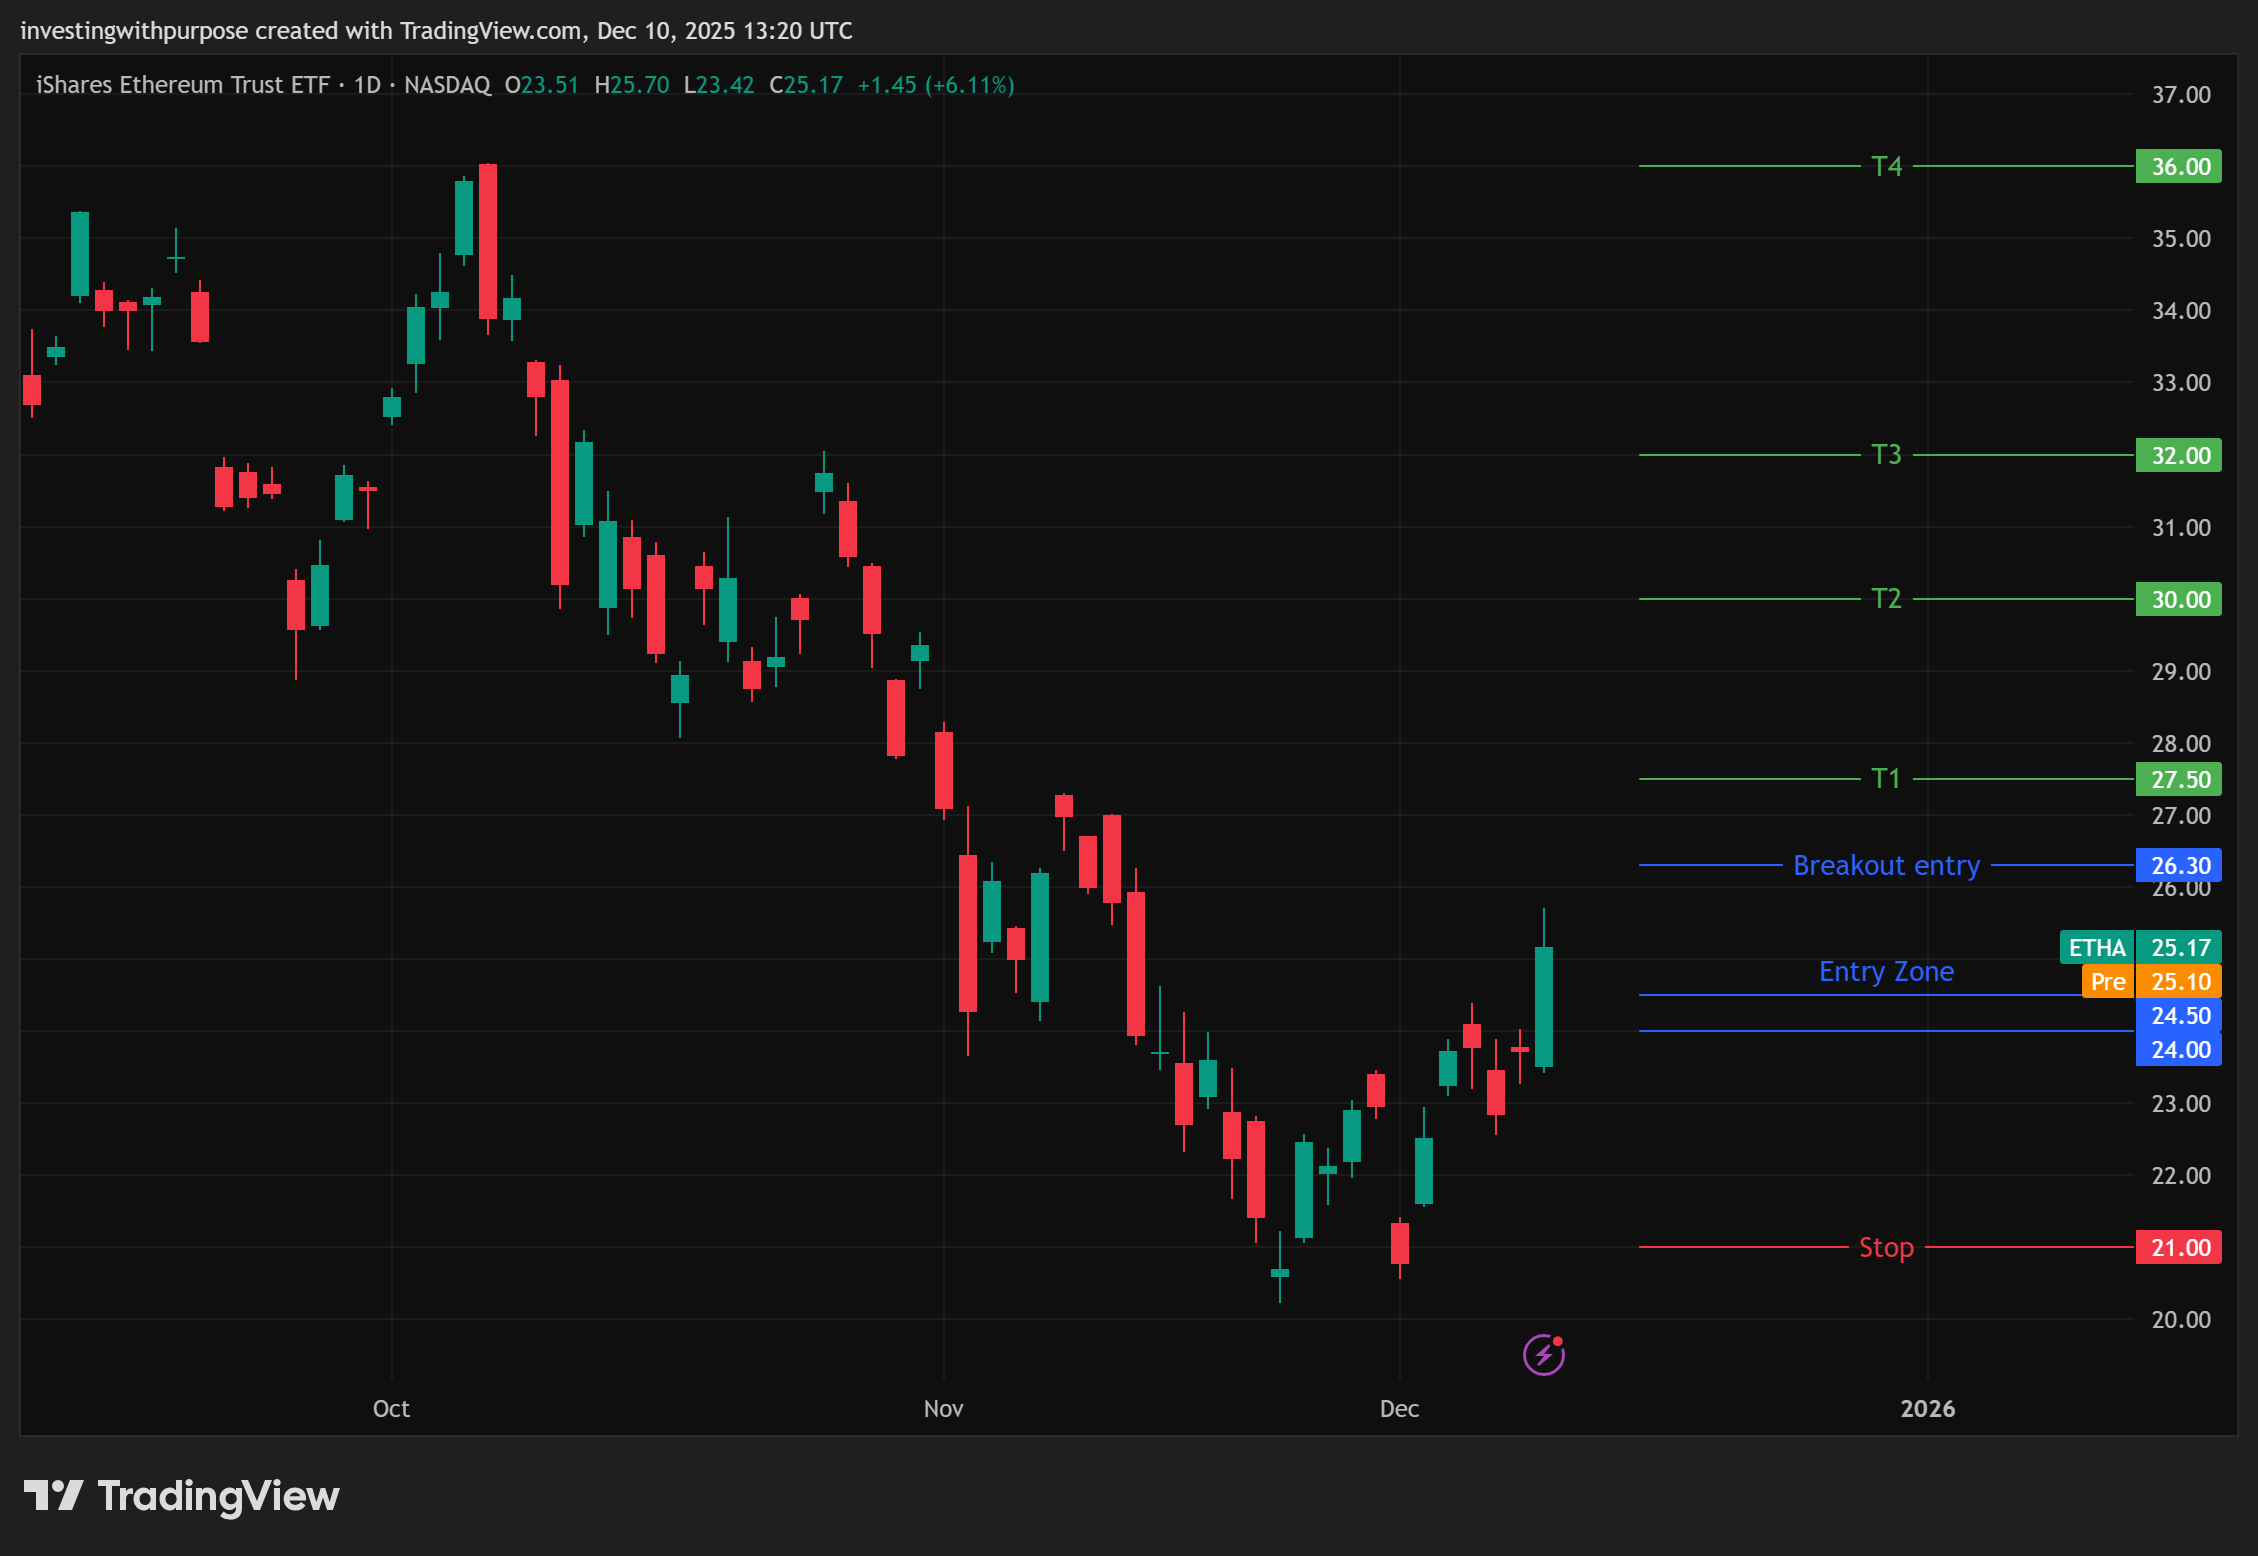
Preferred risk-on zone
Initial buy zone: 24.0–24.5 on a fade after this thrust
Deeper add zone: 23.0–23.5 if tested with momentum still constructive (RSI > 45, MACD not crossing back down hard)
Invalidation
Structural invalidation below ~21 (weekly 0.382 / C-low region). A close beneath that suggests the ABC wasn’t actually complete
Breakout 1: Above 26.30 Flips EMAs + breaks first supply. Targets: 27.5 → 30 → 32
Breakout 2: Above 30.50 Trend reversal trigger. Targets: 32.5 → 36 → 40
Upside “ladder”
Target 1: 25.5–26.0 – trim / reassess into first heavy supply
Target 2: 26.5–27.0 – if ETHA breaks and holds above this band, the higher-timeframe bull thesis gains real traction
Target 3: 30–32 – full 0.618–0.786 retrace and prior distribution zone
Optional longer-term: 36 (prior high) then fib extensions 40–42 if a strong Ethereum bull leg materializes
Timeframe: Weeks to a few months – this is not a day-trade; it’s a swing built on weekly/daily structure
XRPI – Tactical bounce vs. bigger bear
Bias: Neutral to modestly bullish short-term, bearish higher-timeframe trend until proven otherwise. Idea is to treat any strength as a corrective bounce inside a larger downtrend.
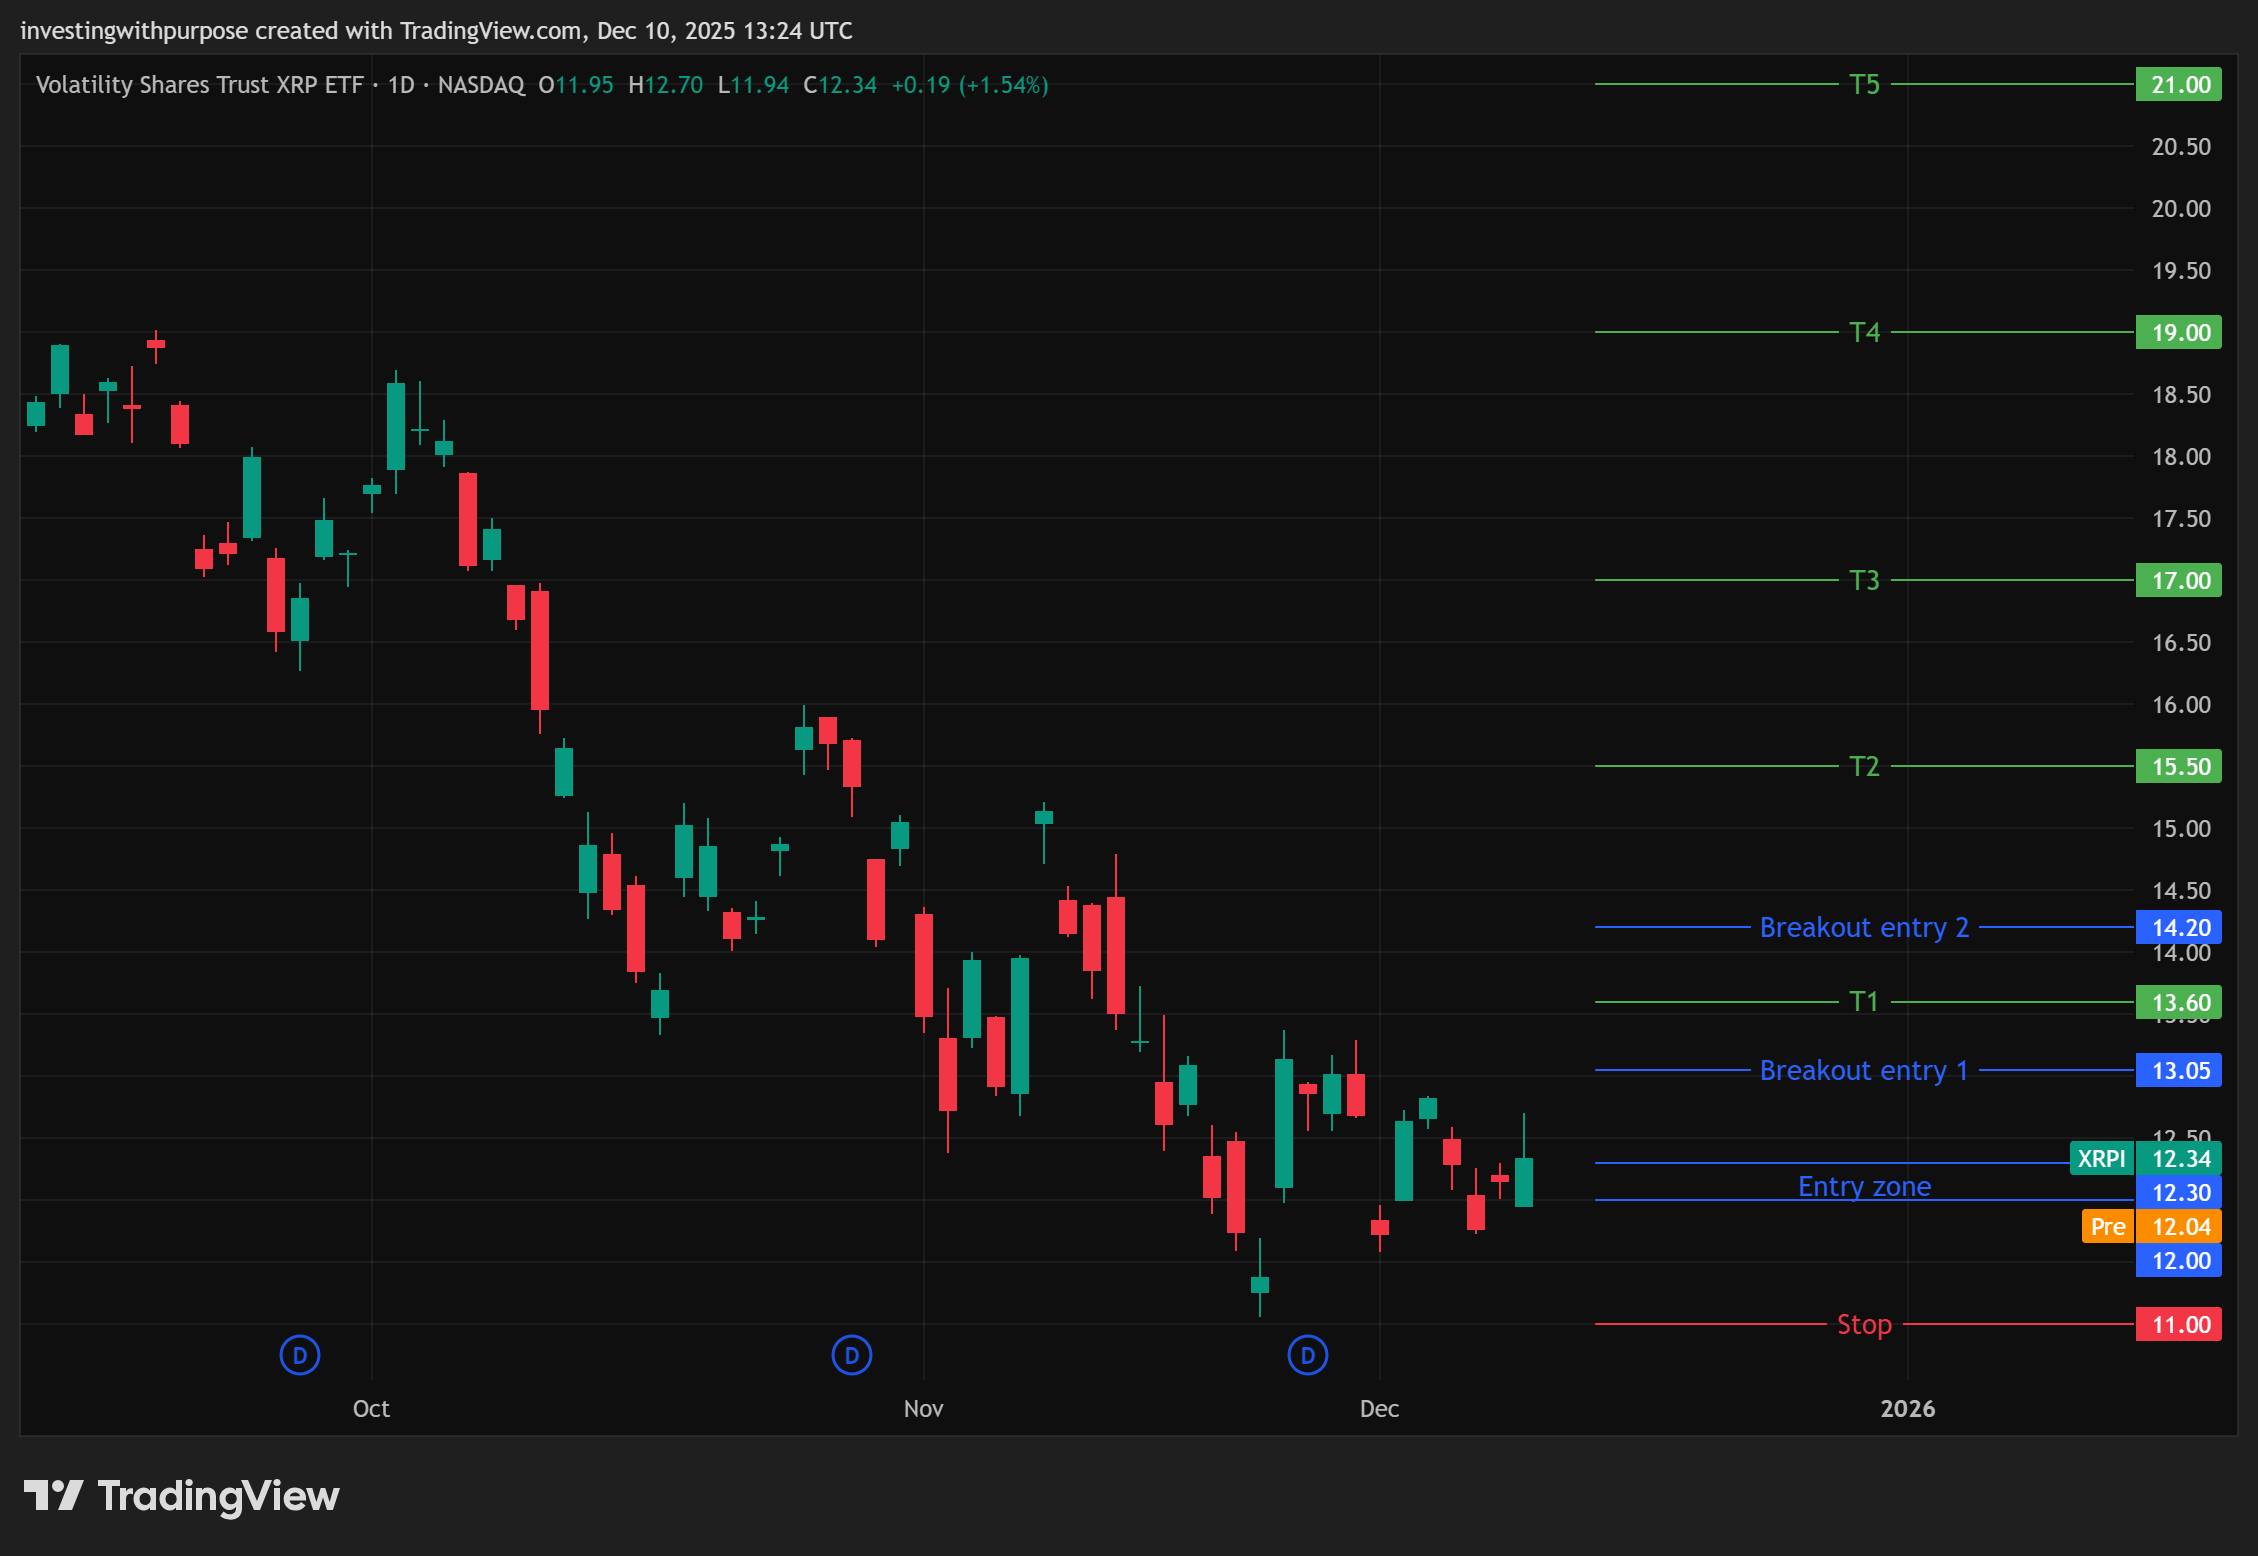
Aggressive bounce framework
Entry zone: 12.0–12.3 as long as 11.8–12.0 holds as higher low
Stop / invalidation: A decisive break below 11.0–11.2 opens extension risk toward 10.6 → 9.4 – that’s where the 5-down-is-done thesis fails
Breakout 1: Above 13.05 Clears local supply. Targets: 13.6 → 14
Breakout 2: Above 14.20 Breaks structure. Targets: 15–16
Breakout 3: Above 15.80 Major trend shift. Targets: 17 → 19 → 21
Upside “ladder”
Target 1: 12.8–13.0 (daily 0.236 + 4h 0.618 + cluster). Expect sellers to show up here first
Target 2: 13.6–14.0 (Elliott projected (a) ≈ 13.6 + multiple fibs around 13.8–14)
Stretch Target: 15.5–16.0 (daily 0.618 retrace + declining EMAs). This is where a lot of shorts would look to lean in again, unless the character of the move changes dramatically
Reversal criteria (bigger picture)
XRPI only graduates from “bear rally” to “potential new uptrend” if:
Price closes and holds above 15–16,
EMAs begin to flatten and curl up, and
RSI sustains >50–55 with MACD firmly positive
Bottom Line
ETHA is the stronger technical story right now. The weekly/daily structure looks like a completed corrective ABC inside a larger uptrend, and the current push off 20–21 has all the hallmarks of the first leg in a new cycle. The catch: it’s short-term overbought and running into a major 25.5–27 resistance band, so patience on entries matters.
XRPI is still a damaged chart. The 5-wave decline appears complete, and momentum has stopped getting worse, but what’s happening now is best treated as a corrective bounce in a primary downtrend. Until XRPI can reclaim and hold the mid-teens, rallies into 13–16 look more like opportunities to fade strength than a confirmed trend change.
In portfolio terms, if you want exposure to this space on technicals alone, ETHA is the “trend repair with upside optionality” candidate, and XRPI is the “tactical mean-reversion / trade, not trend” candidate.
This content is for informational and educational purposes only and should not be taken as financial or investment advice. This publication is not a solicitation to buy or sell any security or financial instrument.