
Ethereum vs XRP On Wall Street: A Practical Look At ETHA And XRPI
How two crypto ETFs give you very different ways to ride the next leg of the digital asset cycle

Crypto is no longer living only on exchanges and hardware wallets. With spot Ethereum ETFs live in the US and the first XRP ETF now trading, blockchains that started as experiments are turning into listed products that sit next to blue chip stocks in brokerage accounts.
In this piece we will look at two of those funds:
iShares Ethereum Trust ETF (ETHA) from BlackRock
Volatility Shares XRP ETF (XRPI)
Both sit in the same broad sector - digital asset exchange traded products - but they behave very differently. ETHA is a scale product tied to the Ethereum ecosystem. XRPI is a smaller, higher fee ETF tied to XRP and Ripple’s payment and tokenization story.
Because these ETFs are young on the weekly timeframe, we will use both ETF level data and the longer price history of ETH/USD and XRP/USD to understand the bigger trend. Along the way we will fold in macro factors, regulation, and what is happening in the underlying networks.
The goal here is simple: give you a grounded, approachable look at where these funds sit today and how a thoughtful, risk aware investor might use them.

Key takeaways
ETHA is the institutional sized Ethereum play. It holds spot ether, charges a 0.25 percent fee and already manages around 13 billion dollars in assets, making it the dominant US Ethereum ETF. POEMS
XRPI is the smaller, niche XRP vehicle. It launched in May 2025, has roughly 180 million dollars in assets and charges 0.94 percent per year, so it is significantly more expensive to hold long term. etf.com
Macro is shifting from tight money to easing. The Federal Reserve has begun cutting rates, taking the policy rate down toward the 3.75 to 4.0 percent range while inflation runs near 3 percent. That environment tends to be friendlier to risk assets, including crypto and crypto ETFs, but it can still be choppy. Federal Reserve
Ethereum’s ecosystem is broad and deep. It still dominates DeFi value and stablecoin activity, and is a leading platform for tokenization of real world assets. Velvetech
XRP’s story is about payments and regulatory clarity. Ripple has largely resolved its long running SEC case and is leaning into cross border payments, stablecoin rails and tokenized money market funds on the XRP Ledger in partnership with banks and asset managers. Reuters
Technically, both ETFs are in corrective phases, not melt ups.
ETHA is trading just above its 200 day moving average after a pullback from the mid 30s, with momentum weak but stabilizing.
XRPI is in a downtrend from summer highs near 19 dollars, bouncing off the low teens but still below key resistance.
A sensible approach here is slow, staged exposure, not all in bets. Think partial positions near support, time diversification, and a clear plan for what happens if you are wrong.
Technical analysis
This is not about predicting the exact next candle. It is about understanding where these ETFs sit in their current swings and what that suggests about risk and reward over the next several months.
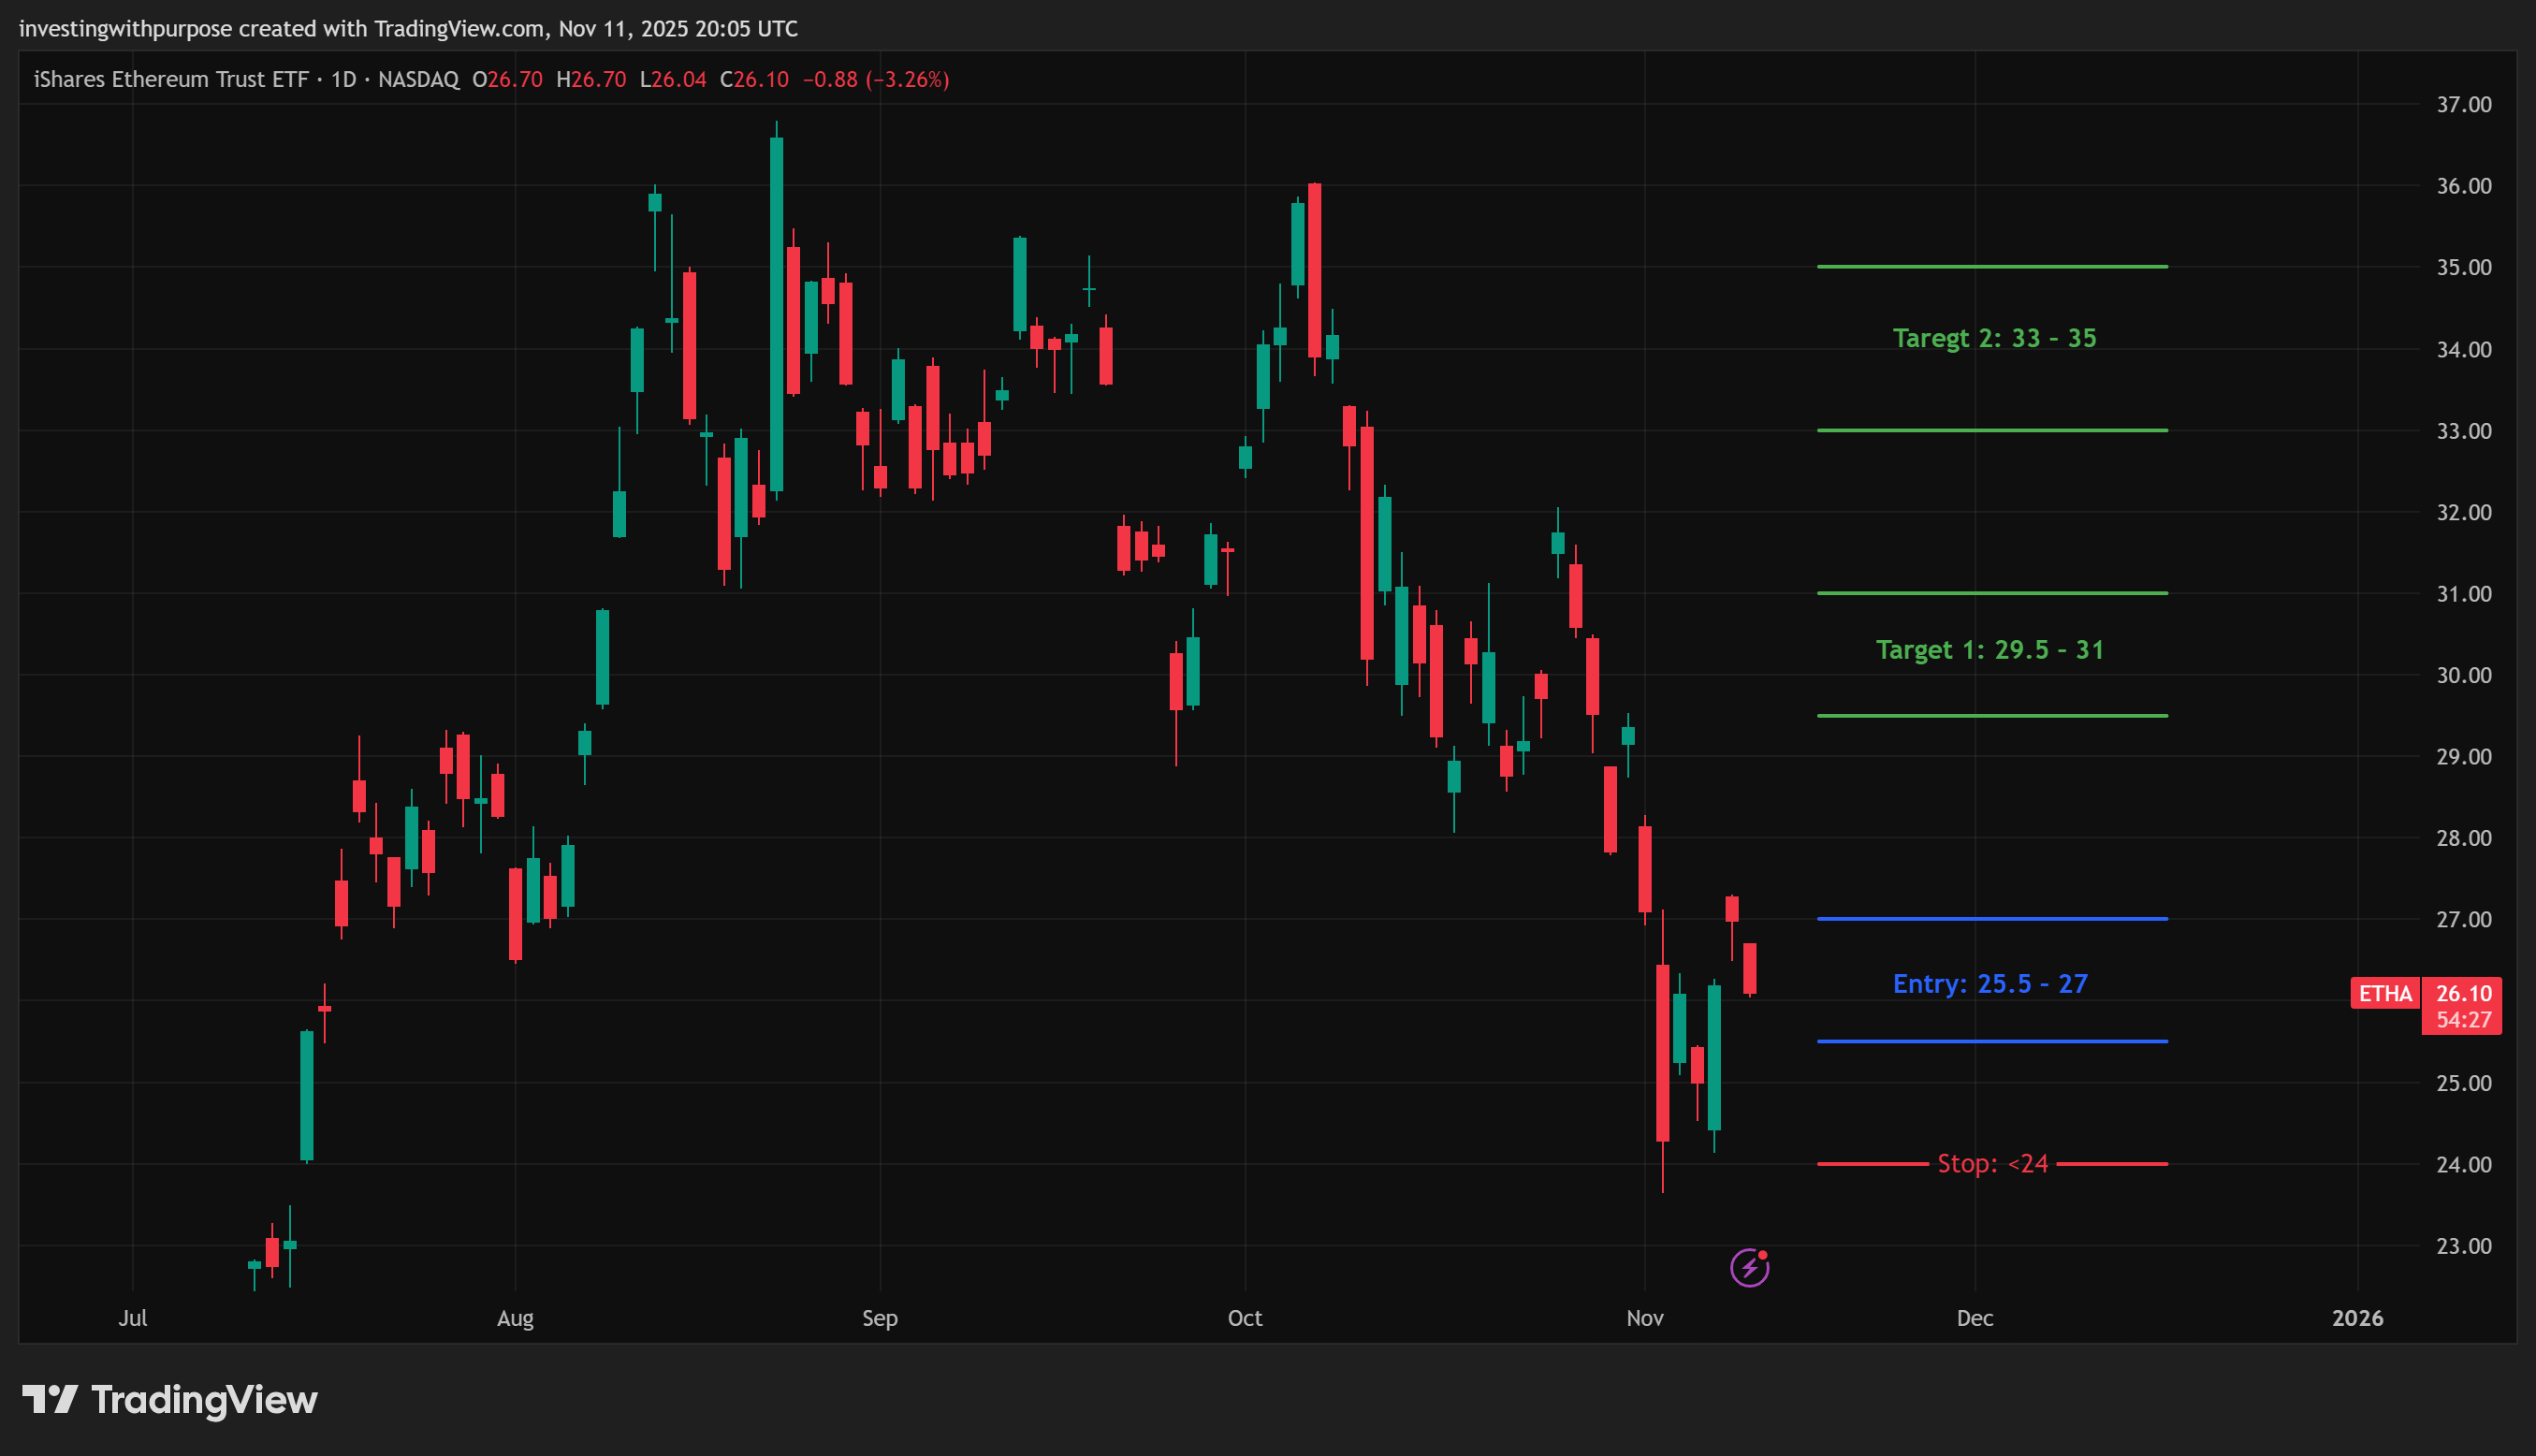
ETHA - price action and levels
On the daily chart, ETHA is trading around 26 dollars, after a pullback from summer highs in the mid 30s.
Price is sitting just above the 200 day exponential moving average near 26 dollars, while the 20, 50 and 100 day EMAs cluster between roughly 28 and 30 dollars. The fact that price is below the shorter EMAs but trying to hold the 200 day line tells you this is a correction within a larger advance, not a bullish breakout.
The daily RSI is around 42, which is weak but not oversold. It has stopped falling, which often signals that the momentum of the selloff is fading.
The MACD histogram is still negative, but the bars are shrinking and the MACD line has started to flatten under the signal line, another hint that downside momentum is slowing.
From the Fibonacci retracement and extension work you shared on ETHA:
There is a band of nearby resistance between about 33 and 35 dollars, where the 0.236 and 0.382 retracement levels line up with prior congestion.
Deeper resistance sits near 38 to 40 dollars and then around the mid 40s area if price can reclaim its prior highs and push into extension territory.
On the downside, the retracement grid suggests intermediate support in the low 20s, with a more important zone around 21 to 22 dollars where several levels cluster.
On the 4 hour chart, ETHA has bounced off recent lows near 24 to 25 dollars and is now trading below the Bollinger band mid line around 27 dollars, with the stochastic oscillator in overbought territory. That is classic short term “relief rally inside a bigger downtrend” behavior.
Put together, ETHA looks like:
Primary trend: still up on the weekly ether chart, above long term moving averages, but correcting.
ETF trend: medium term downtrend from the peak, testing long term support.
Tactical takeaway: not the moment to chase strength, but interesting for investors looking to accumulate on weakness near longer term support.
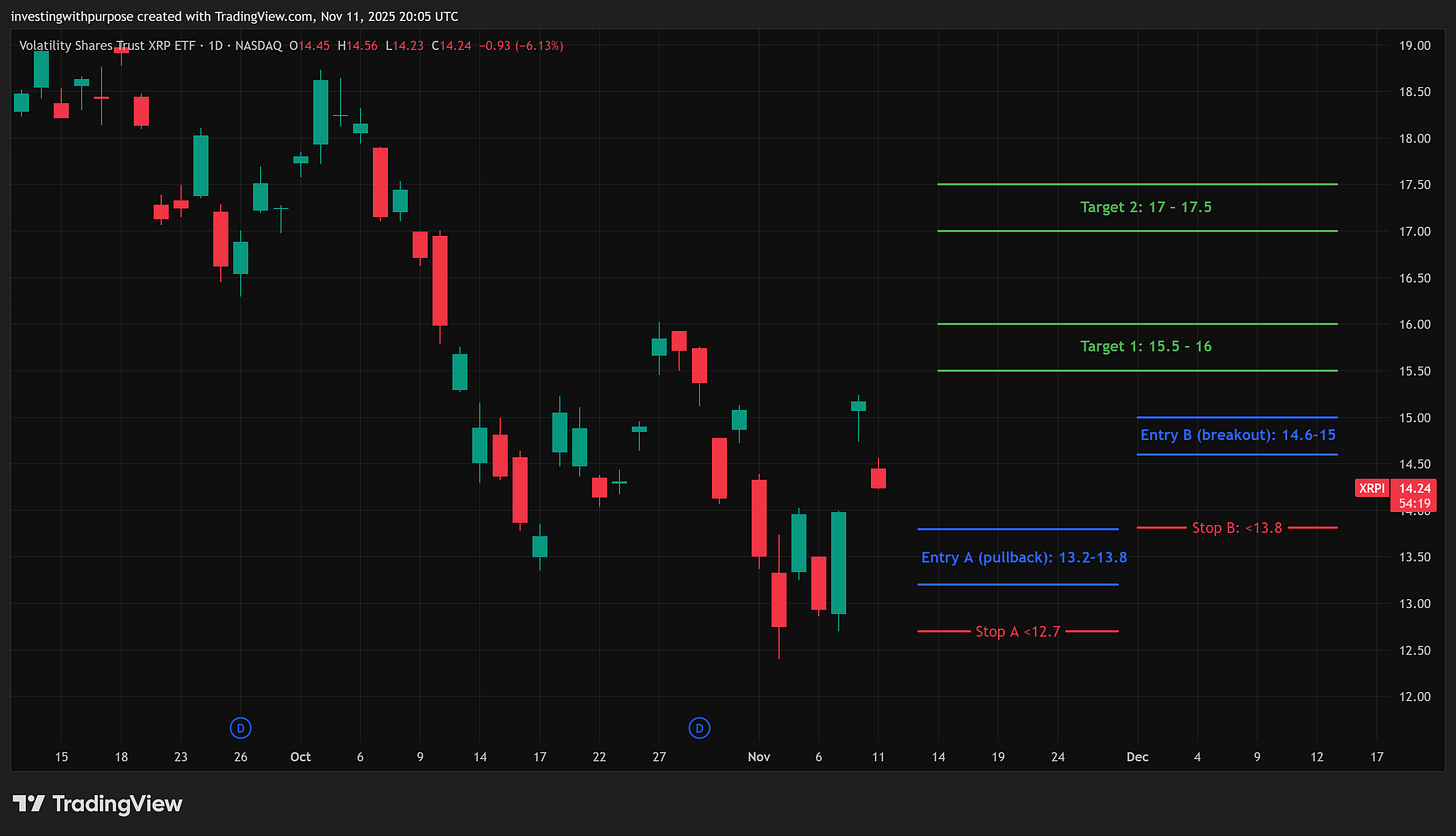
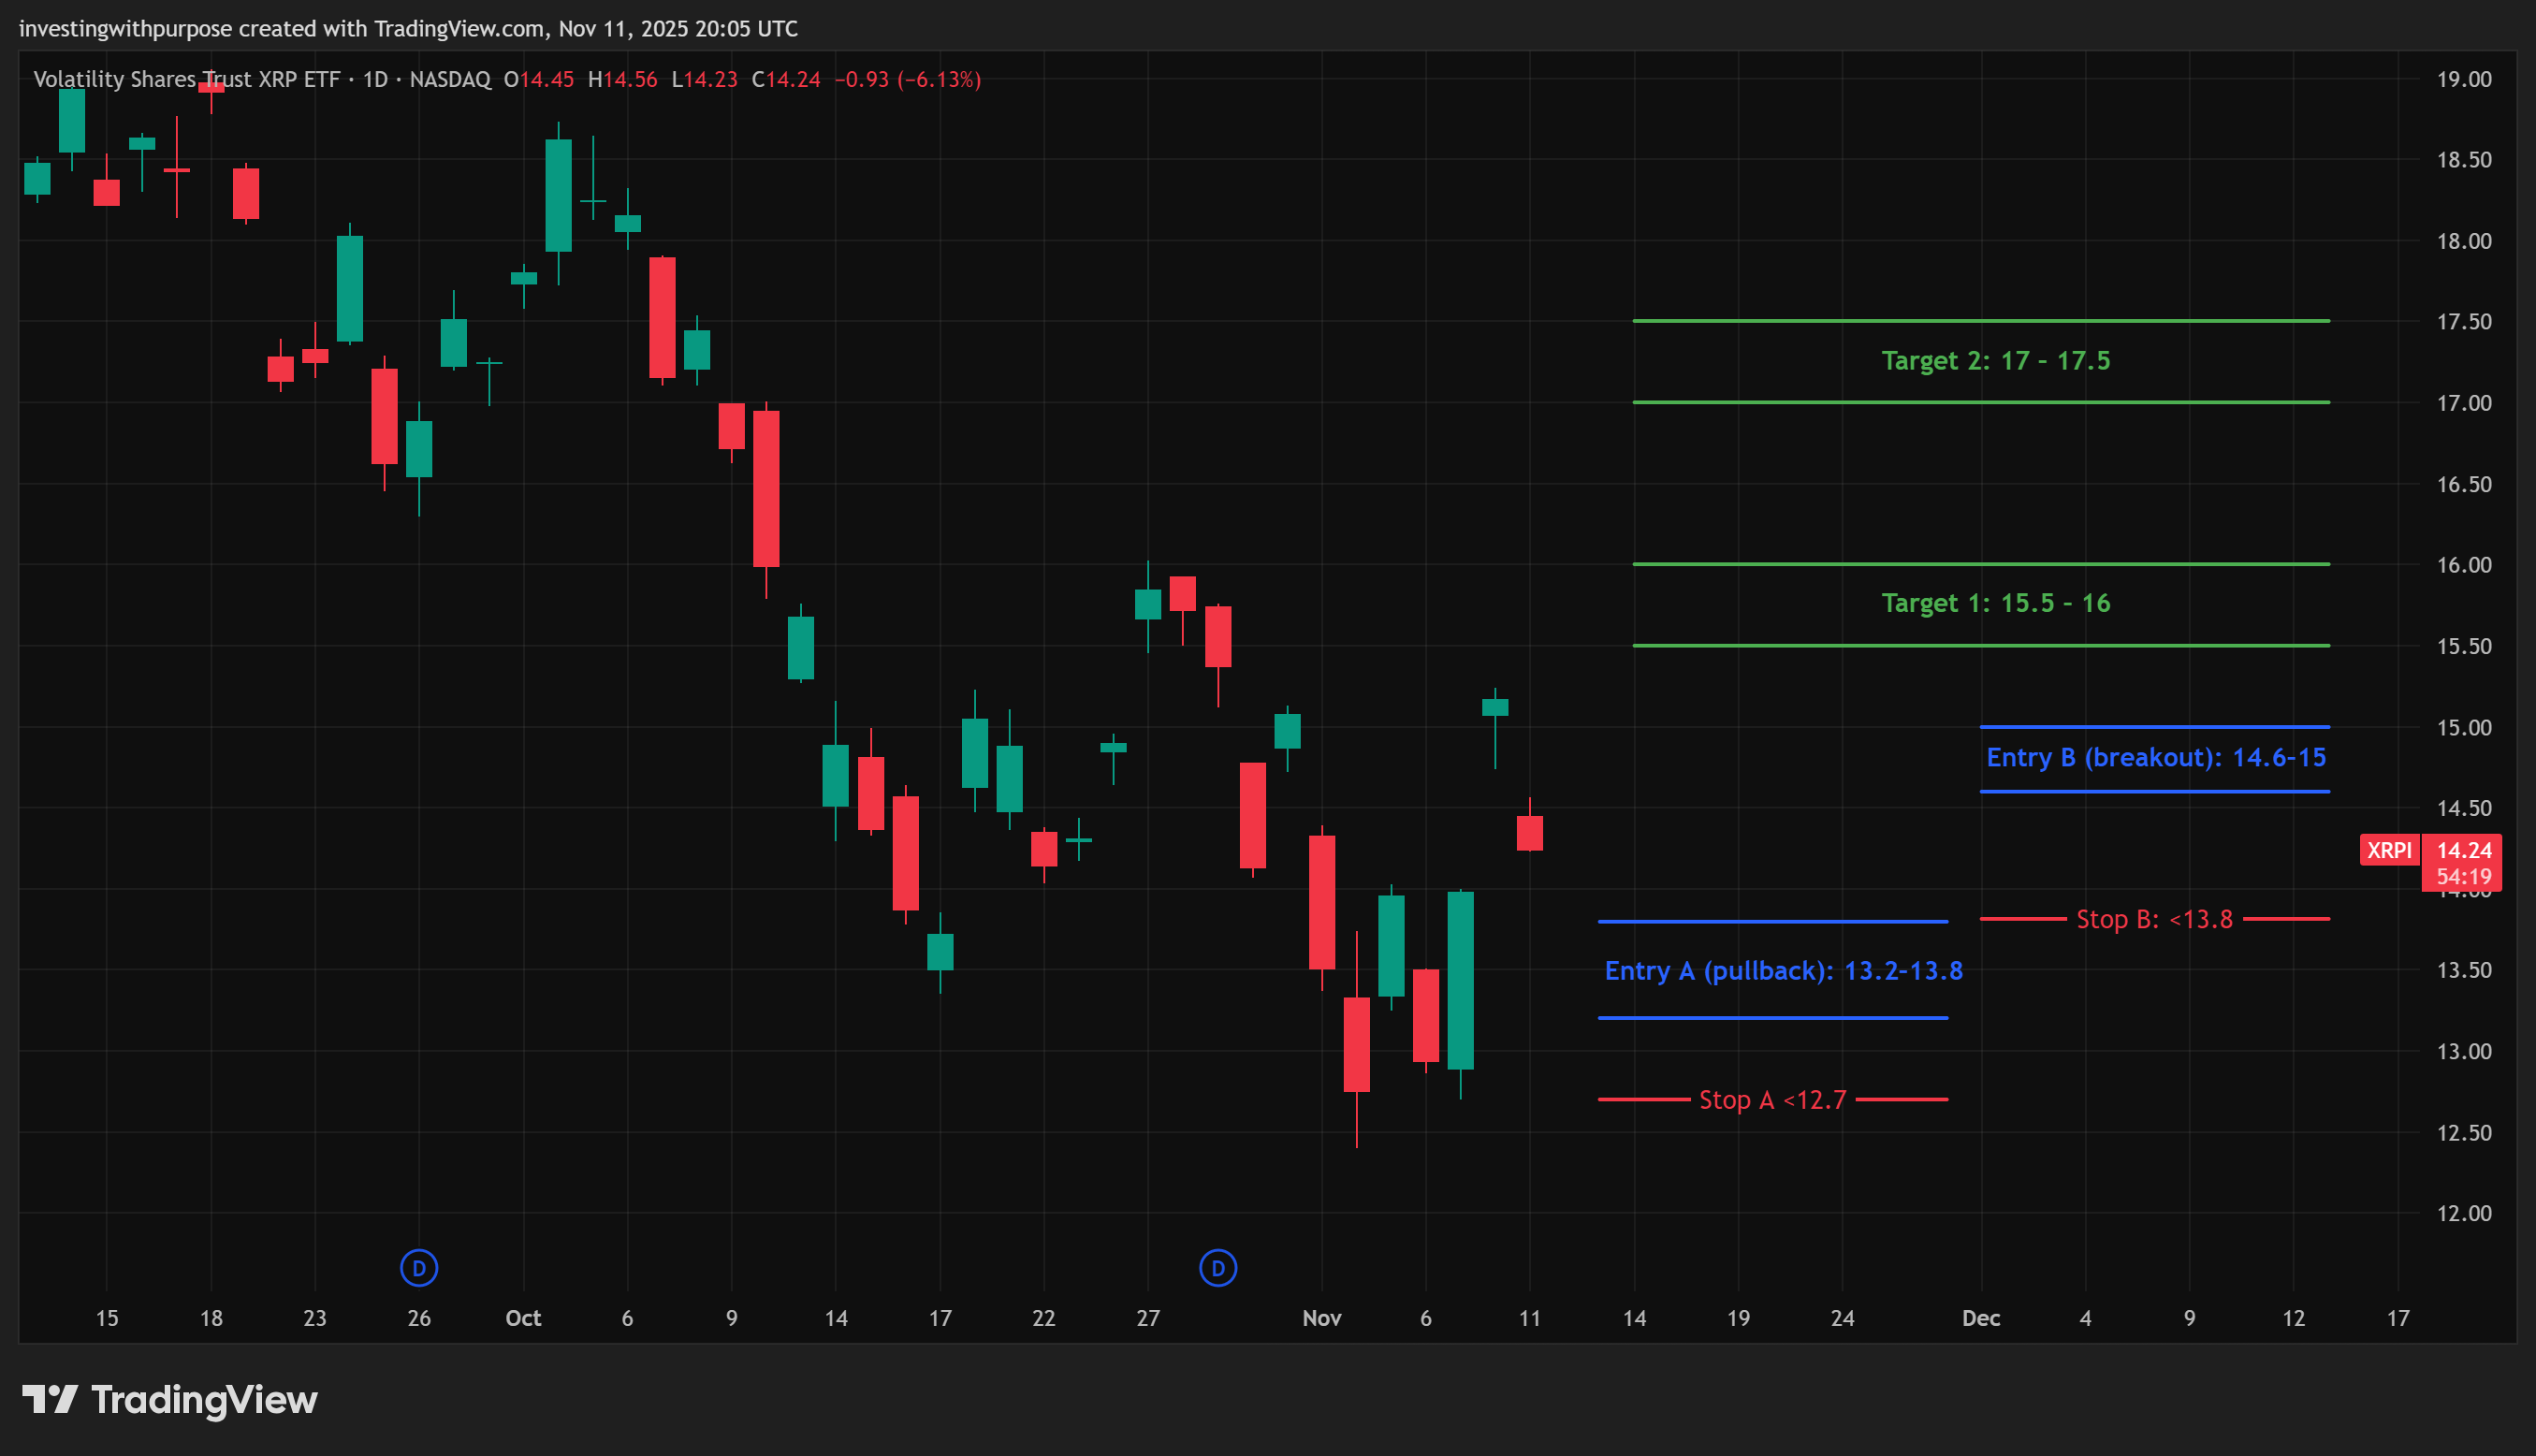
XRPI - price action and levels
XRPI has had a rougher ride. The ETF peaked near 18 to 19 dollars not long after launch and has since slid into the mid teens.
On the daily chart:
Price is currently around 14.3 dollars, below the Bollinger basis line near 14.4 and well below the upper band near 16.0. The trend has been down for several months.
The ADX sits just under 20, which means the existing downtrend is not especially strong but still in control.
Daily stochastics are already up in the 80s after a short bounce, suggesting limited room for a straight line rally unless real buying pressure steps in.
On balance volume is still hovering near its lows, which tells you that large, persistent accumulation is not yet obvious.
The Fibonacci retracement from the prior swing high highlights:
Overhead resistance around 16.3 and 17.2 dollars at the 0.382 and 0.236 retracement lines.
Stronger resistance just under 15 dollars where both local price structure and the 0.618 zone converge.
A ladder of potential supports between 12.4 and about 10.7 dollars, with a deeper extension level near 8.5 dollars if markets were to experience a more severe washout.
Looking at XRP/USD on the weekly chart, price is around 2.4 dollars, trading near the lower half of its Bollinger band range. Stochastic readings are deeply oversold and beginning to curl up, which often precedes multi week mean reversion, especially when longer term narratives remain intact.
That combination suggests:
The big weekly trend in XRP is corrective after a very strong run into early 2025.
XRPI is in a vulnerable but potentially interesting zone. Short term traders may try to fade bounces into resistance. Longer term investors might quietly accumulate small amounts on weak days rather than trying to pick the exact bottom.
Simple, risk aware trade approach
There is no single “right” way to trade these ETFs, but if the goal is to be strategic and risk averse, a few principles go a long way. Think in terms of a playbook rather than a prediction.
1. Decide what role each ETF plays for you
A helpful framing:
ETHA as a core crypto infrastructure exposure. It captures Ethereum’s role in DeFi, stablecoins and tokenization, with a low fee and very deep liquidity.

XRPI as a satellite bet on blockchain based payments and XRP specific adoption. Higher fee, smaller asset base, more idiosyncratic risk.
If you are building a diversified portfolio, ETHA might reasonably warrant a larger allocation than XRPI simply because Ethereum’s ecosystem and the ETF’s economics are more robust.
2. Use levels, not feelings, for entries
For a cautious investor, one possible roadmap:
ETHA
Consider starting a partial position while price holds around the 200 day EMA near 26 dollars, where the risk reward looks more balanced.
If Ethereum and ETHA break convincingly back above the 28 to 30 dollar moving average cluster, that would confirm that the correction is likely over. Some investors prefer to add to winners only after that kind of reclaim.
If price closes decisively below the low 20s support zone, that would be a clear signal to step aside or size down and reassess.
XRPI
With the trend down, entries near firm support rather than mid range levels are more sensible. That might mean looking for opportunities closer to the 12 to 13 dollar region with clearly defined downside limits, rather than buying into short spikes.
On the upside, treat the 15 to 16 dollar band as a first test. If price stalls there repeatedly and volume stays light, it is a hint that this is still a trading range, not a new bull leg.
Whatever levels you choose, write them down and treat them as rules, not suggestions. That is how you keep emotions from running the show.
3. Stagger your timing
Instead of going all in at one price, you can:
Split your intended allocation into several pieces.
Buy one piece when your first level is hit, another if price moves further into your support zone, and save a final piece for when the trend shows real signs of turning up again.
This “time diversification” reduces regret. You will never hit the exact bottom, but you also avoid the all or nothing feeling that often leads to panic selling.
4. Keep sizing modest
Crypto ETFs can move quickly. Even without leverage, double digit swings in either direction are normal. For most people, allocating a small percentage of total portfolio value to these funds and keeping a larger chunk in diversified core holdings (broad equities, bonds, cash, short term Treasuries) is the healthier approach.
If you are not sure what that percentage should be, err on the low side. It is far better to be pleasantly surprised by upside than to be forced out at the worst possible moment because the position was simply too big for your risk tolerance.
5. Be clear about your time horizon
If you are thinking in weeks, focus more on the ETF charts, volatility bands and momentum.
If you are thinking in years, focus more on the underlying networks, regulation, adoption of stablecoins and tokenized assets, and the fee and structure of each ETF. The day to day swings matter much less at that scale.
Bottom line
ETHA and XRPI both sit in the same broad corner of the market, yet they tell two different stories.
ETHA gives you low cost, large scale exposure to Ethereum, a network that now underpins much of DeFi, stablecoins and asset tokenization. It is backed by the largest asset manager in the world, already commands multi billion dollar assets under management and is likely to be a core building block for institutional crypto allocations for years to come. MarketWatch
XRPI gives you targeted exposure to XRP and Ripple’s push to modernize cross border payments and tokenized cash on the XRP Ledger. It is smaller, more concentrated and more volatile, with a higher fee that makes it better suited for traders and conviction driven investors who understand the specific risks. etf.com
The macro backdrop is shifting toward easier monetary policy. Regulation is slowly catching up, particularly around stablecoins and tokenization. Both of those trends are friendly to serious blockchain networks and to the ETFs that wrap them. At the same time, prices are in corrective phases, not euphoria, which can be a good thing for anyone building positions patiently rather than chasing the latest headline.
None of this is a guarantee. Crypto remains one of the most volatile corners of the public markets. But with a clear view of what you are buying, respect for risk, and a plan that fits your own time horizon, funds like ETHA and XRPI can be tools rather than temptations.
Use them thoughtfully, size them modestly, and let the long term work in your favor.
This content is for informational and educational purposes only and should not be taken as financial or investment advice. This publication is not a solicitation to buy or sell any security or financial instrument.