
Everyone Expected NVIDIA to Beat. Nobody Expected to Buy It on Sale the Next Day.
The earnings were exceptional. The reaction was predictable. Here is what long-term investors actually need to know.

The best companies don't always produce the best short-term price action. Knowing the difference is the job.
There is a version of yesterday’s NVIDIA earnings story that looks like bad news. The stock opened lower this morning, spent most of the day sliding, and is sitting around $185 as markets approach the close. For a company that just reported $68.1 billion in quarterly revenue, growing 73% year-over-year, that feels wrong.
It isn’t wrong, exactly. It’s just the market doing what it always does with NVIDIA: demanding more.
That’s the real story here. Not the earnings, which were genuinely excellent. Not the guidance, which crushed expectations. The real story is the psychological gap between what a company delivers and what the market had already priced in. That gap, and how you think about it, determines whether this moment is noise or signal.
Let’s work through it carefully.
Key Takeaways
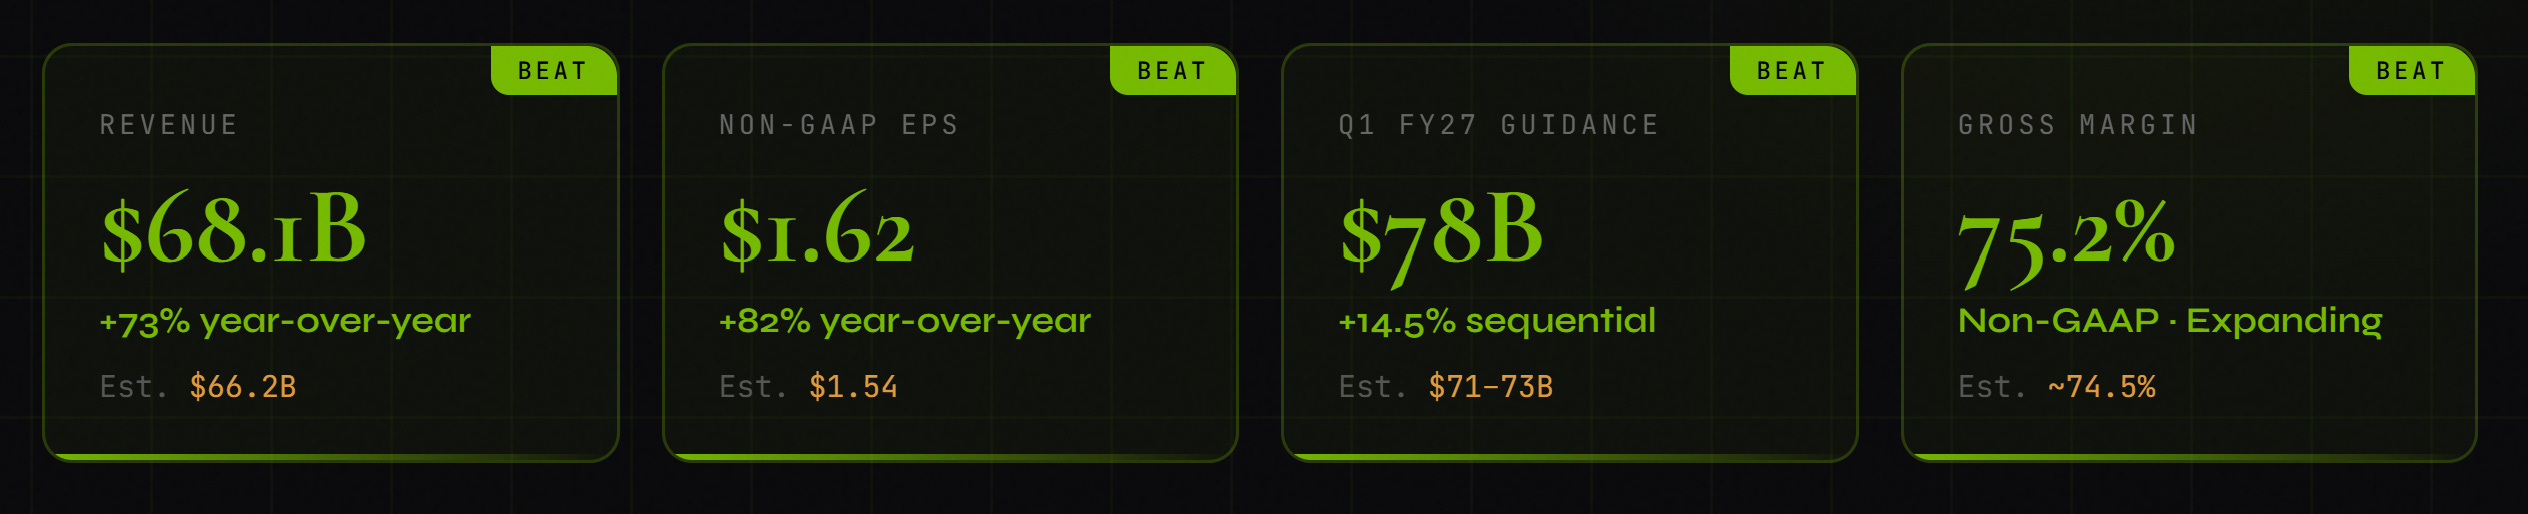
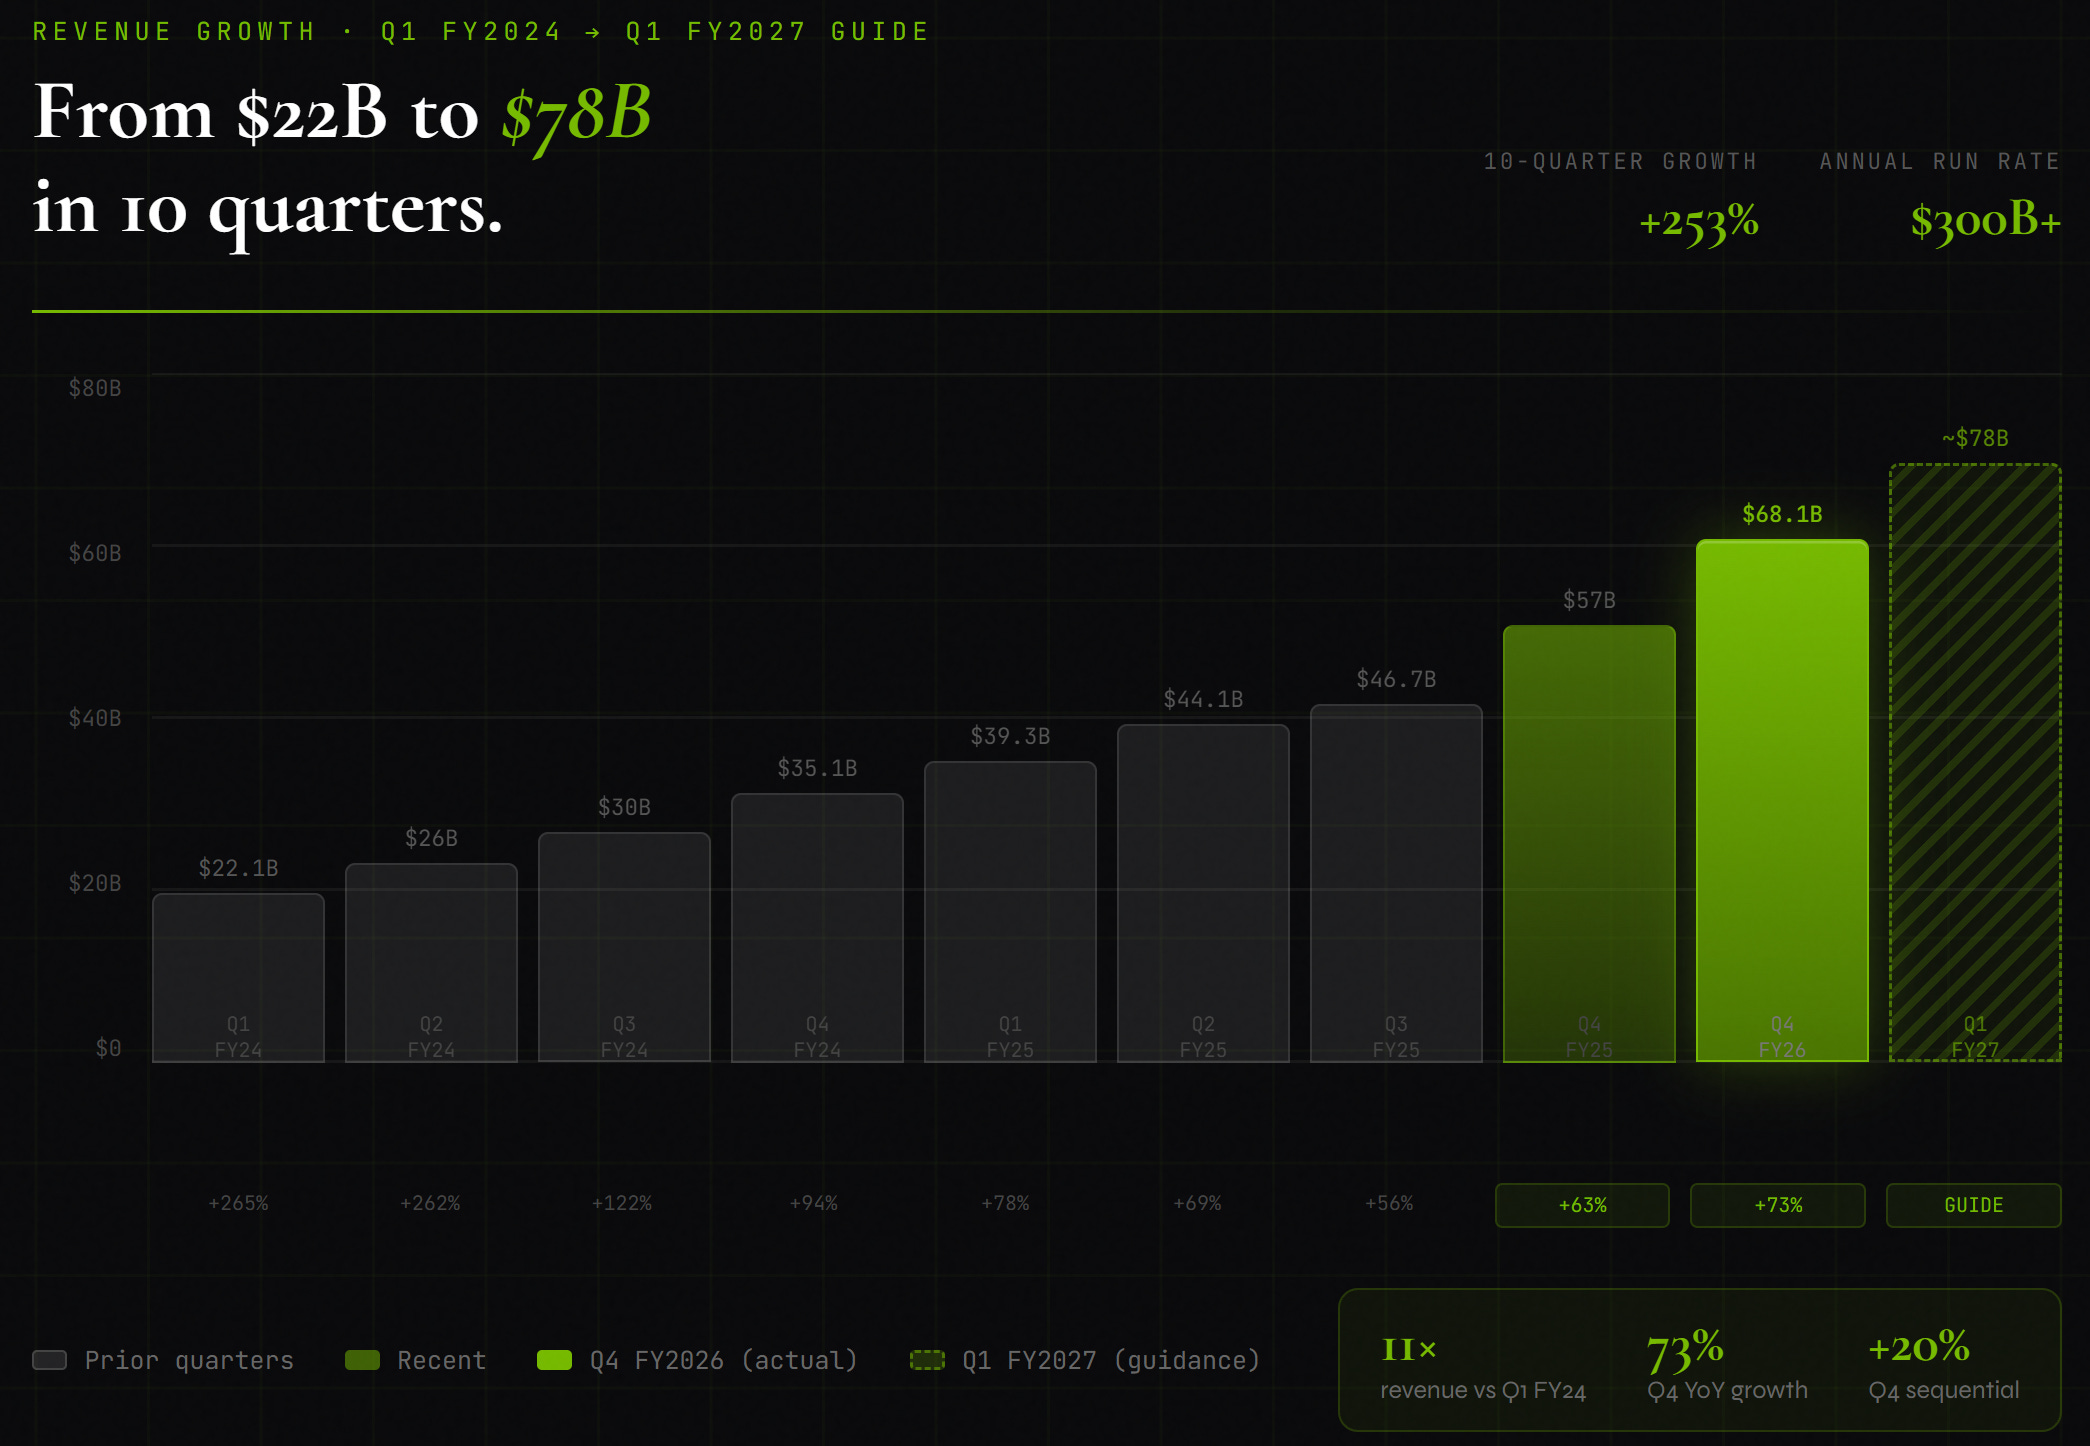
NVIDIA reported Q4 FY2026 revenue of $68.1 billion, up 73% year-over-year, beating analyst estimates of $66.2 billion.
Data center revenue hit a record $62.3 billion, now representing over 91% of total sales.
Q1 FY2027 guidance came in at $78 billion, materially above the consensus expectation of roughly $71-73 billion.
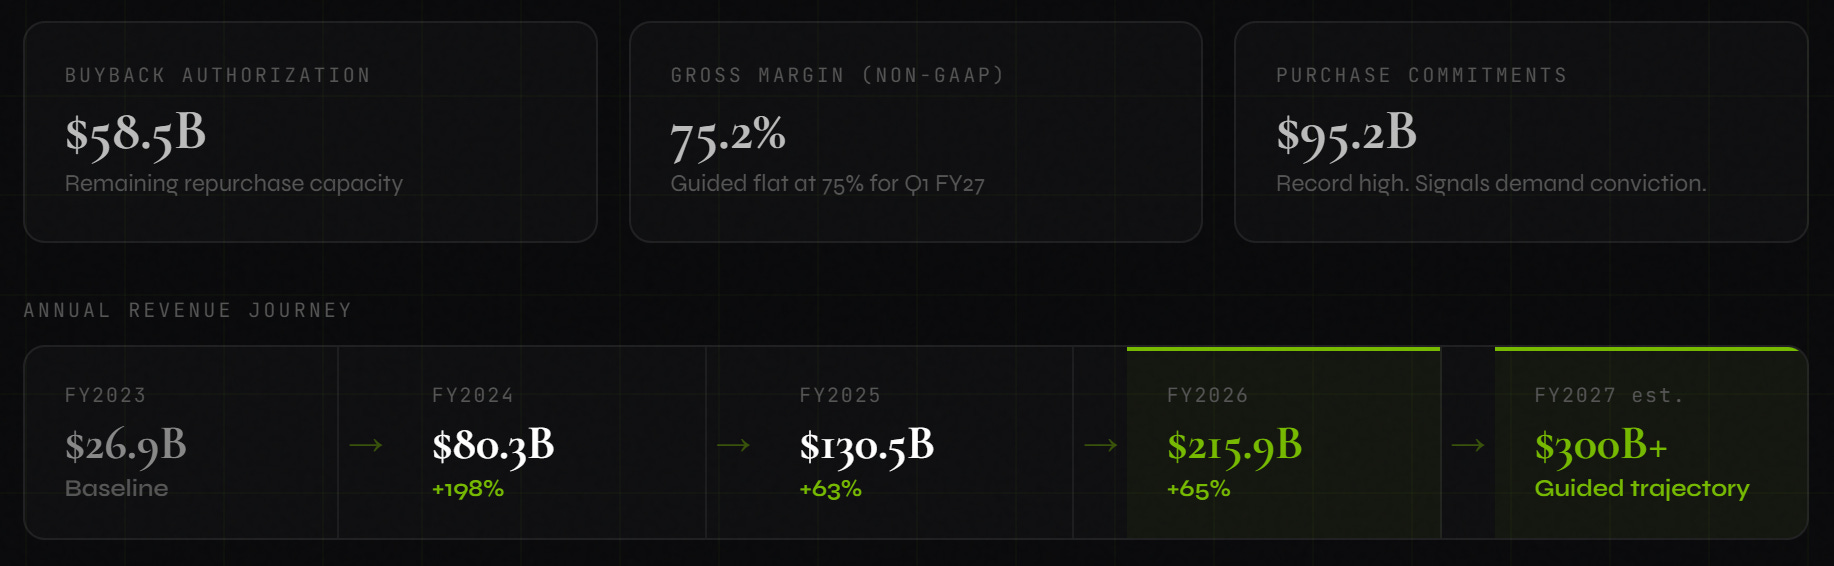
Full fiscal year FY2026 revenue was $215.9 billion, up 65% from the prior year.
Non-GAAP earnings per share of $1.62 beat estimates of $1.54.
The stock fell roughly 4.7% today on what is a classic “sell the news” reaction at elevated valuation.
The fundamental case for NVIDIA remains intact. The technical picture is at a decision point, not a breakdown.
The single most important level to watch is the $183-$184 support zone. Everything flows from whether it holds.
The Business: What NVIDIA Actually Sells Now
A lot of investors still think of NVIDIA as a chip company. It is, technically. But calling it a chip company in 2026 is like calling Amazon a bookstore in 2010.
What NVIDIA actually sells is the infrastructure layer for the artificial intelligence economy. Its GPUs, networking fabric, and software stack are the raw material every major AI system in the world runs on. The data center segment, which includes AI accelerators, networking hardware, and cloud computing infrastructure, generated $62.3 billion in a single quarter. For context, the entire company was doing $6 billion in quarterly revenue just 3 years ago.
That is not slow growth. That is a company that has been reconstructed from the inside out by a single technological shift.
The demand picture going into FY2027 is unusually clear. The four largest cloud providers, Alphabet, Amazon, Microsoft, and Meta, have collectively guided toward capital expenditure that could approach $700 billion in 2026. The majority of that is being directed at AI infrastructure. NVIDIA sits in the middle of that spending as the dominant supplier of the compute that makes it all run.
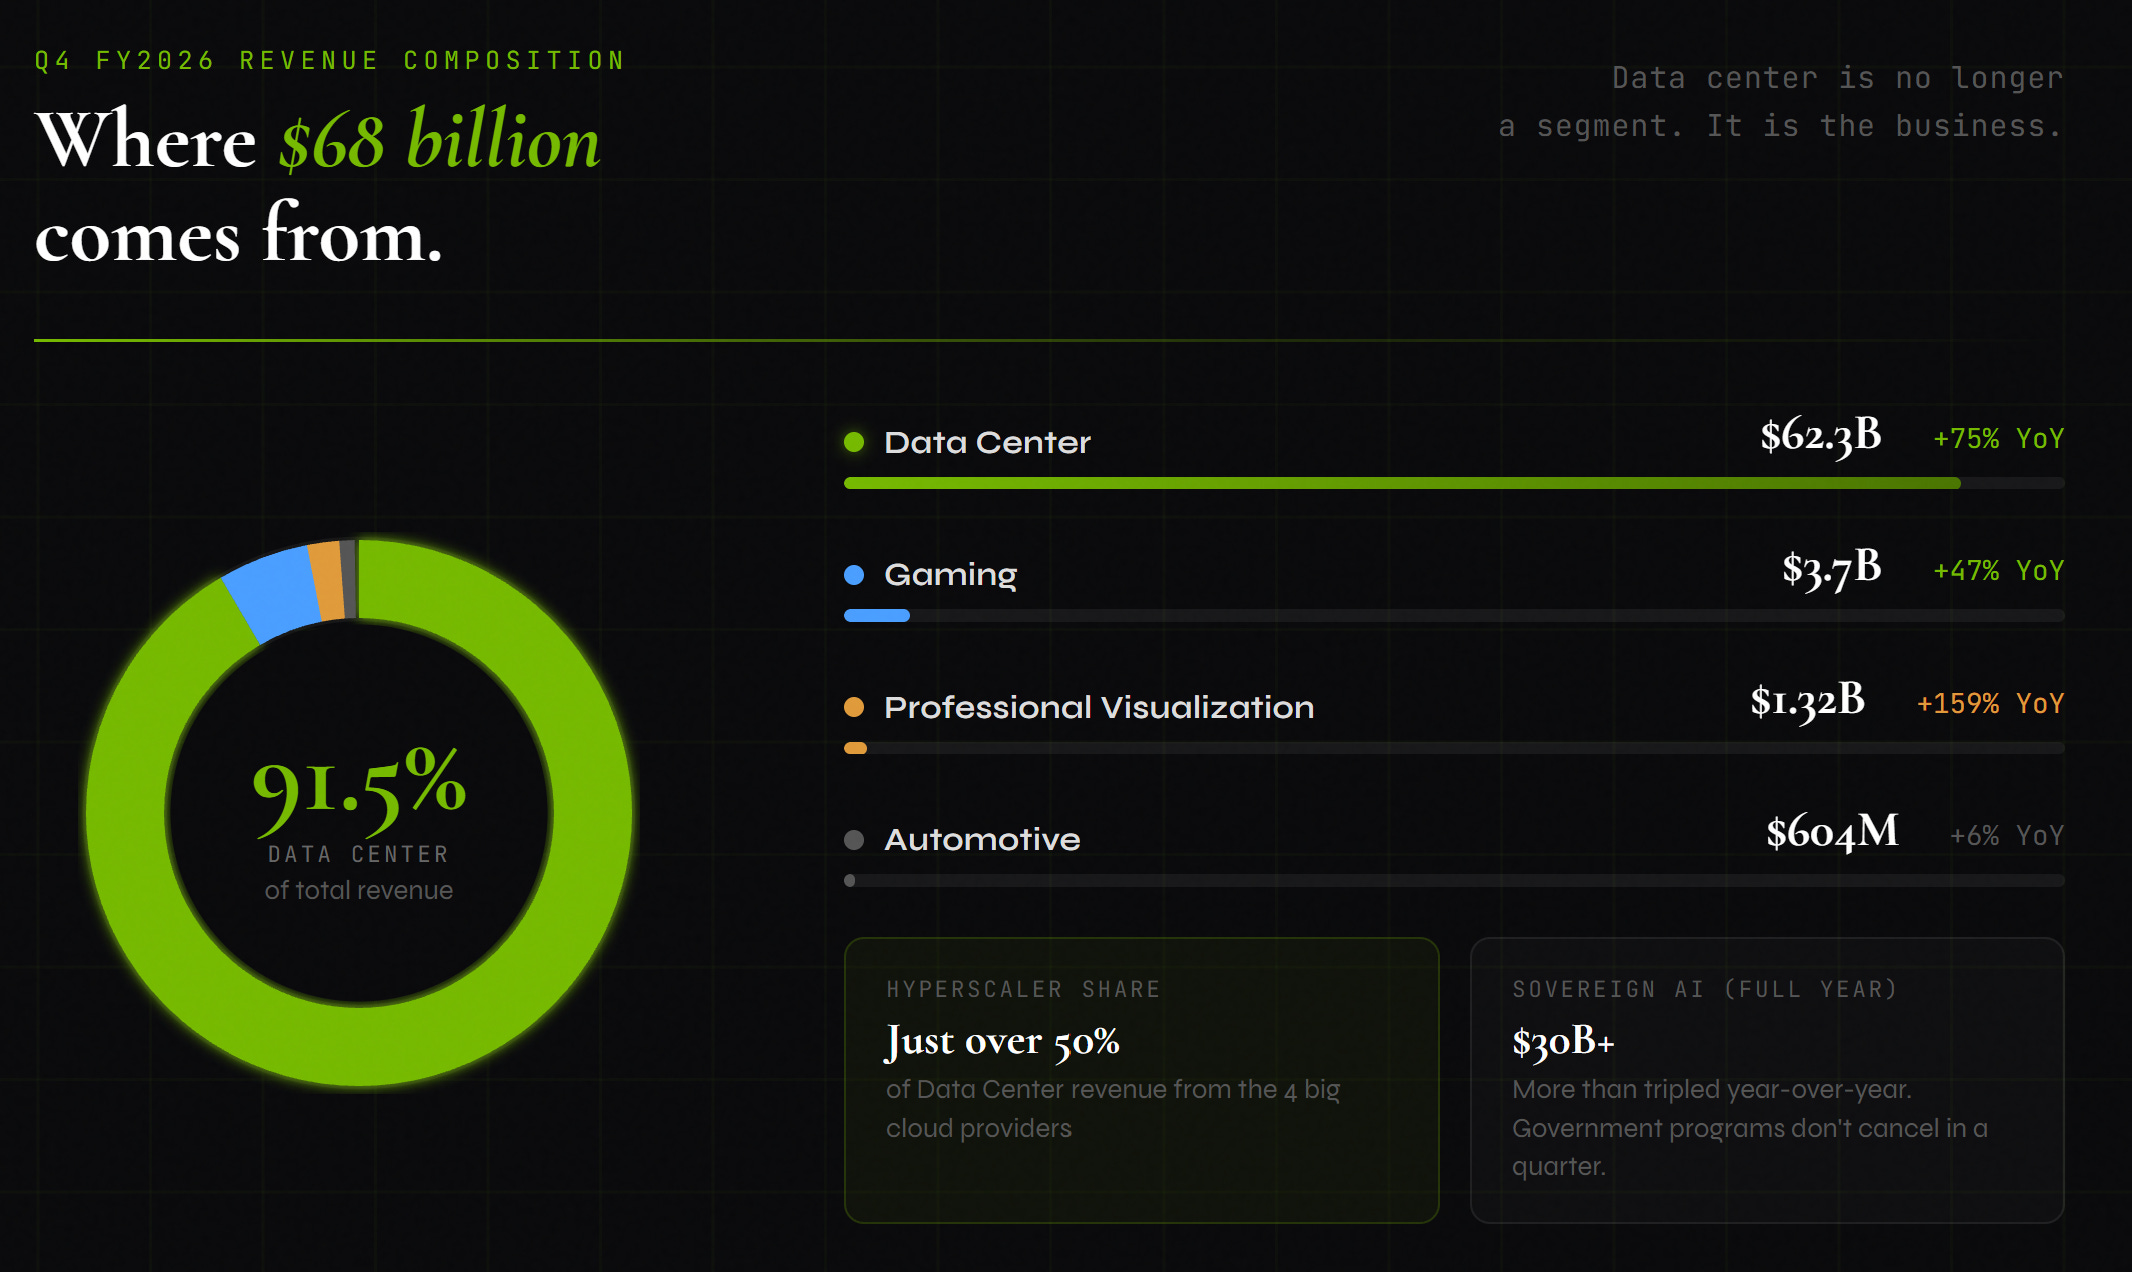
Hyperscalers, meaning those large cloud providers, accounted for just over 50% of NVIDIA’s data center revenue in Q4. The other 50% came from a diversified mix: sovereign AI programs, enterprise customers building private AI infrastructure, and cloud-native AI companies. That diversification matters. It means NVIDIA’s revenue base is broadening, not narrowing, even as the absolute numbers grow.
Sovereign AI is worth a specific mention because it often gets overlooked. Governments in Canada, France, the Netherlands, Singapore, and the United Kingdom are building national AI infrastructure, and NVIDIA supplies the hardware. Full-year sovereign AI revenue exceeded $30 billion and more than tripled year-over-year. These are long-term, politically supported programs. They don’t vanish in a single quarter.
The Blackwell architecture has been the engine of this growth cycle. NVIDIA’s current-generation GPU platform has ramped faster than expected, and the company confirmed this quarter that Blackwell Ultra is now performing significantly better on inference workloads than the prior Hopper generation. As agentic AI, meaning AI systems that autonomously execute multi-step tasks rather than just answer questions, becomes the dominant use case, compute requirements per task increase meaningfully. That is not a theoretical future. It is the current direction of every major AI product roadmap.
Vera Rubin is next. NVIDIA’s next-generation platform, which management says could deliver up to 10 times lower inference cost than Blackwell, shipped its first samples to customers this week. Production shipments are expected in the second half of 2026. AWS, Google Cloud, Microsoft Azure, and Oracle Cloud have already committed to deploying it. The product cycle is compressing to roughly one year, which means NVIDIA is not giving customers time to catch their breath between generations.
One structural note worth understanding: NVIDIA is a fabless semiconductor company. It designs chips but does not manufacture them. That asset-light model means the enormous capital expenditure required to build and run fabrication plants sits on Taiwan Semiconductor’s balance sheet, not NVIDIA’s. NVIDIA gets to collect high-margin revenue without the manufacturing capital intensity. That structure is a significant contributor to the free cash flow numbers discussed below.
On the supply chain side, NVIDIA is actively diversifying manufacturing beyond Taiwan. Blackwell GPUs are now being produced at TSMC’s facilities in Arizona, and rack assembly is happening at a new Foxconn facility in Mexico. This is both a political response to domestic manufacturing pressure and a genuine risk reduction move. The Taiwan Strait concentration risk, while still present, is being slowly reduced.
The one constraint worth watching is memory. High-bandwidth memory, the specialized memory chips that sit alongside the GPU and determine how much data the chip can process at once, is in tight supply globally. Most of that scarce capacity is being directed toward AI accelerators. NVIDIA’s gaming segment is already feeling the pinch, and management flagged that supply constraints will be a headwind there through Q1 FY2027 and beyond.
The Numbers: A Fundamental Picture That Demands Respect
Good investing requires being honest about numbers, both what they say and what they don’t.
Revenue growth:
Q4 FY2026 revenue: $68.1 billion, up 73% year-over-year and 20% sequentially.
Full-year FY2026 revenue: $215.9 billion, up 65% from FY2025’s roughly $130.5 billion.
Q1 FY2027 guidance: $78 billion, plus or minus 2%. That implies roughly 15% sequential growth continuing, and a run rate approaching $300 billion annualized.
The sequential reacceleration is the part analysts were most focused on. Revenue had grown 16% sequentially in Q4 FY2025, then decelerated modestly through the middle of FY2026. Q4’s 20% sequential growth, followed by a 15% guide for Q1, signals the Blackwell ramp has not plateaued.
Profitability:
Non-GAAP gross margin: 75.2% in Q4, guided at roughly 75% for Q1 FY2027. Stable and healthy.
Net income: $43 billion in Q4, nearly doubling from $22.1 billion in the same quarter last year.
GAAP diluted EPS: $1.76 for the quarter, up from $0.89 a year ago.
Non-GAAP EPS: $1.62, beating the $1.54 consensus.
Full-year FY2026 GAAP diluted EPS: $4.90.
The gross margin story is important to understand in context. There was a temporary compression to roughly 60% in Q2 FY2025 driven by inventory write-downs during the Hopper-to-Blackwell transition. Margins then V-shaped back to the 73-75% range and have held there. This is a company that can manage product cycle transitions without permanent margin damage.
Cash generation:
Operating cash flow: Roughly $23-27 billion per quarter in recent periods.
Free cash flow: Roughly $22 billion in Q4 FY2025, with similar trajectory expected.
Annualized free cash flow is running at roughly $80-100 billion.
That is one of the largest free cash flow generation profiles in the history of public equity markets. The company returned $41.1 billion to shareholders in FY2026 through buybacks and dividends, and has $58.5 billion remaining on its repurchase authorization.
Balance sheet:
Cash and short-term investments exceeded $60 billion by late 2025.
Long-term debt: approximately $8.5 billion, extremely modest relative to earnings power.
Purchase commitments: $95.2 billion, the largest on record. This represents supplier-side obligations NVIDIA has made to secure future supply. It signals management’s confidence in sustained demand. It also represents financial exposure if demand softens unexpectedly.
Valuation: At around $185, NVIDIA trades at roughly 48 times trailing GAAP earnings. On a forward basis, if FY2027 revenue approaches the $300 billion annualized run rate implied by Q1 guidance, and net margins hold near 60%, the forward earnings picture improves materially. A company still growing 60-70% annually at this scale commands a premium multiple. Whether that premium is reasonable depends entirely on your view of the AI capex cycle’s durability.
One methodological note: NVIDIA will begin including stock-based compensation in its non-GAAP results starting Q1 FY2027. This is an accounting reclassification, not a fundamental change. But it will mechanically compress reported non-GAAP EPS and require Wall Street consensus to be recalibrated. Expect some short-term confusion as forward estimates get revised.
A word on the Cisco comparison that has been circulating today: the parallel to Cisco in 2001, where massive purchase commitments preceded a $2.2 billion inventory write-down, is worth taking seriously rather than dismissing. The key distinction is that Cisco built inventory for a telecom buildout that was several years ahead of actual revenue generation. NVIDIA’s customers are buying compute for AI applications that are generating real, measurable economic returns today: advertising efficiency improvements, productivity tools, autonomous systems. That does not make NVIDIA immune to a demand slowdown. It does mean the comparison is imperfect.
NVIDIA’s business is operating at a level with few historical parallels. Revenue growth is reaccelerating, margins are stable, free cash flow is extraordinary, and the pipeline is visibly full. The stock is not cheap by conventional measures, but the conventional measures were not designed for a company growing at this velocity. The fundamental case for patient long-term ownership remains intact.
The Technical Picture: At a Decision Point, Not a Breakdown
Price tells a story independent of earnings, and right now the price story is at a genuinely interesting juncture.
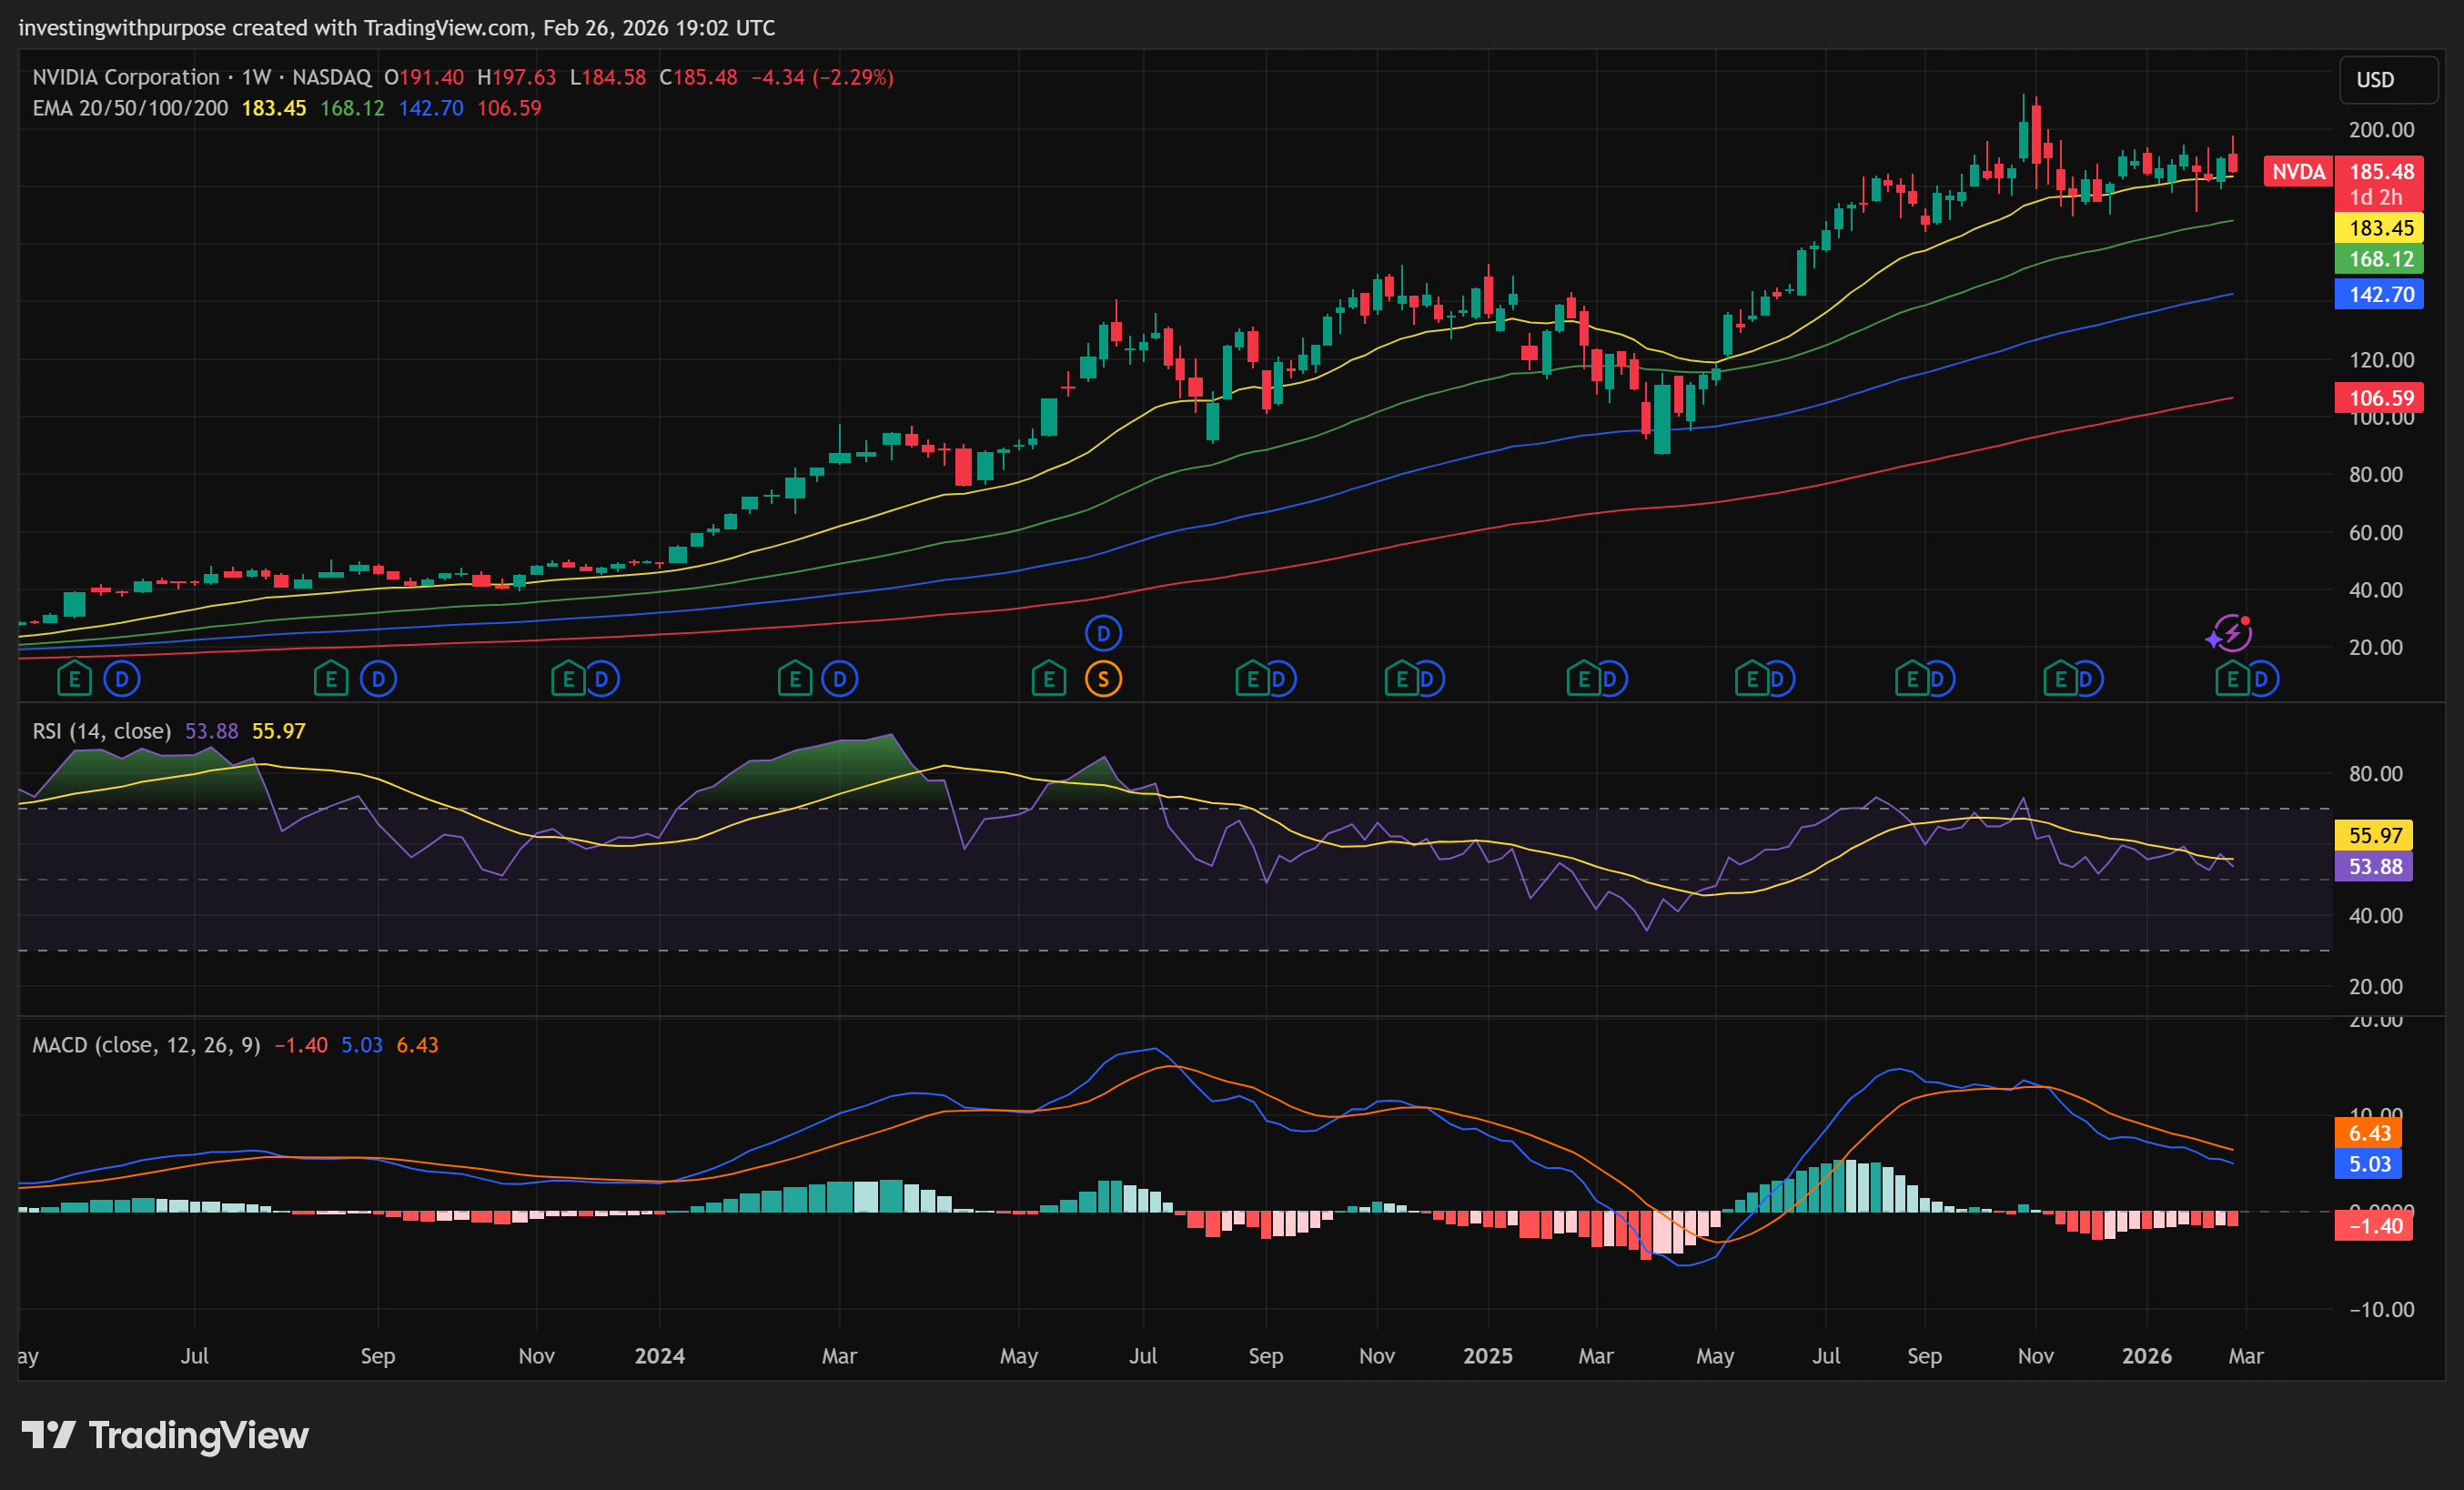
The long-term structure is constructive. NVIDIA rallied 144% from its May 2025 low of $86.62 to the all-time high of $212.19 on October 29, 2025. Since that peak, the stock has spent roughly 82 sessions in a tight consolidation range, oscillating between roughly $169 and $207. The average closing price during that entire period sits at about $186, with surprisingly low volatility. The stock has been coiling.
That kind of post-impulse compression is normal and healthy. Markets need time to digest large moves. What has made this consolidation technically significant is that buyers have consistently defended the zone around $183-$184, a level where five separate indicators converge simultaneously: the Ichimoku cloud baseline, the lower boundary of the cloud itself, a medium-term trend filter, the 100-period exponential moving average, and the 23.6% retracement of the entire May-to-November rally. Five signals pointing to the same price is not coincidence. It is a structural support level.
Today’s price action is worth examining carefully. The stock opened near yesterday’s close, immediately sold off, and spent most of the session declining. The intraday range was nearly $10. There was virtually no upper wick on the day’s candle, meaning sellers were in control from the opening bell. That is the signature of a “sell the news” event, not a fundamental breakdown: professionals who had positioned ahead of earnings using the elevated open to exit.
The important nuance is where the stock closed. The 50-period exponential moving average on the daily chart currently sits at $186.28. The closing price today is right around $185-186. Buyers defended that level. The intraday low of $184.58 approached, but did not breach, the $183-$184 support confluence on a closing basis. That distinction matters.
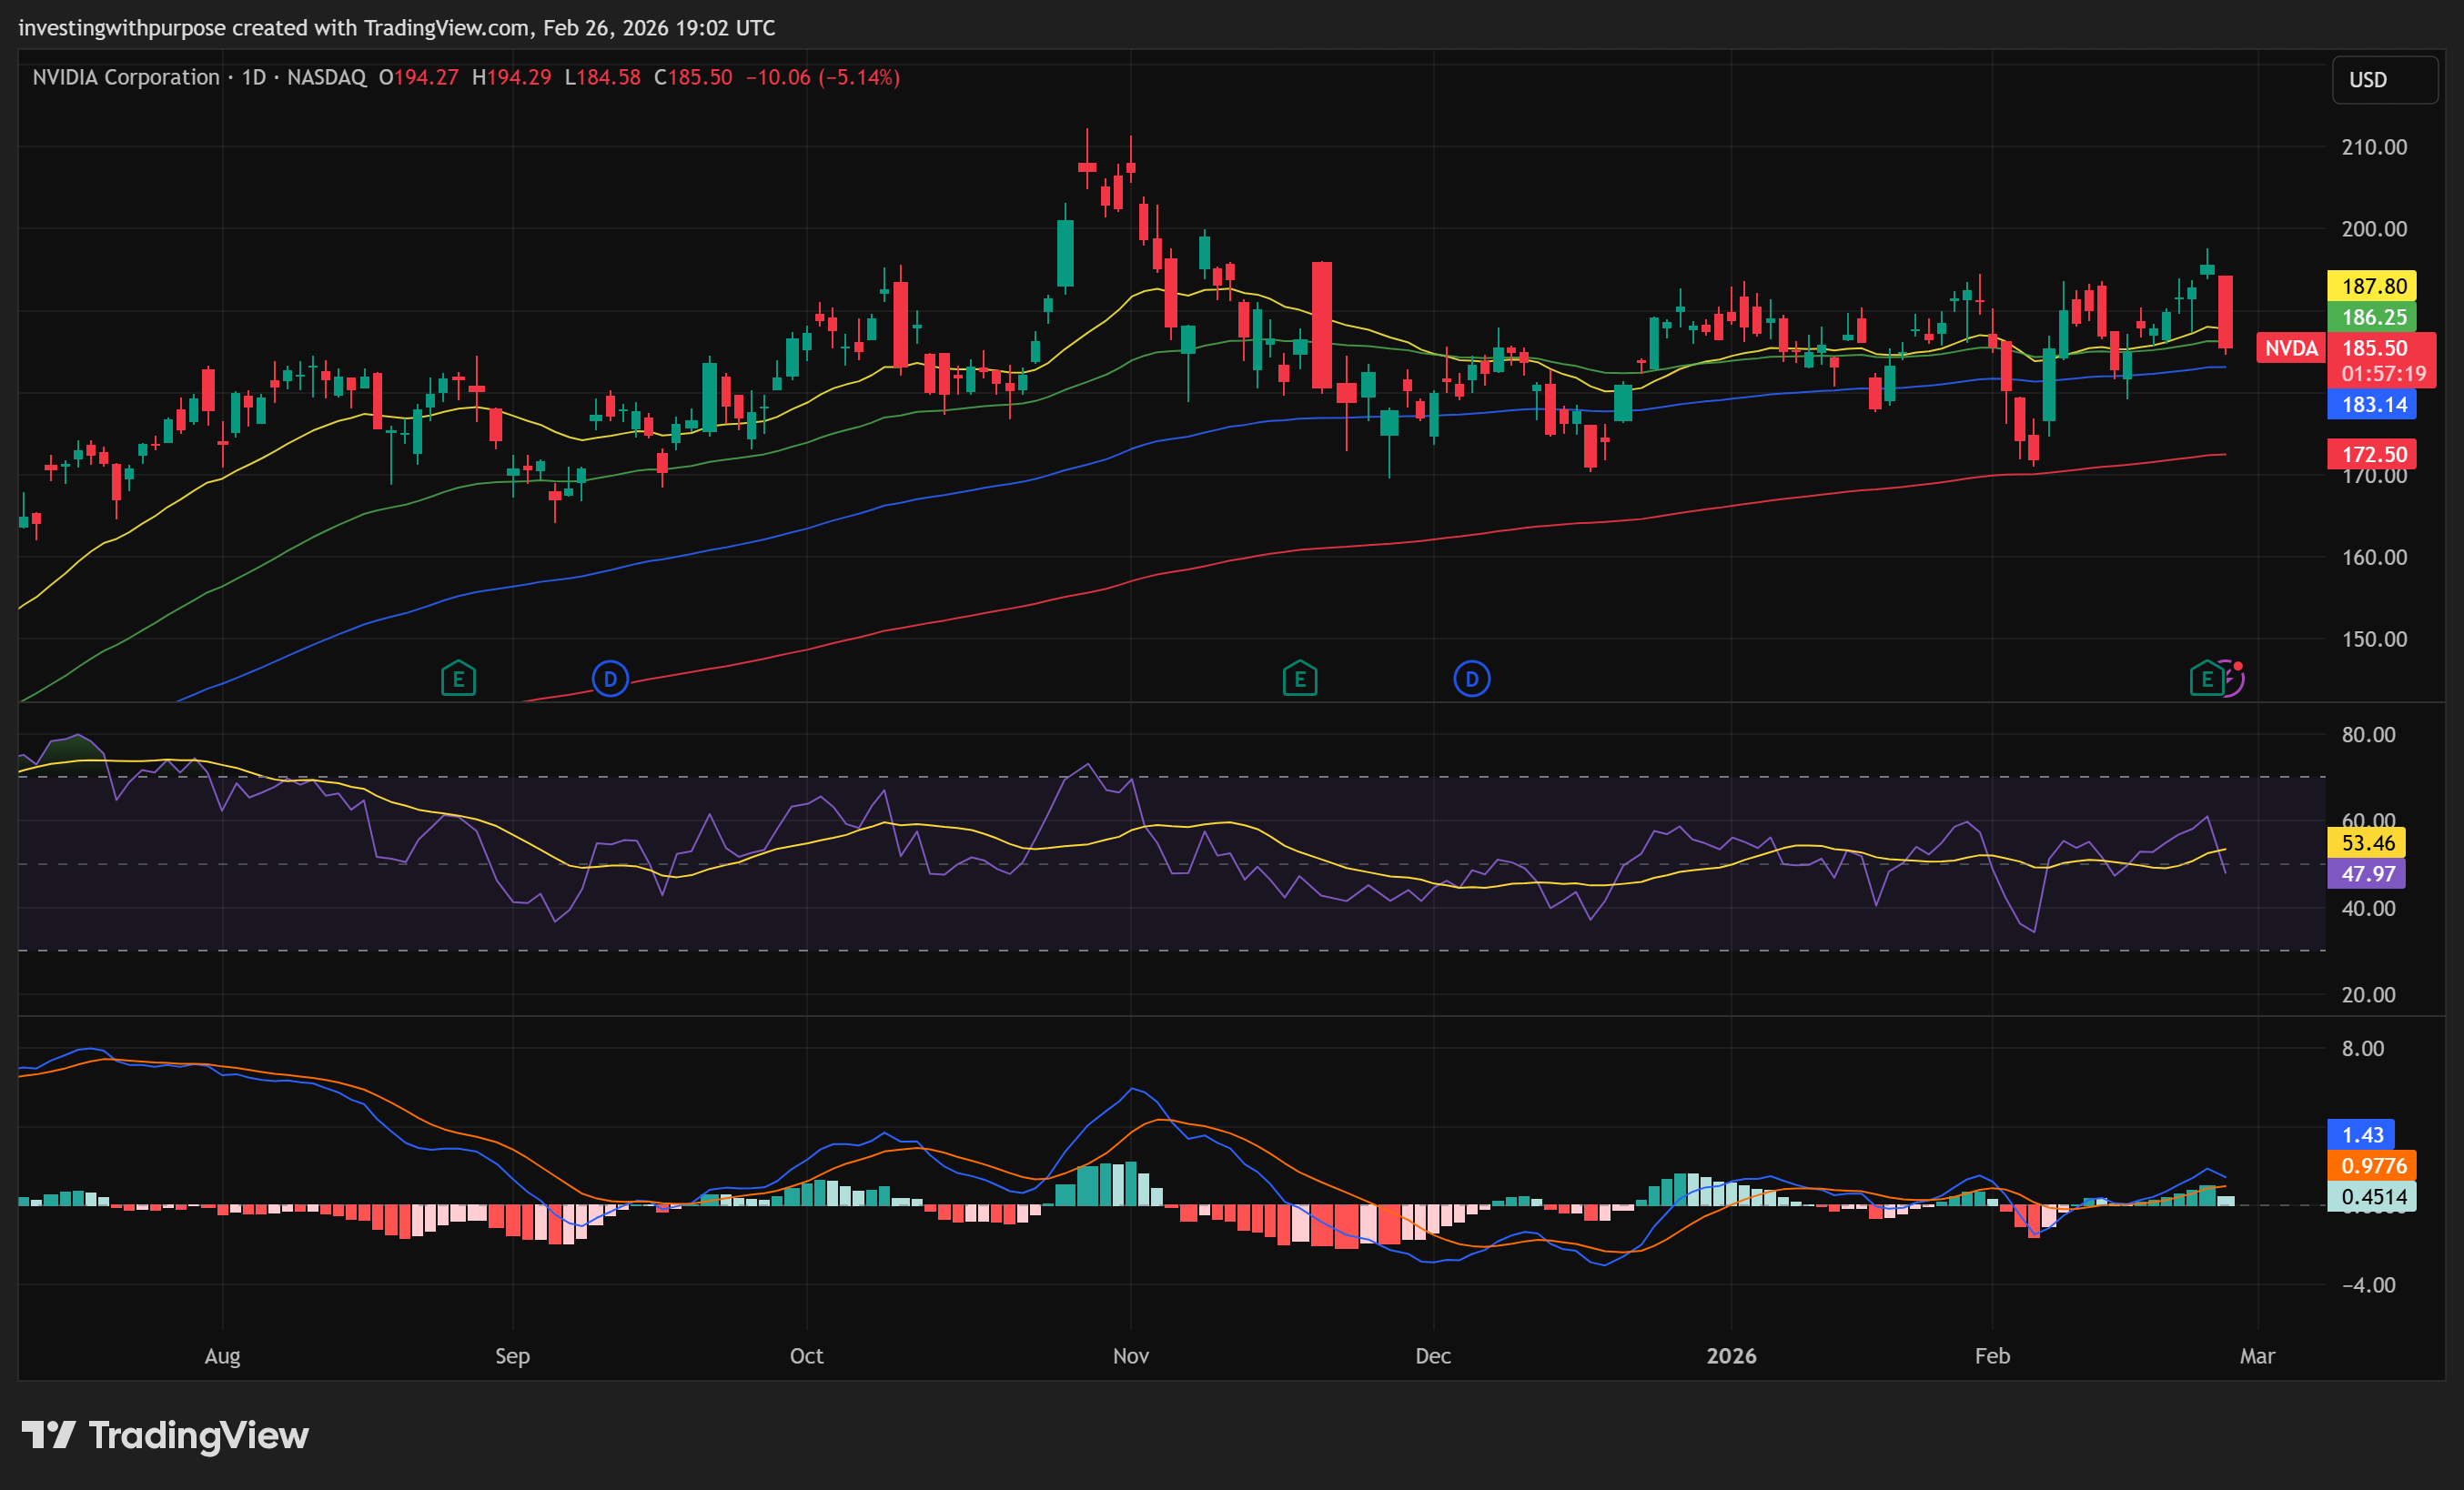
Short-term momentum has deteriorated. The RSI (a measure of relative price strength) dropped from overbought levels heading into earnings to just below neutral, around 49. The trend-following indicator known as MACD had been showing diminishing momentum even before today’s session, a subtle warning sign that the pre-earnings rally was running on thinning fuel. These are near-term caution signals, not structural breakdowns.
The medium and longer-term picture is substantially more encouraging. On a weekly basis, all four major moving averages are rising in healthy alignment, the momentum indicators are in neutral-to-bullish territory, and the volume profile suggests accumulation rather than distribution. Long-term holders have not been selling at scale.
There is also a scenario framework worth considering. The May-to-November impulse looks structurally like a third wave in a larger move. The post-ATH consolidation has the characteristics of a fourth wave correction: contained, sideways, not deeply retracing the prior move. If that framework is correct, the stock would be building a base for a fifth and final wave higher, with potential targets ranging from roughly $276 to $342 depending on the extension. These are not price predictions. They are scenarios that help frame where the next significant resistance would emerge if the bull trend resumes.
The one indicator that stands out most for medium-term traders is the ADX, which measures trend strength. At roughly 10, it is near its lowest reading in recent memory. An ADX that low tells you the market is not trending in any direction. It is coiling. Low ADX environments historically precede explosive directional moves. The direction is not yet determined. But the energy is building.
The stock is not broken. It is at a decision point. The $183-$184 support zone is the line that separates a normal post-earnings dip from something more concerning. As long as that zone holds on a closing basis, the technical damage from today is contained, and the longer-term structure remains favorable for patient buyers.
Our Trade Plan
This is where structure matters more than enthusiasm. The most important principle: define your stop before you define your entry. Position size flows from risk, never from conviction.
