

It all starts in 1202, when an Italian mathematician named Leonardo Fibonacci introduced Europe to a puzzling sequence of numbers. You’ve probably seen it:
0, 1, 1, 2, 3, 5, 8, 13, 21…
Each number is the sum of the two before it. Simple. But the ratio between these numbers - roughly 1.618, the "Golden Ratio" - started appearing everywhere. In seashells, galaxies, human proportions… and, as traders discovered, in price charts.
Why Should You Care?
Markets are made of human behavior, and human behavior tends to move in waves - bursts of greed and fear. Those waves often retrace or extend in Fibonacci ratios:
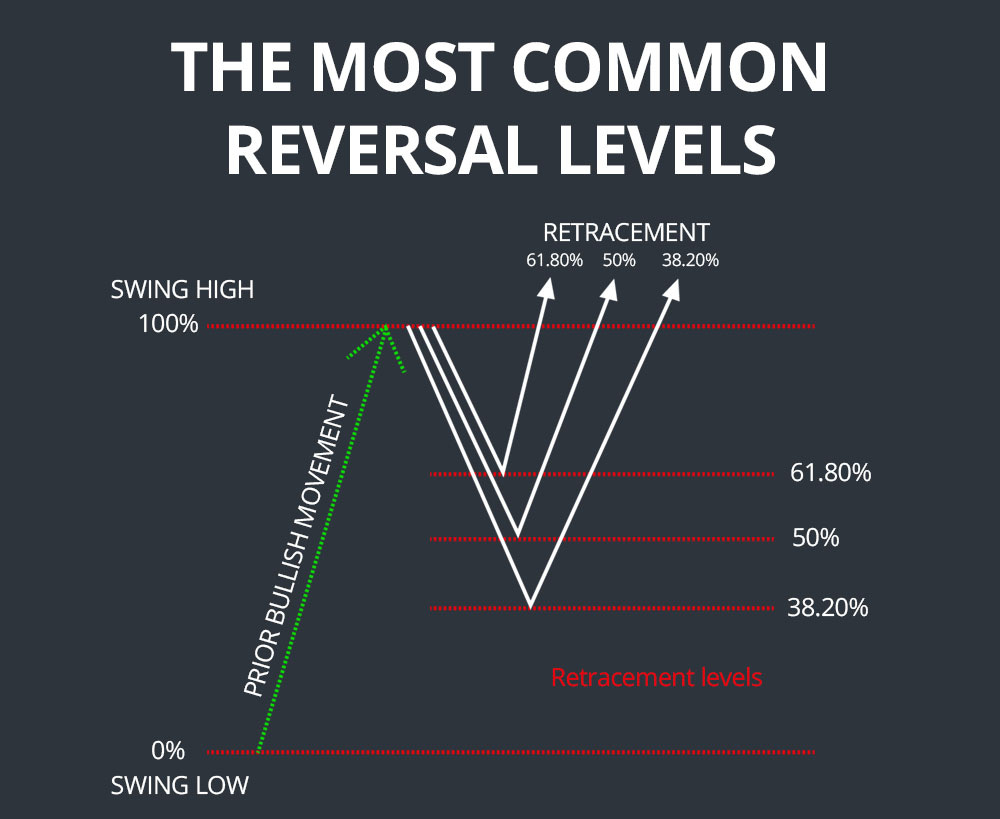
A strong rally? Expect it to give some ground - maybe 38.2%, 50%, or 61.8% of the move.
An extension? Watch for price to target 127.2% or 161.8% of the prior leg.
It doesn’t work because it’s magic. It works because enough people watch and respect these levels, making them self-fulfilling.
A Story You Can See on a Chart
Imagine a stock rising sharply from $100 to $150. The rally stalls. Where might the next wave of buyers step in? Traders draw a Fibonacci retracement from the low to the high. Suddenly:
The 38.2% retracement is at $130.
The 50% retracement is at $125.
The 61.8% retracement is at $119.
The price often finds support right at one of these levels. Not because of some cosmic force, but because traders expect it.
The Bigger Picture
These ratios also project forward. If a stock breaks out of its range, Fibonacci extensions point to potential targets. What starts as a line becomes a roadmap.
The Takeaway:
Fibonacci isn’t a crystal ball. It’s a lens - one that lets you understand how crowds behave and where price might pause, retrace, or extend. It's a tool rooted in math, shaped by nature, and embraced by markets for one reason:
Humans tend to move in patterns, and Fibonacci gives you a way to spot them before they happen.