
Fintech’s Crossroads: SoFi, Block, and PayPal through a trader’s lens
Three leaders. One crowded lane. What the charts and the cash flows really say right now.

Digital finance is past its hype cycle and deep into the execution era. Interest rates are still restrictive, consumer spend is cooling in pockets, and competition is relentless. That mix is forcing every fintech to show real operating discipline while keeping growth optionality alive. In this note we walk through the industry setup and then stack SoFi SOFI 0.00%↑, Block XYZ 0.00%↑, and PayPal PYPL 0.00%↑ side by side using technicals and fundamentals. The goal is a plain-English, confident read that helps both investors and traders pick their spots with a risk-aware plan.

Key takeaways
This sector is not broken. It is repriced. Higher rates and tighter competition reward businesses with cash, distribution, and discipline.
PYPL throws off cash and carries net cash. It needs execution wins in branded checkout and unbranded mix to re-rate.
XYZ is coiling at support with improving profitability. A clean break above the high-70s can trend.
SOFI is a bank-platform in an equity wrapper. Support is defined and momentum pauses are healthy, but funding and credit quality remain the key watch items.
For traders, levels matter more than narratives right now. For investors, balance sheet strength and free cash flow separate leaders from followers.
Pipelines
Consumer rails are stable but not booming. Card volumes and small business GPV trends remain resilient, yet directionally slower than the 2021–2023 snapback.
Embedded finance keeps expanding. Cash App style ecosystems, PayPal’s checkout ubiquity, and SoFi’s full-stack bank model will keep pulling share from legacy players.
AI is creeping into fraud, underwriting, and support. It won’t move near-term P&L by itself, but it can lift unit economics over the next 6 to 12 quarters.
Regulation is the watch item. Bank-like balance sheets and interchange economics are squarely in the frame. Capital cushions and funding costs matter more than slogans.
M&A optionality is back on the table for niche capabilities and data assets, not for empire building.
Fundamental analysis
Industry and macro frame
Rates and credit: Higher for longer translates into stickier deposit costs, tighter underwriting, and a higher hurdle for discretionary spend. Net interest income helps banks like SoFi, while take-rate businesses like PayPal and Block stay tied to nominal commerce and mix.
Consumer health: Employment is fine, savings buffers are thinner, and cohorts are normalizing. Bad debt is not spiking, but it is trending up from 2023 troughs.
Competition: Apple Pay growth, Shopify’s checkout, Stripe at scale, and bank-owned networks keep pricing power in check. Product quality and ecosystem lock-in matter.
PayPal
Latest revenue about 8,288 with cost of revenues 4,857 and gross profit near 3,431. Gross margin about 41 percent.
Net income to common about 1,261. Net margin about 15 percent.
Balance sheet shows cash and equivalents near 6,688 plus short-term investments near 3,320. Total assets near 79,777 with total liabilities near 59,576. Net cash position looks healthy.
Cash flow shows cash from operations near 898 and capital expenditures about 206 outflow, implying free cash flow near 1,104.
Takeaway: Durable, scaled cash machine with solid margins and a net cash cushion. Growth is steady rather than explosive and pricing power is bounded by checkout competition.
Block
Latest revenue about 6,055 with a gross margin just over 42%
Net income to company about 538.
Cash and equivalents near 6,384 plus about 397 of short-term investments.
Cash from operations about 374 with capex about 31, suggesting free cash flow near 406.
Takeaway: Two-engine model still works. Seller GPV and Cash App monetization balance each other. Operating leverage is improving, but results remain rate-sensitive and execution-dependent.
SoFi
Net income to company about 97 for the latest period.
Cash and equivalents near 2,122. Total assets near 41,112 and total liabilities near 34,252.
Cash from operations shows a negative figure in the latest period with capex modest, implying negative free cash flow.
Takeaway: Bank-platform story with real scale and growing profitability, but balance-sheet dynamics and funding costs make risk management central. The equity still trades on credibility of sustained profitability and credit discipline.
Technical analysis
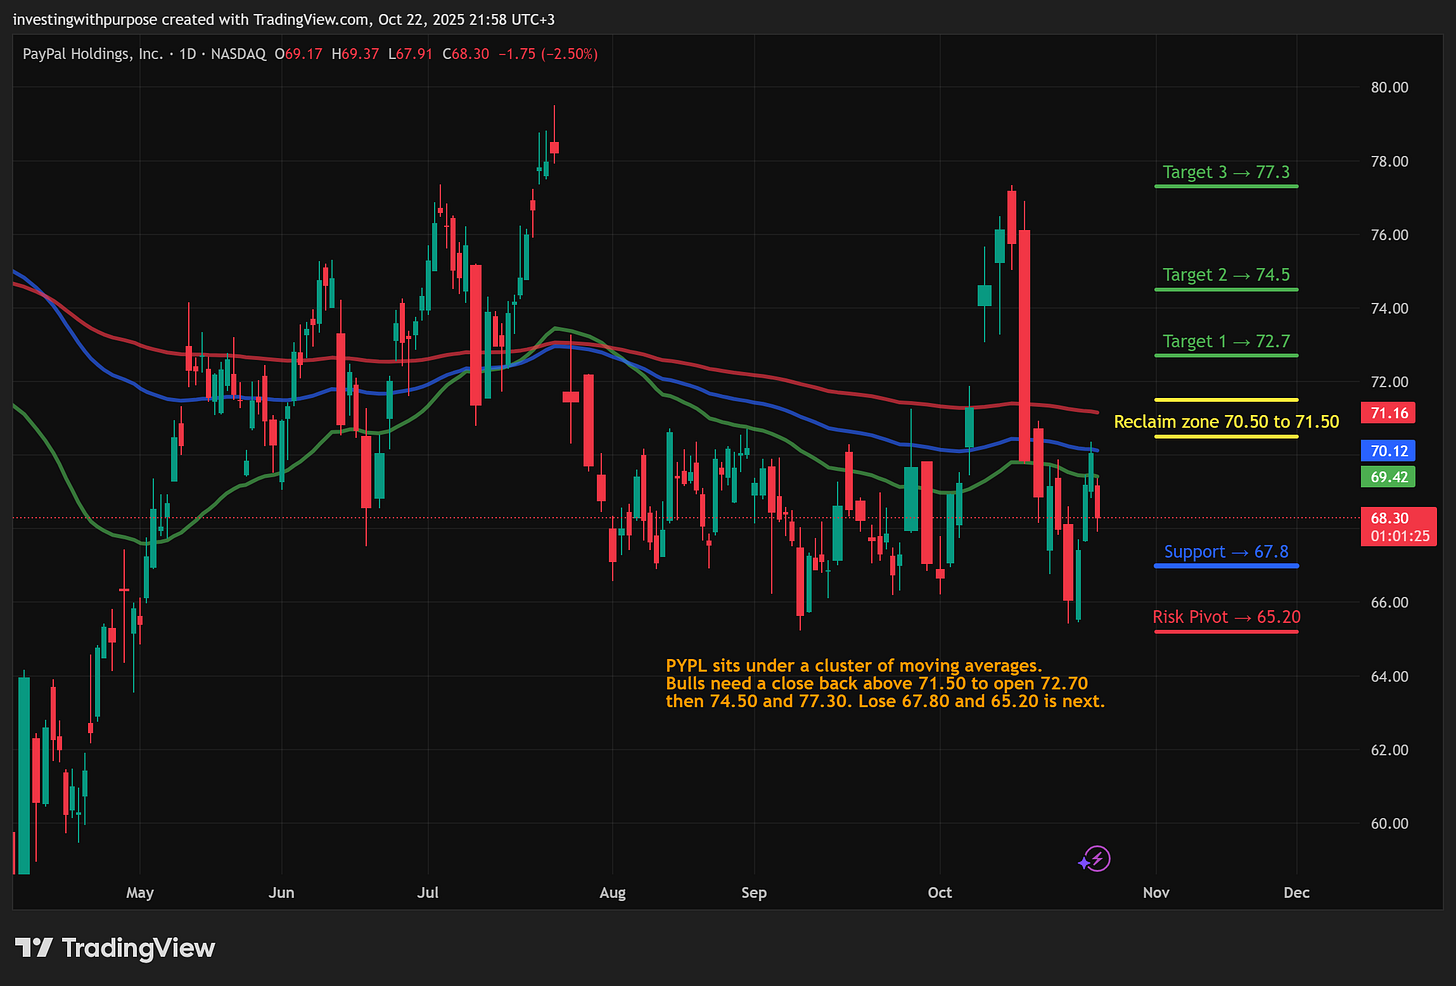
PayPal
Price boxed between 67 and 71 with the 20, 50, 100, and 200 day EMAs stacked just above price near 69 to 71. Daily cloud overhead near 71 to 72. Bias is range to down unless price closes back above the cloud.
Fibonacci map shows supports near 67.8 then 65.2 and rebound targets at 72.7 then 74.5 then 77.3.
RSI near the mid-40s, MACD sub-zero, ADX soft. Take signals, don’t force trends.
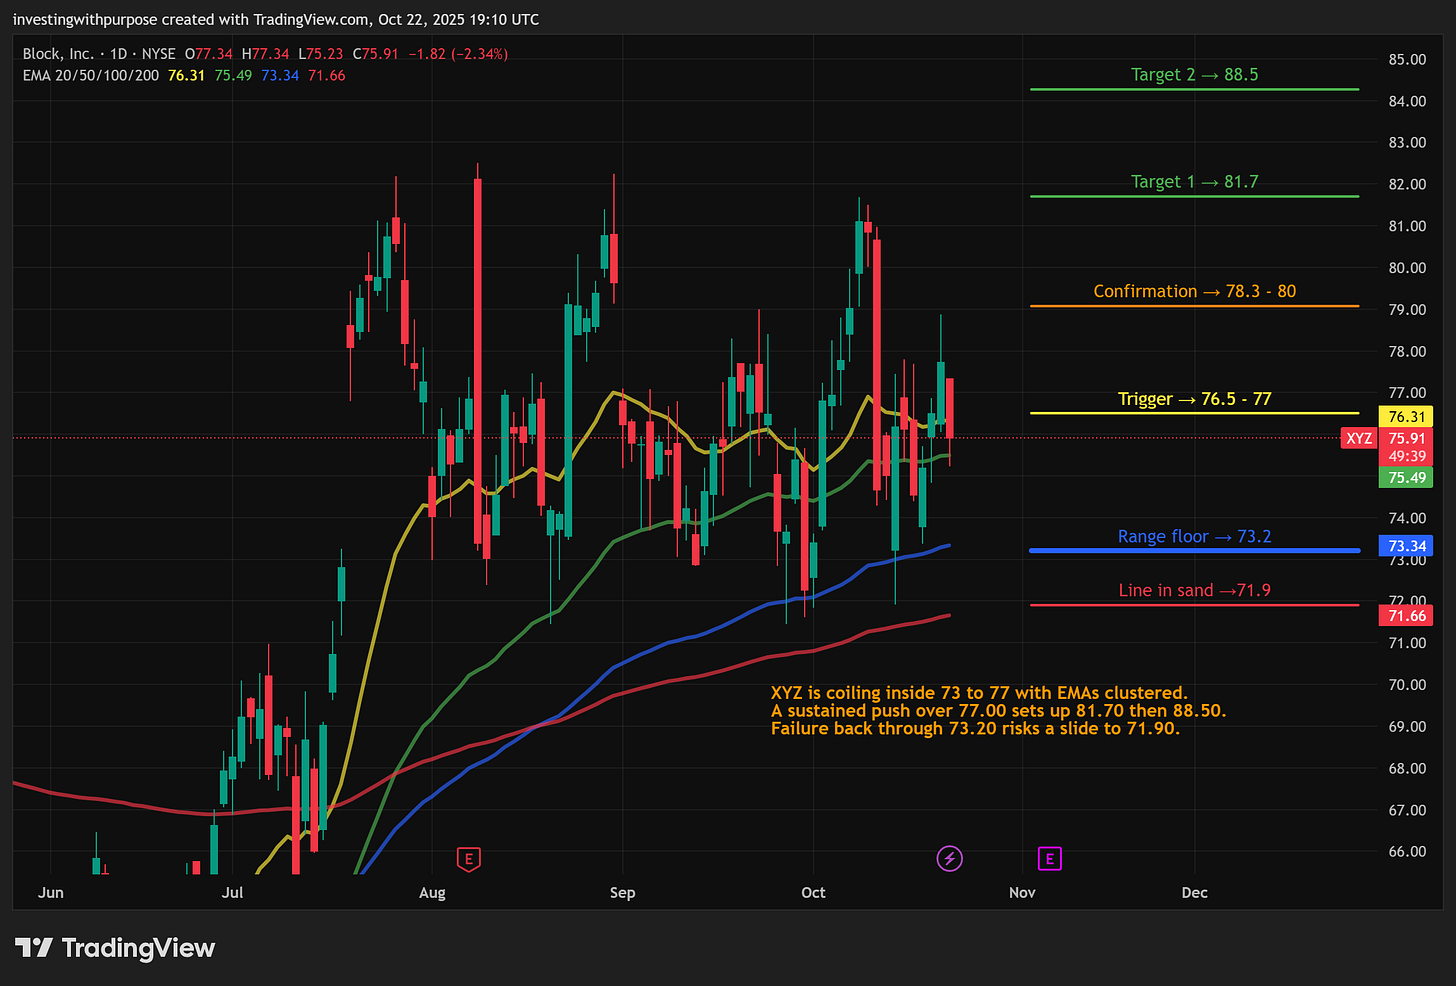
Block
Range between 73 and 77 with EMAs clustering 71 to 76. Daily Ichimoku shows price inside a flat cloud near 75 to 76.
Fib resistance near 76.5 to 77 then 78 to 80. Break and hold 77 to 78 opens 81.7 then 88.5 then 97.5 on extensions. Lose 73 and the next shelves are 71.9 then 67.9.
Momentum sideways. Plan the breakout, trade the retest.

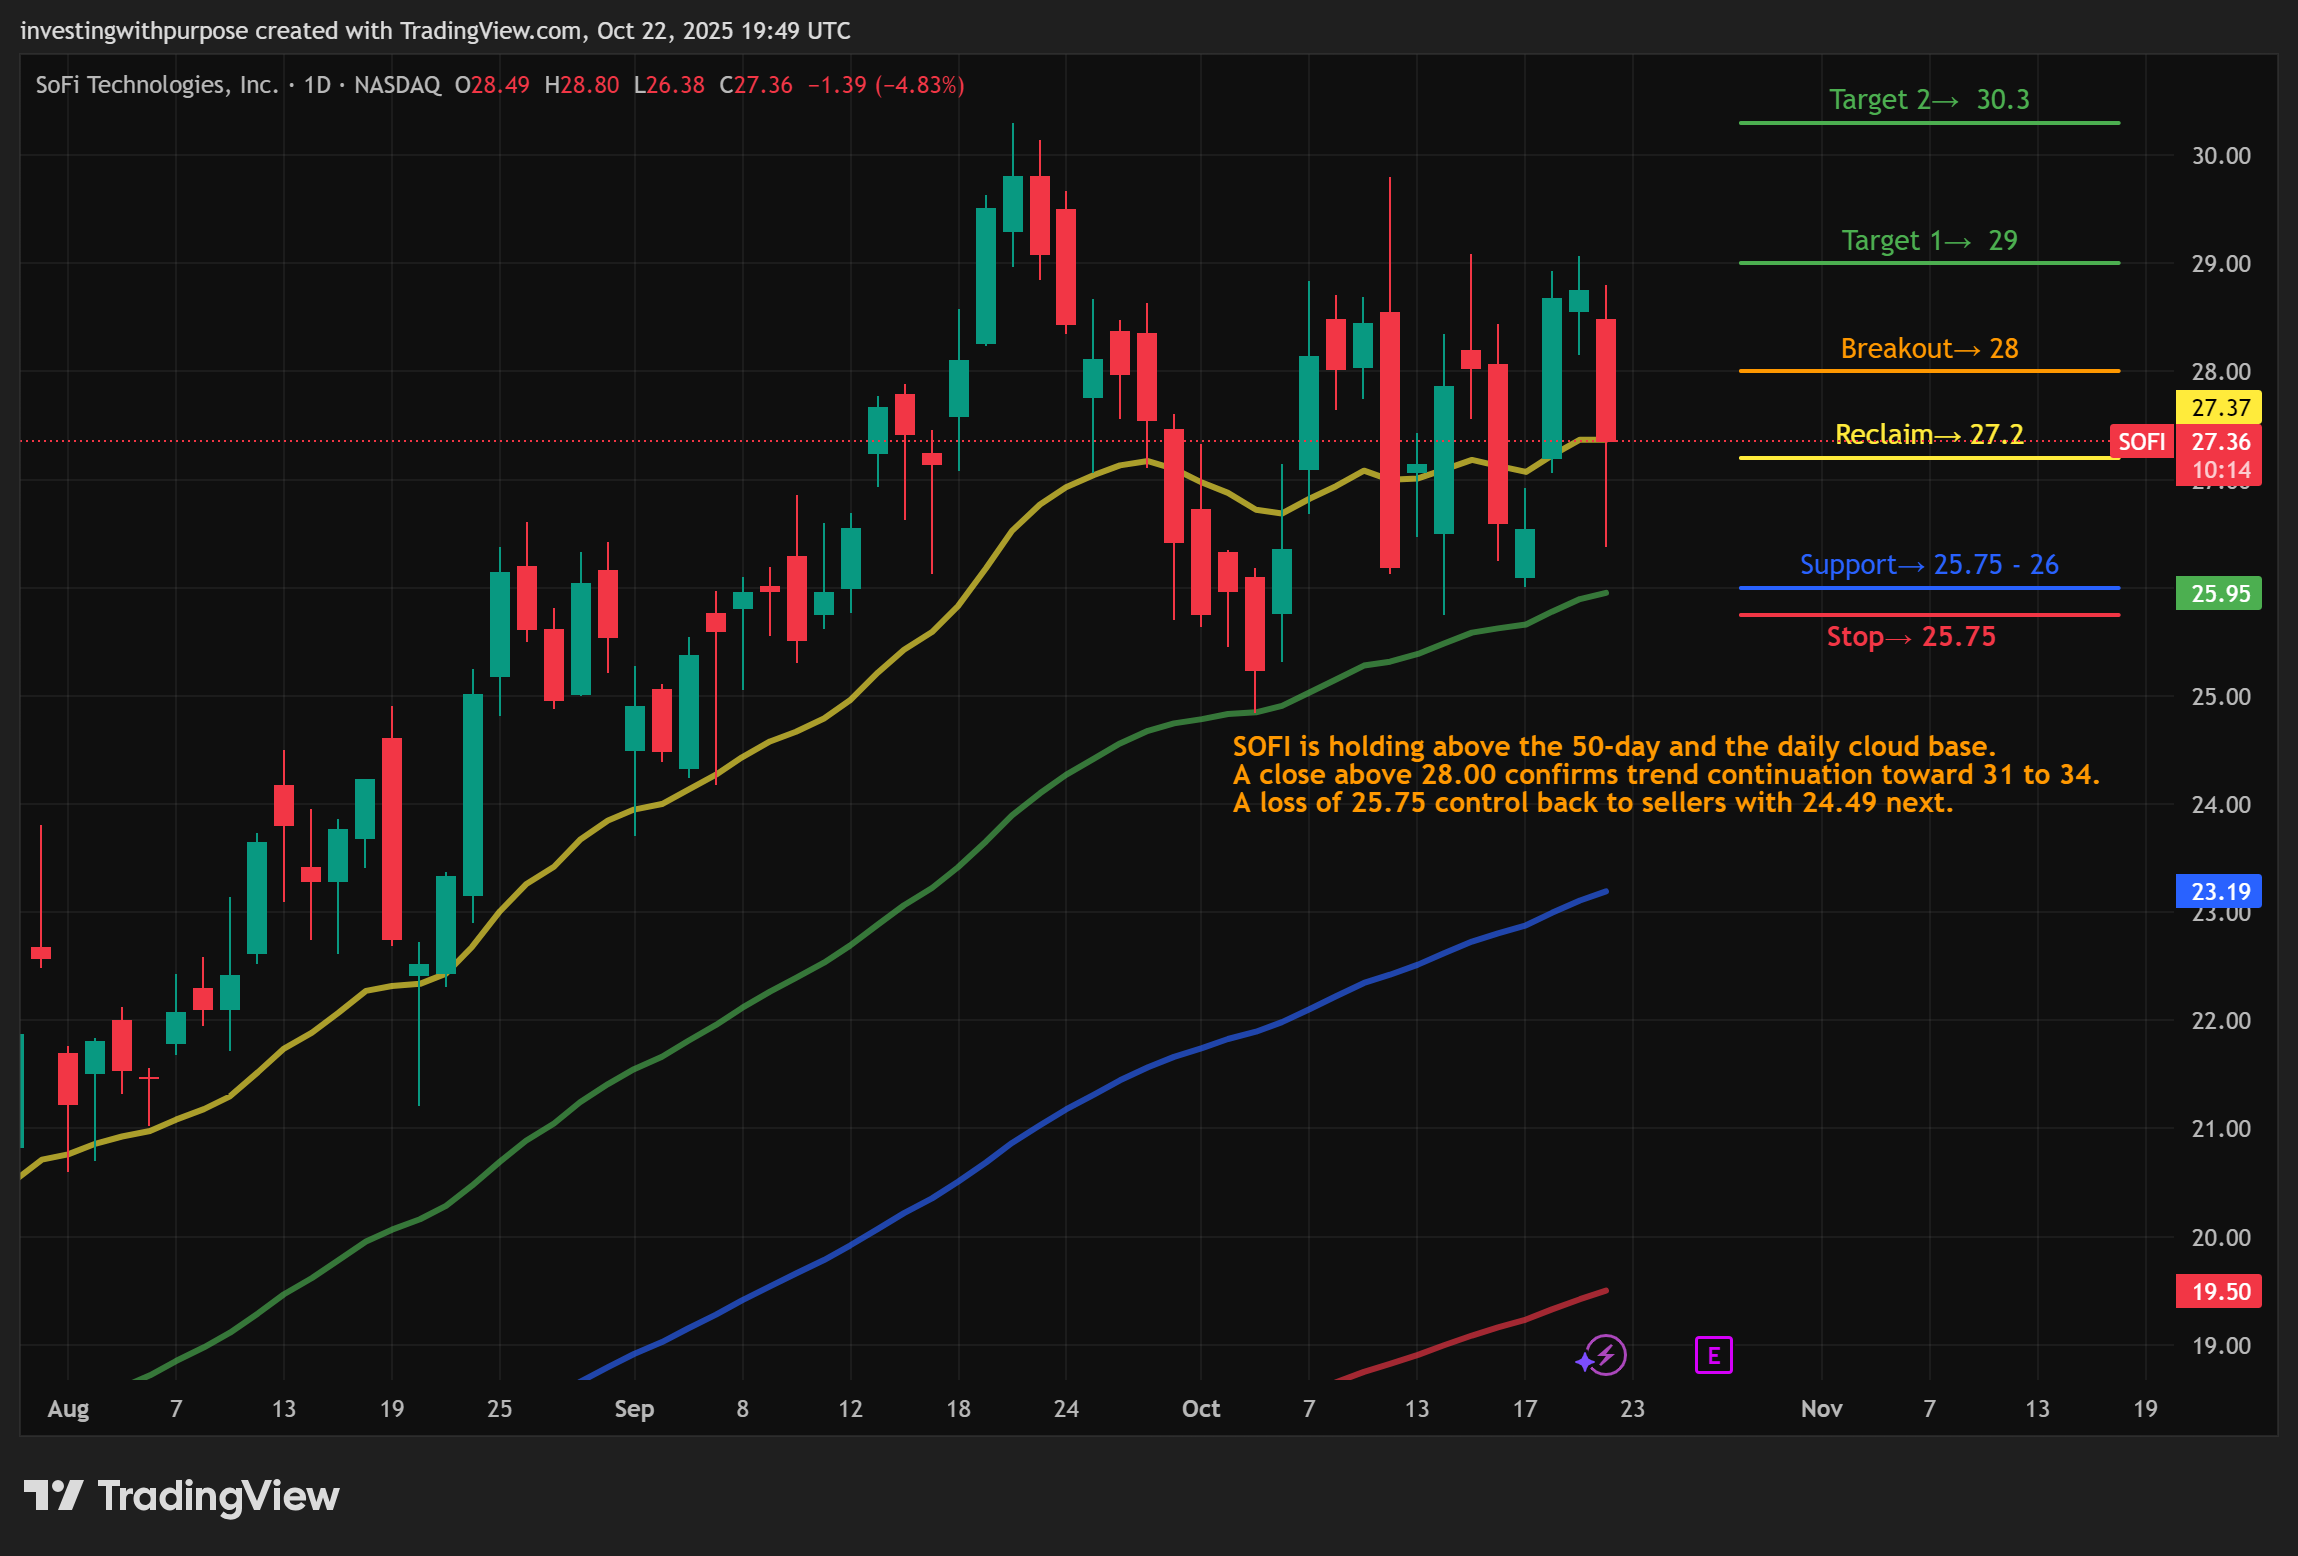
SoFi
Tight coil between 26 and 28. Above the 50 day near 25.9 and below the 20 day near 27.2. Weekly 1.618 extension level sits near 24.5 and has acted as strong support.
Daily cloud base 25.8 to 26 is the line in the sand. Reclaims 28 to 29 and the next magnet is 31 to 34 on extensions. Lose 25.75 and risk steps down to 24.5 then 22.5.
Momentum neutralizing after a strong run. Respect your stops and let the bigger trend decide.

A simple trade approach that is risk averse and strategic
Position sizing and sequencing
One core, one tactical. Use a small core position if you want exposure, then add tactically only on confirmation. Keep gross exposure balanced across the three so no single name dictates outcomes.
Use levels, not feelings.
PYPL: Accumulate only on daily close above 71.5. Initial stop 69.1. First target 74.5, second 77.3. If 67.8 breaks, step aside and reassess near 65.2.
XYZ: Add on 77 to 78 breakout and hold. Initial stop 74.2. Targets 81.7 then 88.5. If 73 fails, reduce and watch 71.9.
SOFI: Buy the hold above 28 with strength. Stop 26.0 to 25.7 depending on risk tolerance. Targets 31 then 34. If 25.75 fails, wait lower at 24.5 support.
Time frames. Weekly trends set the bias, daily gives entry, 4 hour manages risk. If daily closes contradict weekly bias, trade smaller or stand down.
Event control. Respect earnings dates, regulatory headlines, and macro prints. Shrink risk into events and re-risk only on confirmed reaction.
Bottom line
Fintech is a marathon again. Cash generation and balance-sheet prudence win the next leg, not just app engagement. The charts say PYPL and XYZ are coiling for a move while SOFI is digesting gains above stacked support. The financials say PYPL holds the cleanest cash engine, XYZ is tightening the screws on operating leverage, and SOFI’s reward is tied to continued profitable growth with measured credit. Pick entries at defined levels, size modestly, and let price confirm your thesis before you scale.
Not investment advice. For informational and educational purposes only.
Tags: fintech, digital finance, sofi stock, block stock, paypal stock, fintech analysis, investing with purpose, stock market insights, trading setups, risk aware investing, macro trends, sector analysis, market strategy, equity research.