
Fireworks in the Charts: Breaking Down the Independence Day Effect.

Why U.S. stocks tend to rise in the days before America’s birthday.

While the U.S. celebrates Independence Day with fireworks and family gatherings, equity markets pause for a mid-year breather. But beneath the surface of this national holiday lies a lesser-known seasonal anomaly that has quietly persisted for decades: the Independence Day Effect.
This phenomenon refers to the tendency for U.S. stocks (particularly large caps) to post modest gains in the final trading days leading up to July 4th. It’s subtle, but consistent enough to attract attention from quants and calendar-effect watchers.
What the Data Shows
Looking at the S&P 500’s historical performance in the days surrounding Independence Day, we see a slight but noticeable bullish bias:
Days Relative to July 4:
Average Return (1950-2023)
-3 trading days+0.04%
-2 trading days +0.07%
-1 trading day +0.18%
Post-holiday (next day) -0.02%
The gains are small, but when you annualize patterns like these, especially in quantitative strategies, they can add up over time.
Why Does This Happen?
Several factors may contribute to this pre-holiday bump:
Low Volume – Institutional desks typically wind down ahead of major holidays, leading to thinner markets where lighter buying pressure can push prices up.
Behavioral Optimism – Holidays generally bring a psychological lift, which can influence investor sentiment and risk appetite.
Short-Term Positioning – Traders often close out short positions to avoid holding risk over a long weekend.
Retail Activity – Increased retail participation ahead of major spending holidays may affect consumer-focused stocks.
Importantly, this isn’t a strong enough pattern to dictate long-term investment strategy, but it’s a real, measurable signal that traders may use in conjunction with broader setups.
How It Compares to Other Calendar Effects
The Independence Day Effect belongs to a family of market phenomena tied to the calendar—where certain dates, months, or events coincide with outsized returns.
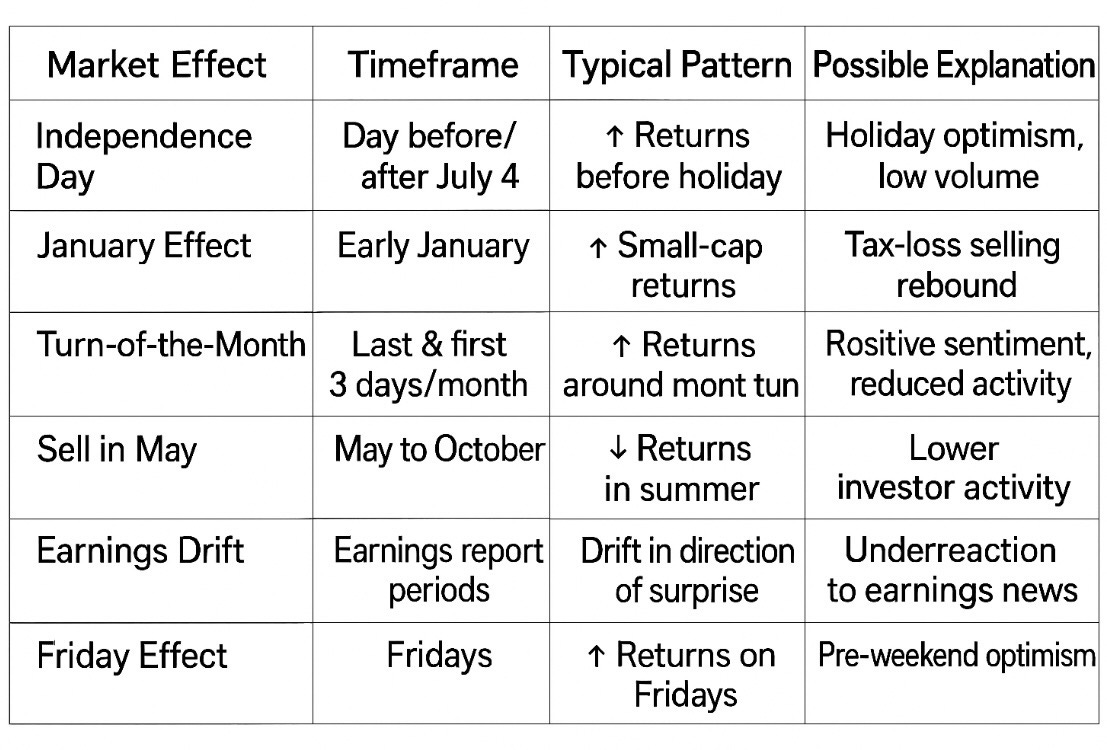
While weaker than some of its more famous cousins, the Independence Day Effect shows how even holidays can leave behind measurable footprints in price behavior.
Takeaways for Traders and Investors
For long-term investors, these holiday effects are more curiosity than strategy. But for short-term traders, especially those building quantitative models, they’re part of a larger toolkit of low-signal, high-consistency edges.
As always, these patterns work best in combination with other indicators. But they’re a reminder that markets, while efficient, are never entirely immune to rhythm, sentiment, and seasonality.
Enjoying this kind of data-driven market breakdown? Subscribe for weekly posts on patterns, positioning, and what moves markets beneath the headlines.