


The GLP-1 duopoly is no longer 1 trade. It’s 2 setups, on different sides of the same race.
For 3 years, owning Eli Lilly or Novo Nordisk was effectively the same bet: long the GLP-1 weight-loss bull market. That trade is over. As of 2026-05-15, LLY closed at $1,004.92, 11% below its all-time high but 61% above its August 2025 panic low. NVO closed at $44.74, down 33% over the trailing 12 months and well off its 2024 highs, only now showing daily-timeframe signs of repair. The fundamentals diverged first. The price action has finally caught up.

Key Takeaways
LLY is back at the highs with a clean EMA stack and 55.5% latest-quarter revenue growth. Daily price $1,004.92 above EMA20 $961, EMA50 $956, EMA200 $934. Trailing 12-month revenue $72.25B, net margin 35%, ROE 107%. The trend’s repaired itself.
NVO’s weekly trend is still broken. Daily is trying to bottom. Price $44.74 sits below weekly EMA50 $54.16 and EMA200 $71.43, but daily MACD just crossed up (+1.80 line over +1.66 signal) and ADX 30 reads “strong trend” forming. Early repair, not confirmation.
The valuation gap is the real story. LLY trades at 35.7x trailing earnings, 22.6x forward. NVO trades at 10.4x trailing, 13.3x forward. The market has priced LLY for franchise extension and NVO for share loss. Both could be right.
NVO’s latest print was solid too, just not enough to repair the tape. Q1 2026 revenue $96.82B (DKK reporting basis, about $14.9B at current USD-equivalent), growth of 24% versus the prior-year quarter.
One number decides each setup. $930 LLY (daily EMA200). $42.50 NVO (daily EMA50). Daily close below either, the constructive read is gone.
The biggest one first.
LLY: The Trend Has Already Repaired
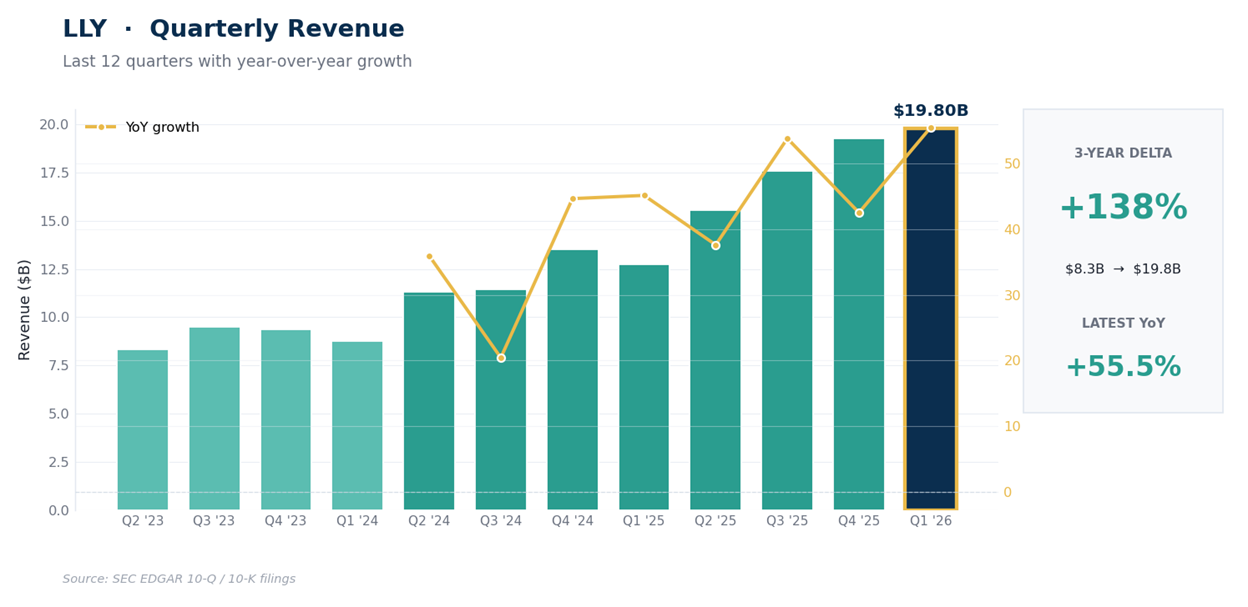
Eli Lilly’s last 12 reported quarters are a clean picture of tirzepatide’s market arrival. Revenue went from $8.31B in Q2 2023 to $19.80B in Q1 2026, a 2.4x compounding step inside 3 years. Latest quarter print +55.5% YoY (reported), with net income up 168% versus the prior-year quarter, diluted EPS $8.26. Mounjaro launched in May 2022. Zepbound followed in obesity in November 2023. SURMOUNT-OSA’s positive read on obstructive sleep apnea in 2024 added a third indication. SUMMIT’s HFpEF (heart failure with preserved ejection fraction) win in late 2024 added a fourth pathway. Each indication compounds the same molecule.
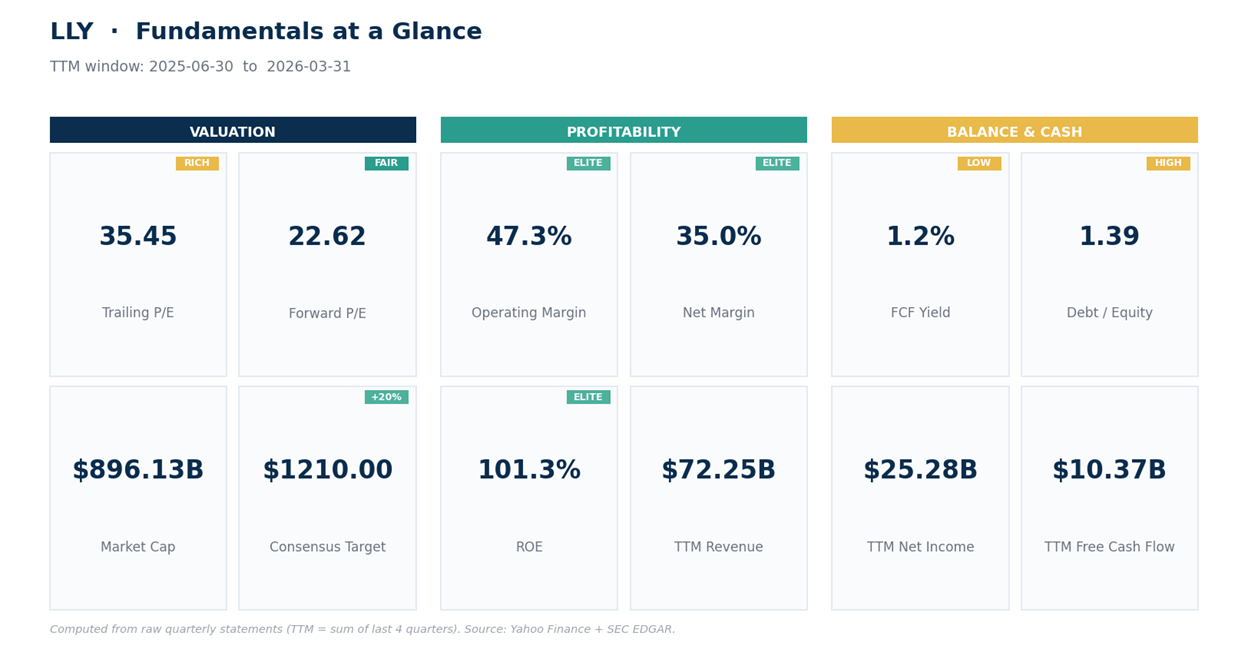
The fundamentals match the tape. Trailing 12-month revenue $72.25B, net income $25.28B, operating cash flow $20.48B, free cash flow $10.37B. TTM gross margin 82.8%, operating margin 49.4%, net margin 35.0%, EBITDA margin 50.1%. ROE 107%, ROA 20.7%. Debt/equity 1.39 (the manufacturing build is debt-funded), current ratio 1.50. Trailing P/E 35.7, forward P/E 22.6 (the market’s pricing $44 of fiscal-2027 EPS against this year’s pace). Dividend yield 0.69%. Consensus target $1,210 mean across 31 analysts, with 24 buy or strong buy, 6 holds, 1 sell. Median target $1,250.
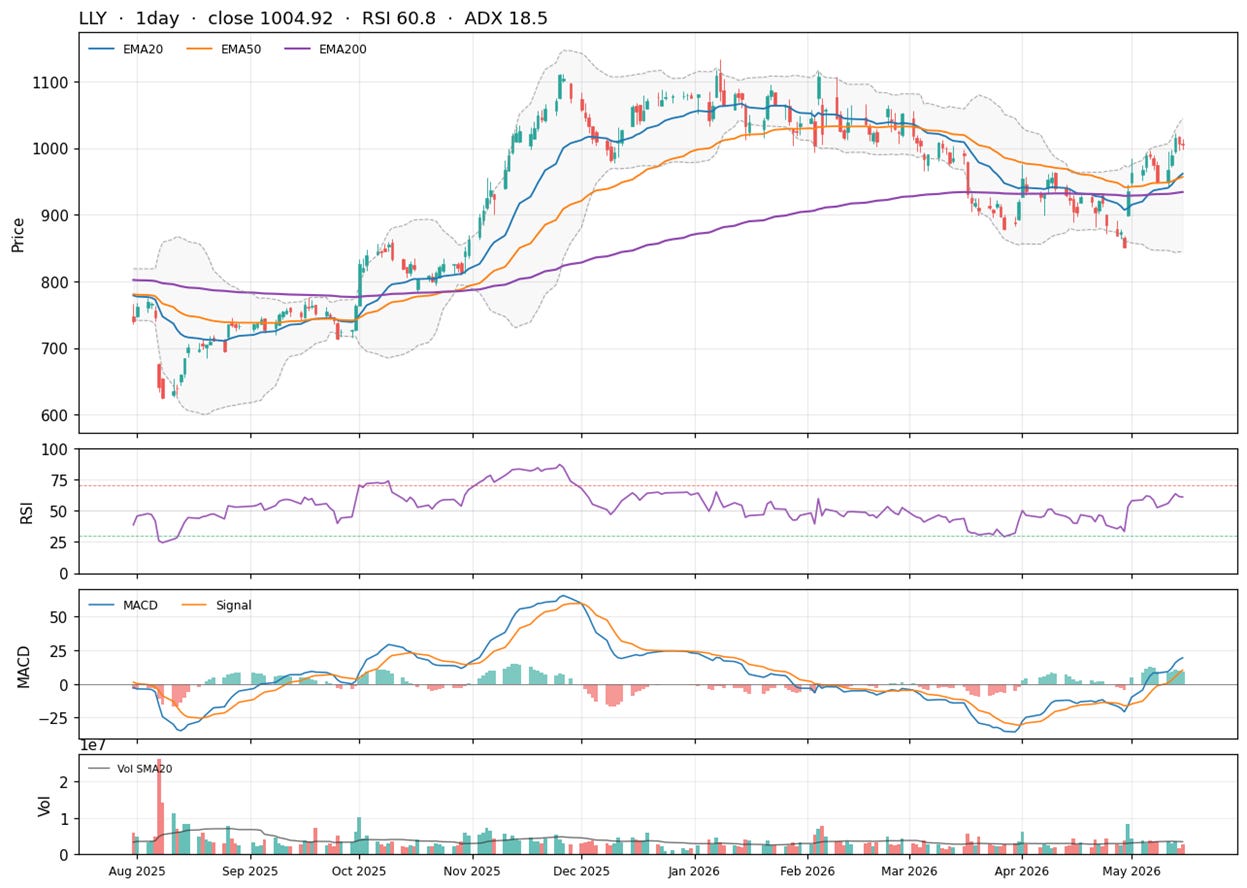
The weekly trend has rebuilt itself. August 2025 was the deeper panic, with LLY printing a $624 low. From there the stock rallied to a $1,134 all-time high in January 2026, gave back 25% into an April 2026 retest near $850, and has reclaimed $1,004.92. Spot sits 11% below the January high and 61% above the August low. Weekly EMA20 $961.89, EMA50 $922.67, EMA200 $713.74. Weekly RSI 55.2 (healthy, not stretched). Weekly MACD histogram still mildly negative at -7.97, Bollinger %B 0.557 (price sits in the middle of its weekly volatility band). ADX 18.6 means the trend’s there but not roaring.
The daily is where it gets interesting. Daily close $1,004.92 sits above all 4 moving averages (EMA20 $961.57, EMA50 $956.71, EMA100 $959.91, EMA200 $934.11). EMA50 still sits a hair below EMA100 (the residual scar from the April pullback, not yet fully repaired), but price above all of them is the read that matters. RSI 60.84 (room to run before “overbought”). MACD line +19.42 well above its signal at +10.28, with the histogram at +9.14 and rising (the up-move is accelerating). +DI 29.5 vs -DI 19.0 (buyers clearly in control). ATR $29.93 means a normal day swings around $30, so traders can size to that. Bollinger %B 0.802 puts price near the top of its volatility band, which often precedes a 1-2 day pause, not a reversal. Williams %R at -10.4 is the only short-term caution, the move is overbought on a 14-day lookback. Support clusters at $961 (EMA20), $934 (EMA200), then $890.
Net read: the business is firing on every cylinder and the price structure just confirmed the recovery. Weekly close above $1,025 opens fresh-high territory. Daily close below $930 (EMA200) breaks the structure that’s been built for 12 months. The next earnings print is Wednesday 2026-08-05, 79 days out. That’s runway, not a wall.
Different beast, same drug class.
NVO: The Repair Has Just Started
Novo Nordisk’s last 5 reported quarters are not the disaster the tape implies. Q1 2026 revenue $96.82B on a DKK reporting basis (around $14.9B in USD-equivalent terms), growth of 24% versus the prior-year quarter. Net income DKK 48.56B (around $7.5B USD), a 67% jump versus the prior-year quarter. Diluted EPS 10.91 DKK. The business is still growing fast. The 60%-plus drawdown from September 2024 is about everything else: the CagriSema disappointment of December 2024 (22.7% mean weight loss in REDEFINE-1 vs the high-20s management had signaled), the SURMOUNT-5 head-to-head data showing tirzepatide ahead of semaglutide (20.2% vs 13.7% at 72 weeks, May 2025), and the $11B Catalent acquisition that was necessary, expensive, and arguably late.
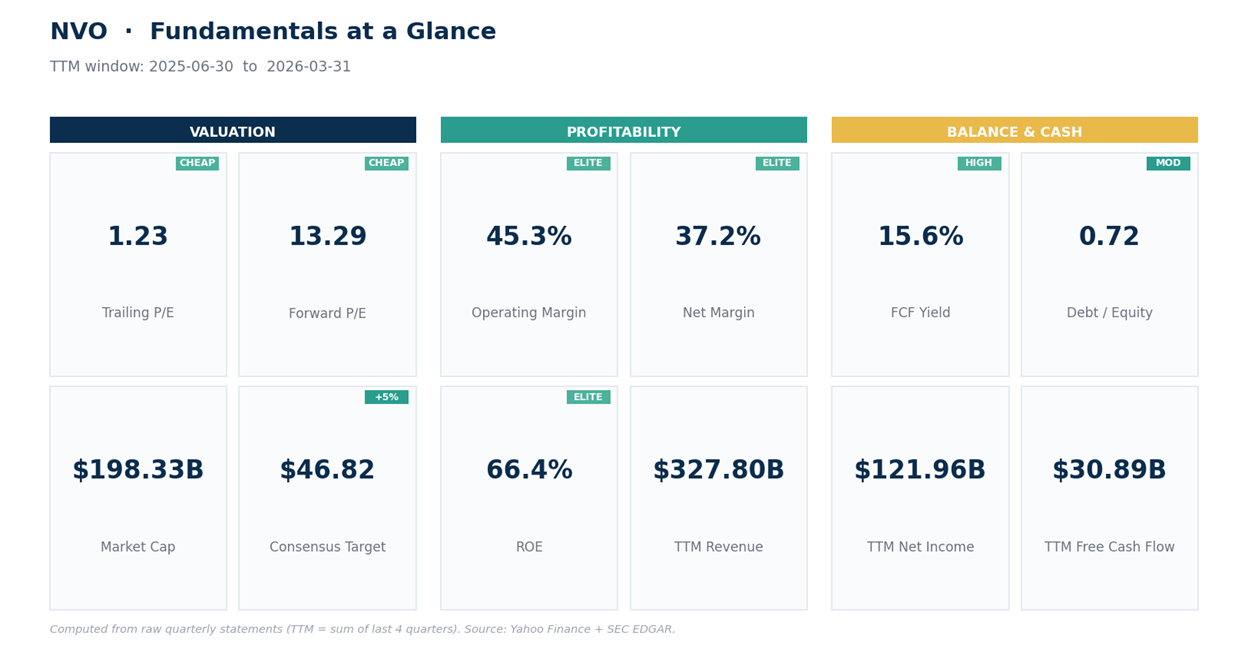
The fundamentals tell a story the price doesn’t. Yahoo’s USD-converted ratios: trailing P/E 10.4, forward P/E 13.3. TTM gross margin 83.2%, operating margin 61.6%, net margin 37.2%, EBITDA margin 53.0%. ROE 71.4%, debt/equity 0.72. Dividend yield 4.03%. Beta 0.35 (the stock moves at one-third the market’s daily noise). Operating-margin call-out: NVO converts every dollar of revenue at over 60 cents into operating income. That’s a structural margin profile that doesn’t typically belong to a stock trading at single-digit forward earnings. Consensus target $46.82 mean across 14 analysts, with only 5 of them buy or strong buy and 9 hold. Median target $44.63 is basically flat to spot. Analysts have already capitulated.
The weekly trend is still broken. NVO’s weekly EMAs are stacked in proper downtrend order: price $44.74, EMA20 $44.72 (just barely back above the 20-week), EMA50 $54.16 (a long way up), EMA200 $71.43 (memory of the highs). Weekly RSI 47.1 is neutral. Weekly MACD histogram just flipped positive at +0.97 after months of negative readings, an early-cycle bottoming tell. ADX 26.4 says the still-existing trend (down) has weakened. Bollinger %B 0.469 puts price mid-band. The weekly setup is not yet bullish. It’s “less bearish than it was.”
The daily tells a sharper story. Price $44.74 sits above the daily EMA20 ($43.77), EMA50 ($42.59), and right at the EMA100 ($44.71). Only the EMA200 at $51.35 still towers overhead, the structural ceiling. Daily RSI 59.2 (firm). MACD line +1.80 above signal +1.66, histogram +0.14 (positive but thin, the cross is recent). +DI 38.3 vs -DI 25.8 means short-term buyers in control. ADX 30.0 means the new daily trend is already strong (more reliable than the weekly +DI reading). ATR $1.33 sets the daily noise around 3% of price. Bollinger %B 0.628 is mid-band. The setup is “early bottoming” not “trend turn.” A weekly close above $48 plus a reclaim of the daily EMA100 at $44.70 would meaningfully change the read.
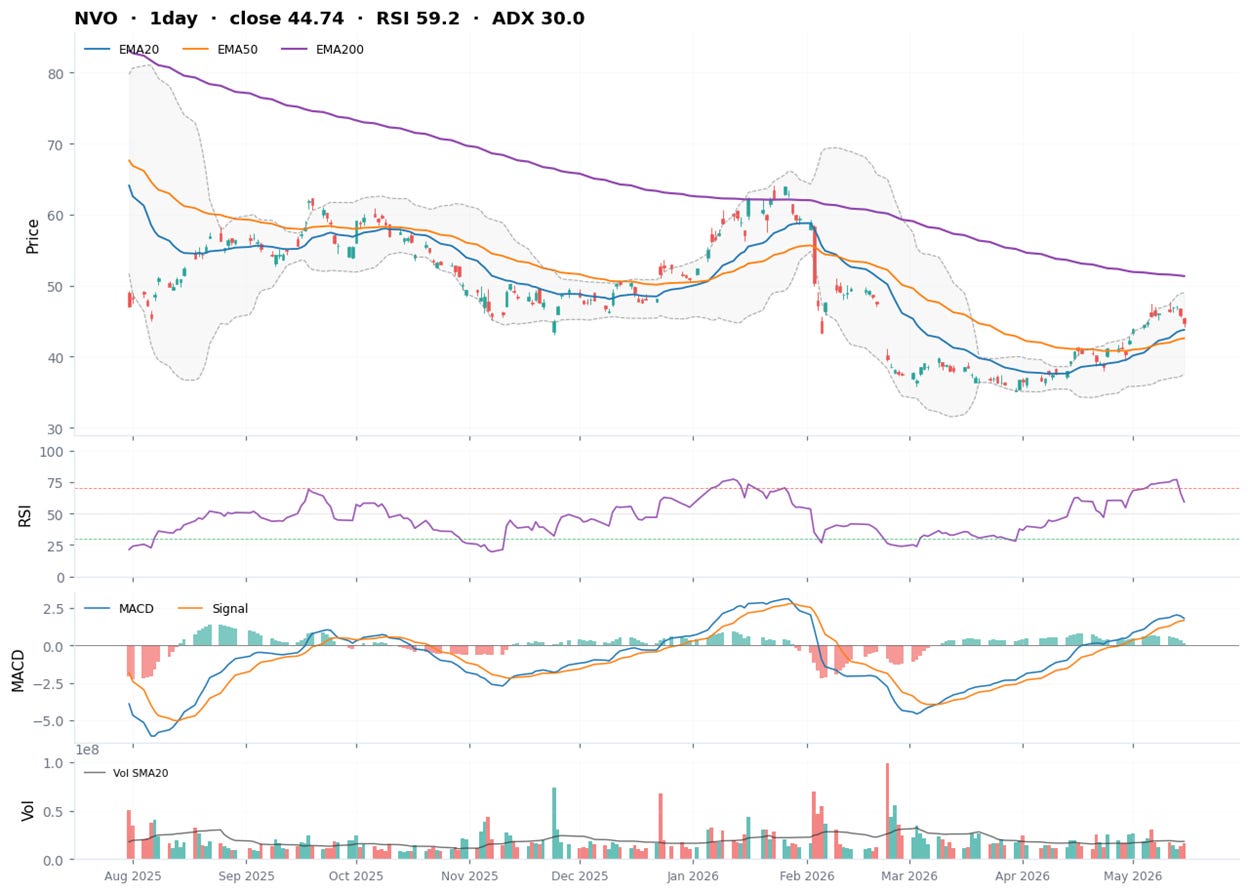
Net read: the latest reported quarter says the business is fine. The tape says the market is still pricing share loss and pipeline doubt. Daily $42.50 (EMA50) is the line that separates “real repair” from “another false bottom.” A daily close below it sends spot back toward $40 and the prior swing low. A weekly close above $48 starts the conversation about $54 (weekly EMA50) and eventually $60.
How to act on it.
Our Trade Plan
LLY (earnings Wednesday 2026-08-05)
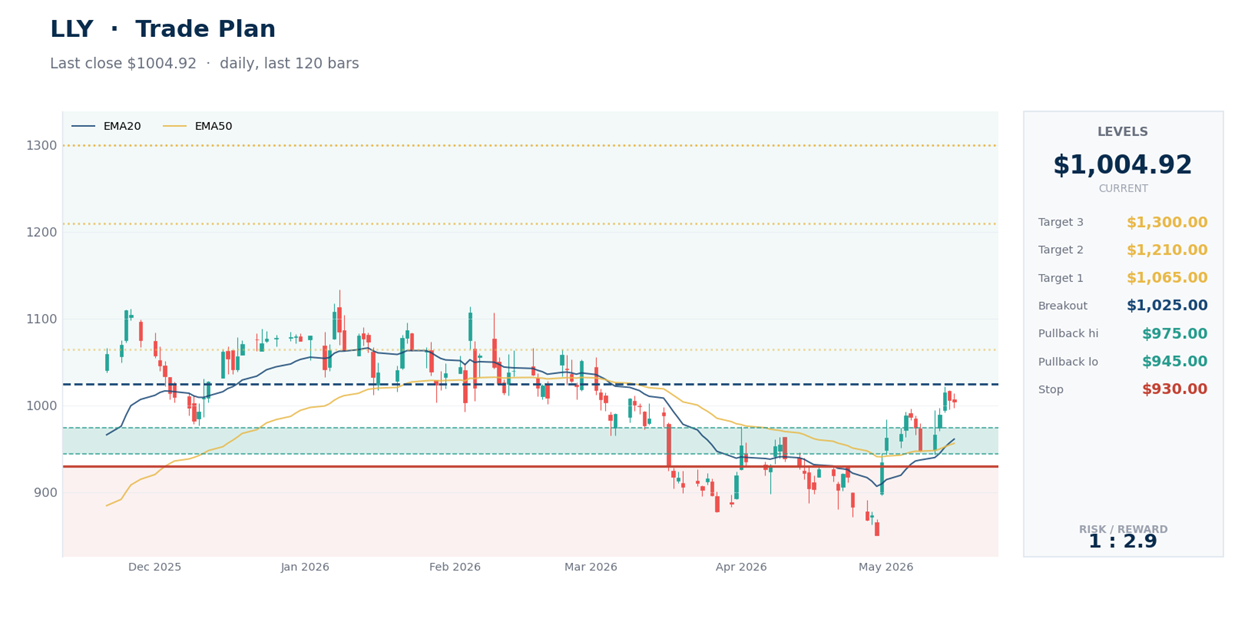
Pullback: $975 to $945 (daily EMA20 down to EMA200 cluster)
Breakout: weekly close above $1,025 (prior swing high)
Invalidation: daily close below $930 (loss of EMA200, structure broken)
Targets: $1,065, $1,210 (consensus mean), $1,300+
Rolling stop: at $1,065 to $975, at $1,150 to $1,030, at $1,210 to $1,080
Earnings 79 days out, so there’s no print risk for at least 10 weeks. Add on weakness rather than chase. Daily Williams %R at -10 says the very-short-term is overbought, a 1-3 day pause to $980 is typical.
NVO
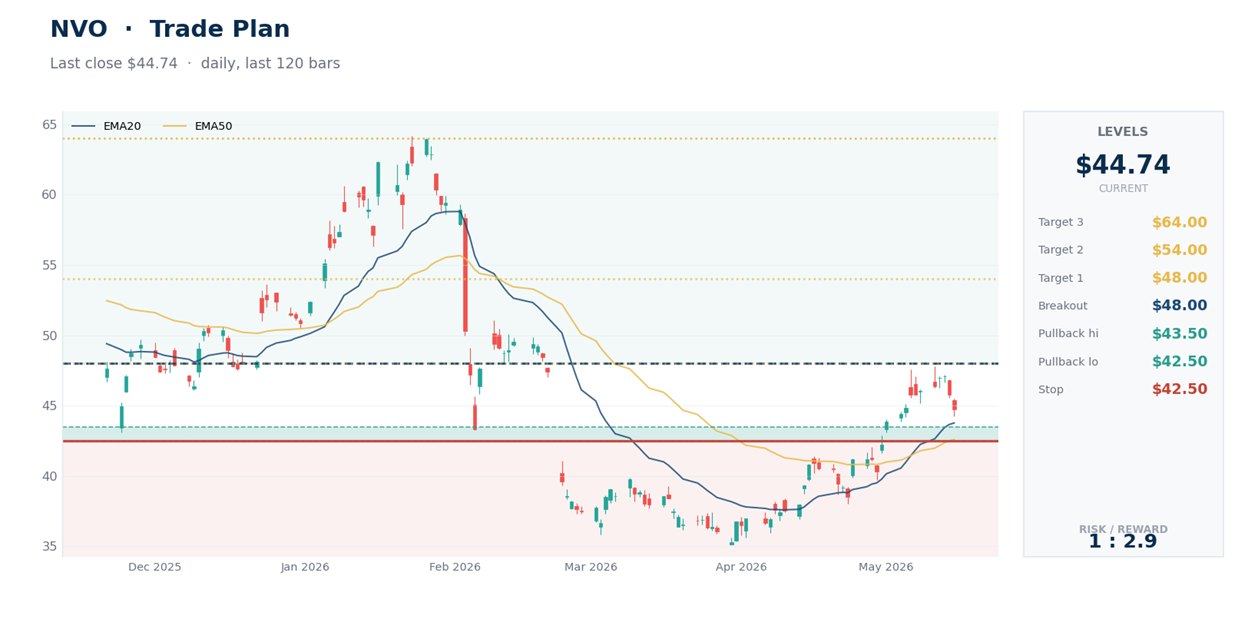
Pullback: $43.50 to $42.50 (daily EMA20 to EMA50)
Breakout: weekly close above $48 (recovers daily EMA200 zone)
Invalidation: daily close below $42.50 (loss of EMA50, daily repair fails)
Targets: $48, $54 (weekly EMA50, then consensus high $64)
Rolling stop: at $48 to $43, at $54 to $47, at $60 to $50
This is the contrarian leg. Position smaller than LLY because the weekly trend is still down. 4.03% dividend yield is real carry while you wait. If $42.50 breaks, the trade idea breaks with it.
Position sizing. Risk per trade, not capital per trade. Decide what percentage of the portfolio you’ll lose if invalidation hits, divide by the distance between entry and stop, that’s your exposure. LLY’s stop sits about 7.5% below spot. NVO’s stop about 5%. Same dollar risk means roughly 1.5x more NVO shares than LLY shares.
Bottom Line
Lilly’s the cleaner setup. Revenue from $8.31B to $19.80B per quarter in 3 years is the demand picture. Daily price sits above every meaningful moving average in proper trend order, latest quarter delivered 55.5% revenue growth, and the next earnings print is 79 days out. The decision is whether you’re chasing a recovery that’s already rallied 61% from the August 2025 low, or whether the trend extends to $1,210 and beyond. The line that decides it is $930.
Novo’s the contrarian setup. The weekly trend still says “broken.” The daily says “early bottoming.” The fundamentals say “still growing 24% YoY at 62% operating margins.” The valuation says “the market is pricing decline that hasn’t started yet.” Daily $42.50 is the binary. Above it, the repair gets a chance. Below, the next leg of the move is lower and the trade plan needs to wait for the next setup.
The duopoly framing made sense when supply was the binding constraint and both stocks were one trade. By spring 2026 they’re 2 distinct setups. Lilly rewards trend-following. Novo rewards patience on entry and discipline on the stop.
One number per name decides everything. $930 LLY, $42.50 NVO. Above, the constructive read holds. Below, the plan needs revisiting.
This is research and commentary, not personal investment advice. Levels and trade plans are illustrative; size positions to your own risk tolerance and time horizon. The author may hold positions in names discussed.