


Gold settled Thursday at $4,516 an ounce, silver at $68.03, copper at $6.46 a pound, and all 3 have added to it since. They didn’t rise for the same reason: the precious pair moved on a Treasury buyback that pushed real yields down for about a day, while copper is being pulled by a physical squeeze of its own. That matters before you buy any of them, because the published 2027 forecasts don’t rank these 3 the way the price action does. Gold’s whole range sits above spot, copper’s central case sits below it while its range straddles, and silver’s spans both by a mile.
Key Takeaways
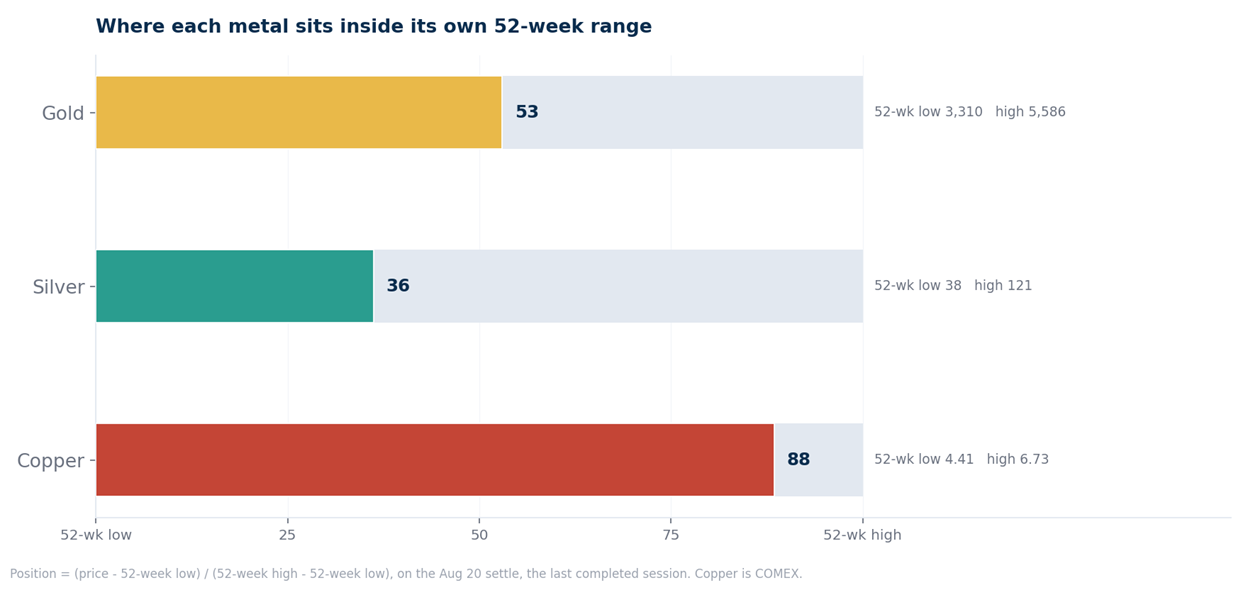
Inside its own 52-week range, copper sits at 88 out of 100, gold at 53 and silver at 36. 3 metals, 3 completely different starting points.
Published 2027 forecasts put gold 11% to 24% above the Thursday settle, silver 27% below to 40% above, and copper 20% below to 10% above.
The Warsh Fed has removed forward guidance and 9 of 18 FOMC members now pencil in a rate rise this year. Jackson Hole, which opens Thursday, brings his first speech as chair.
GLD and SLV closed 0.91 and 0.94 of the way up their volatility bands on Thursday and have run further since. COPX is the least extended of the 3.
COPX holds copper miners, not copper. Its ratio to the metal ranged 10.3 to 15.9 over the past year.
A note on timing. Every level below is the Thursday August 20 settle, the last completed session, since Friday is still trading. Where Friday matters, it’s flagged as intraday.
Start with what’s actually driving them.
The Variable, and the Exception
Every argument about gold and silver runs through the real yield, and the real yield runs through Kevin Warsh. He took office as Fed chair on May 22 and used his first meeting on June 17 to hold at 3.50% to 3.75% while making the direction of travel clear. 9 of 18 policymakers now project at least 1 rate rise in 2026, against none in March. He has put noticeably more rhetorical weight on inflation than his predecessor, though the Fed’s July language still describes its commitment to both price stability and maximum employment as unwavering. Core PCE, the measure the Fed actually targets, ran 3.3% in June against 3.7% headline.
The removal of forward guidance matters more than it sounds. A Fed that telegraphs its intentions makes speeches boring. A Fed that doesn’t makes them tradeable. Warsh speaks at Jackson Hole, which opens Thursday, his first as chair, with no guidance to anchor expectations against.
The move in the precious pair came from the other side of that variable. On August 19 the Treasury announced it would at least double its long-dated buybacks, from $2 billion to $4 billion an operation between September 9 and November 4, aimed at the 10 to 30 year part of the curve, which has seen a buyers’ strike since June. The 10-year fell 5 basis points to 4.647% and the 30-year dropped 9 to 5.196%. Gold settled up 4.1% at $4,512 that day, silver up 6.4% at $66.97.
Then it unwound. Yields were higher the next session and the 10-year now sits near 4.72%, above where it closed on the announcement. Gold and silver kept their gain anyway and extended it. Read that as conviction or as a crowd that hasn’t marked itself back. Either way the trigger lasted about 24 hours and the price move didn’t.
Copper is a separate case moving at the same time, pulled physically rather than monetarily: LME spot traded as much as $545 a tonne above the 3-month contract in mid-August, the widest since the 2021 squeeze, on falling exchange stocks. That’s a signal about warehouses today, not a view on rates, and it explains why copper sits near the top of its range while silver sits near the bottom.
Where the forecasts point.
What Published Forecasts Imply
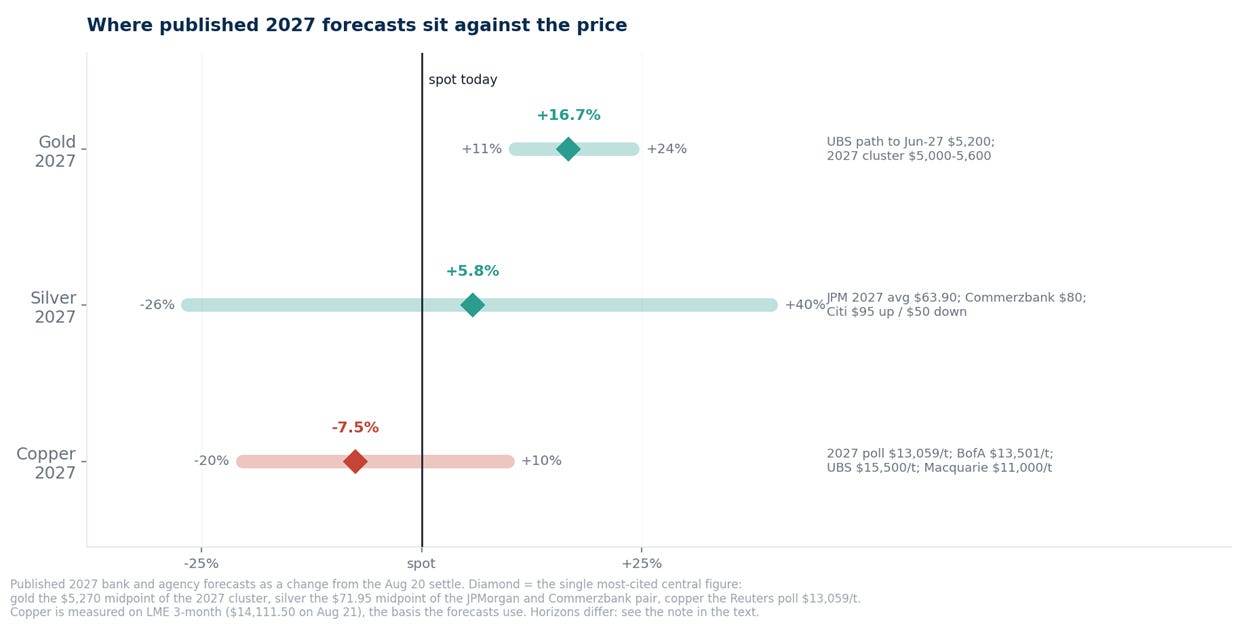
One caveat. These are published 2027 forecasts but not all the same animal: some are annual averages, some dated targets, some scenarios. The diamond marks the single most-cited central figure, not a computed mean. Treat the ranges as a map of disagreement rather than a distribution.
Gold is the only one of the 3 whose 2027 range sits entirely above the current price. UBS maps a path of $4,600 by December, $5,000 by March 2027 and $5,200 by June. The 2027 cluster runs $5,000 to $5,600, with JPMorgan and UBS at $5,400, Goldman $5,400 to $5,600 and Westpac at $5,000. Bank of America carries an $8,000 scenario explicitly not its base case. UBS still expects central banks to buy 750 to 1,000 tonnes a year. UBS’s own September figure, $4,400, is below spot, so even the constructive house sees the next leg lower before higher.
Silver has no dated waypoints, only annual averages, and they disagree violently. JPMorgan models a 2027 average of $63.90, below today. Commerzbank targets $80 by end-2027. Citi carries $95 on the upside and $50 on the downside. The physical story is better than the price and moving the right way: the World Silver Survey published in April puts the 2026 deficit at 46.3 million ounces, 15% wider than 2025’s 40.3 million, a sixth straight shortfall that has pulled 762 million ounces from above-ground stocks since 2021. Total supply is forecast down about 2%, with mine production essentially flat at minus 0.3% and recycling up 7%, so the tightening comes from the balance, not from mines closing.
What makes silver interesting isn’t the forecast though, it’s the ownership. Net speculative length was 23,646 contracts against 115,127 of open interest on August 11, about 20% of the total, with only 12 of the past 60 weeks lower. The physical squeeze that spiked the 1-month lease rate toward 39% was back in October 2025; silver made its $121 record in January, then gave up more than 40%. Both the squeeze and the crowd have gone. The deficit hasn’t.
Copper is where consensus conflicts most sharply with current price strength. The 2027 analyst poll averages $13,059 a tonne and Bank of America $13,501, both below the $14,111.50 LME 3-month traded at this week. Cochilco sits at $5.10 a pound, about $11,244, and Macquarie models a floor near $11,000 by the third quarter of 2027. But UBS runs the other way at $15,500 by June 2027, and BMI has the balance flipping to a 66,000-tonne deficit from 2027, widening every year after.
One wrinkle before comparing anything. COMEX copper trades at a premium to LME, roughly $365 a tonne, because US buyers are pricing a Commerce recommendation to phase in duties of 15% in 2027 and 30% in 2028. That tariff is recommended, not enacted. COMEX at $6.46 a pound is $14,242 a tonne against LME’s $14,111.50, so quoting the wrong one misjudges the gap by a couple of points.
How to trade it.
The Setups
GLD holds physical gold bullion, SLV physical silver, and COPX copper mining equities rather than the metal. Gold is about GLD multiplied by 10.89 and silver about SLV multiplied by 1.107, using a 20-day median because the futures-to-fund relationship wobbles more than 1% day to day, so metal equivalents are approximate. The daily plots show the 20-day and 50-day averages; the 100-day and 200-day are quoted below. The risk-reward panel measures the breakout trigger to the final objective against the stop.
GLD, $415.26 on Thursday (gold $4,516). Intraday Friday near $422.
