
Gold: The bull case got stronger.
The correction from $5,595 tested structure and held. Now the question is whether this bounce becomes the next leg higher, or fades into noise.

In March, we wrote that gold was compressing between support and resistance, and that the next move would be decisive rather than gradual.
It was decisive. Just not in the direction most were expecting.
Gold sold off hard. From the January all-time high of $5,595, spot gold dropped to $4,320 in late March. GLD, the SPDR Gold Shares ETF, fell from 510 to 399. That is a 22% drawdown peak to trough, the sharpest correction in the entire bull cycle.
And then it bounced.

Gold is now sitting at $4,744 (GLD at 440), roughly 40% of the way back from the low. The weekly trend structure held. The higher low pattern survived. And the same forces that drove the rally, central bank accumulation, supply constraints, and geopolitical risk, remain in place.
But the recovery is not clean. It is happening on declining volume, into heavy overhead resistance, with short-term momentum already stretched. That matters.
This is not a moment for conviction. It is a moment for precision.
Let us walk through it.
Key Takeaways
Gold corrected 22% from the January ATH and held above the critical $4,300 structural floor
The secular bull trend remains intact on all higher timeframes
The bounce is real but volume is not confirming it, which limits near-term upside confidence
Price is testing a major resistance cluster at $4,800 (GLD 440-442) that aligns across Fibonacci, Ichimoku, and moving average structures
A pullback to $4,600-$4,700 (GLD 425-435) would offer a high-quality entry with clearly defined risk
Invalidation is $4,320 (GLD 397). Below that, the entire thesis changes.
The forces behind gold have not changed. But expectations need to catch up with price.
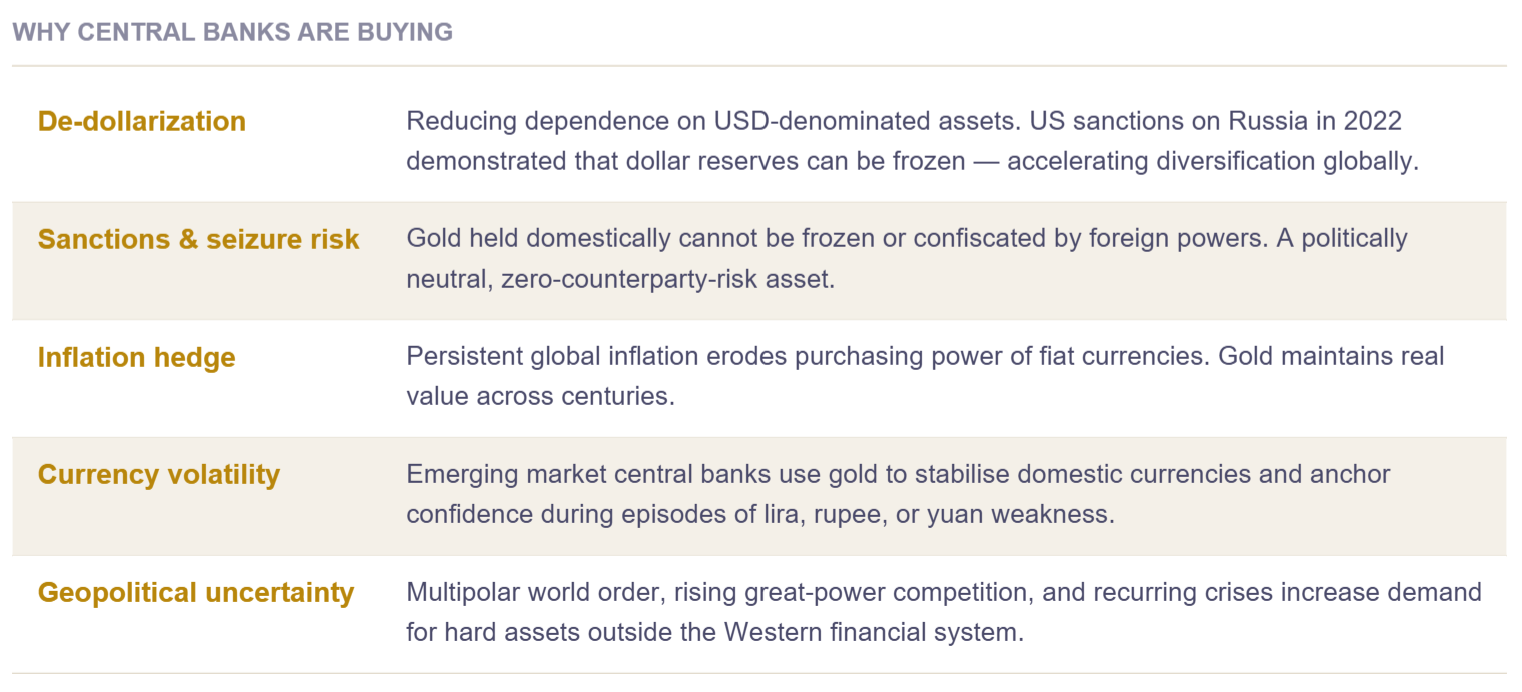
Demand, Supply, and What Is Actually Driving Gold
Gold does not have earnings. It has forces. And the force that matters most right now is structural demand that does not care about price.
Central banks purchased 863 tones in 2025. That is not a spike. It is the continuation of a multi-year regime shift in how sovereign institutions manage reserves. Poland led with 102 tones for the second consecutive year. China continued buying. The trend has spread to Malaysia, South Korea, and Uzbekistan. J.P. Morgan forecasts 755 tones for 2026, a step lower than the peak but still nearly double pre-2022 averages.
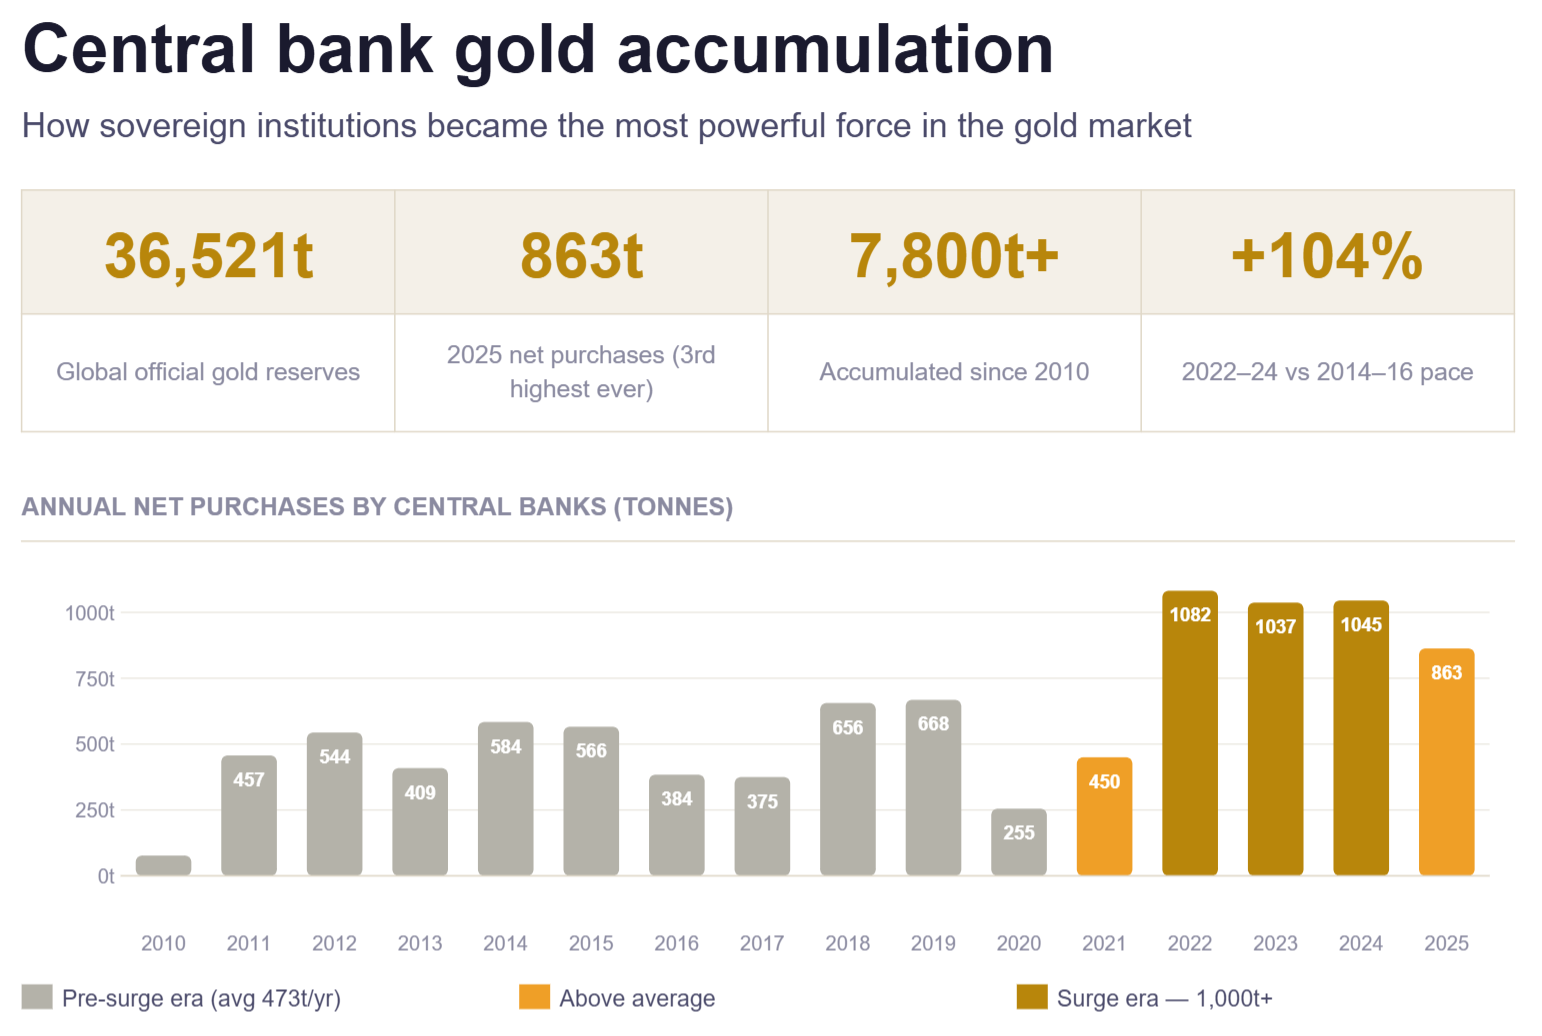
This buying is not speculative. It is strategic reserve diversification. It does not reverse on a 15% drawdown. If anything, lower prices accelerate it.
At the same time, supply remains structurally constrained. Despite gold prices rising 65% in 2025, mine production grew only 1%. Recycling increased just 2%. New project discoveries are declining, permitting timelines are lengthening, and capital costs are rising. Most major miners are guiding flat or lower output for 2026.
That asymmetry is the most durable argument in the gold market. Demand is structurally elevated and price-insensitive. Supply is structurally capped and slow to respond. When a market has those characteristics, corrections do not become bear markets. They become buying opportunities.
Investment demand adds another layer. Global gold ETFs added 801 tonnes in 2025, the second strongest year on record. US ETF holdings hit 2,019 tonnes ($280 billion in AUM). Yet relative to previous bull cycles, holdings remain modest, particularly in Asia and Europe. That suggests there is room for further accumulation if conditions remain supportive.

The geopolitical overlay has shifted but not disappeared. The US-Iran conflict, which drove the January spike to $5,595, reached a fragile two-week ceasefire on April 8. That removed the acute panic premium. But “fragile ceasefire” is not “durable peace.” The risk premium has compressed, not collapsed. Any re-escalation would immediately reprice gold higher.
The most credible bearish force is the Federal Reserve. Rates remain at 3.75-4.00%, and March FOMC minutes flagged concerns that Middle East-driven inflation could require further hikes. Swaps markets currently price near-zero probability of a cut at the April FOMC. High real rates increase the opportunity cost of holding a non-yielding asset, and that headwind is real.
But here is the tension the market is pricing: inflation is sticky while nominal rates are elevated, which means real rates are not tightening aggressively. Gold does not need rates to fall. It needs real rates to stop rising. And they have.
The fundamental picture, in short, is this: the structural bid from central banks and supply constraints creates a floor. The geopolitical premium creates optionality to the upside. The Fed creates a ceiling until something changes. That is a consolidation environment with a bullish skew, not a breakdown.
The fundamentals built the floor. Now let us look at how price is behaving on top of it.
Technical Analysis
Weekly Structure: Intact, Oversold, and Recovering
Start from the top. The weekly chart is the one that defines the trend, and the trend survived.
GLD rallied from 261 in February 2025 to 510 in January 2026. The correction took it to 399. Every weekly moving average is still rising. The EMA20 (426) was just reclaimed. The EMA50 (379) was never threatened. The higher-low pattern, the defining feature of a bull market, held.
What makes the weekly particularly interesting right now is the StochRSI. It is sitting at 5.4, which is one of the deepest oversold readings in the dataset. In the context of a rising-EMA weekly structure, this is historically one of the highest-probability mean-reversion setups available. The base rate for a 8-15% rally over 6-10 weeks from this condition is strong.
The weekly MACD is the counterweight. The histogram is at -6.09 and still worsening. Momentum on the highest timeframe has not confirmed the bounce. Until the weekly MACD histogram flattens and turns, the recovery is technically unconfirmed on the most important timeframe.
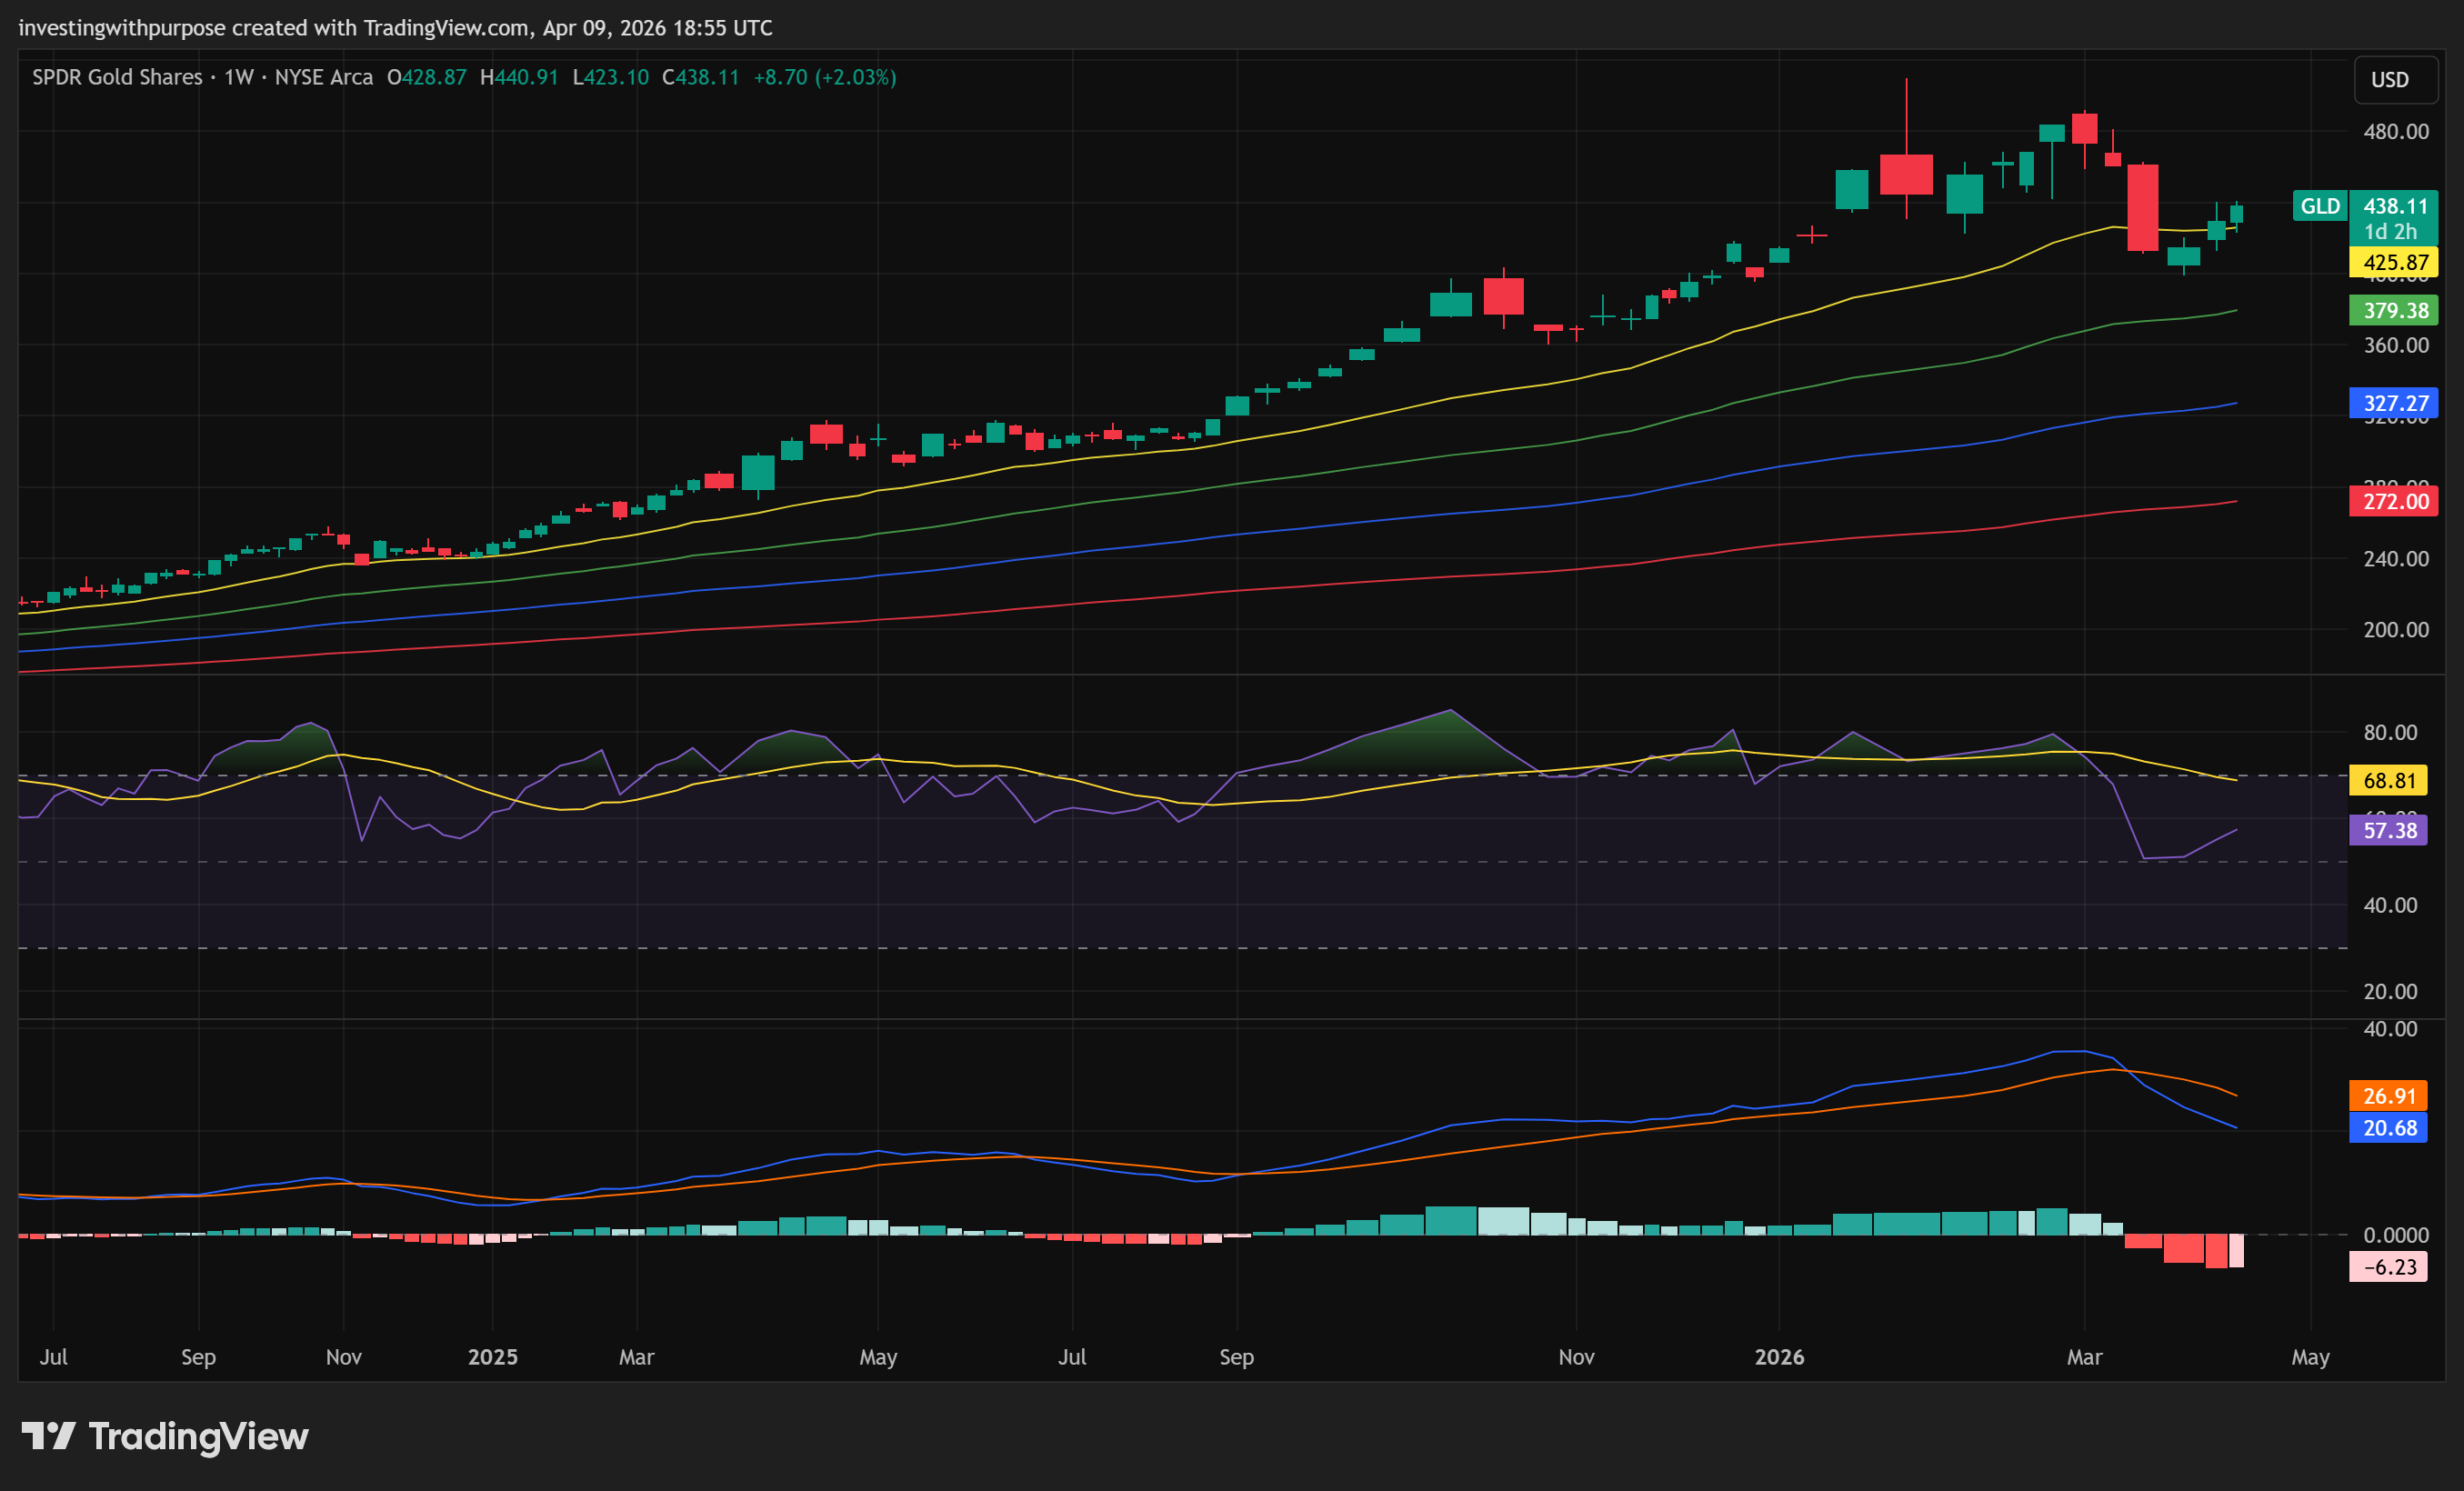
Weekly RSI sits at 58, neutral. It corrected from the 80s during the selloff but never broke below 40, which in secular uptrends typically marks the floor.
The Ichimoku picture on the weekly is bearish short-term, with a Tenkan/Kijun cross below and price below the Kijun (446). But the forward cloud remains far below current price, meaning the longer-term Ichimoku regime is still bullish.
Daily Structure: Damaged But Repairing
The daily chart tells the story of how sharp the selloff was and how the recovery is behaving.
Price fell from 492 to 400 in 15 trading days. Peak volume on the capitulation day was 37 million shares. OBV dropped from 773 million to 600 million. That is institutional distribution, not retail noise.
The recovery has brought price back to 440 (as of April 9), but the volume signature is different. Bounce days are averaging 10-14 million shares versus 18-37 million on the decline. OBV has recovered to 649 million. Price has recouped 40% of the decline, but volume participation has recouped only 28%.
That divergence is the most important observation on the daily chart. It does not kill the bull case, but it means the bounce is fragile and vulnerable to a swift reversal if sellers re-emerge.
On the moving average front, price has just crossed above the daily EMA20 (434) for the first time since mid-March, and is testing the EMA50 (439). The EMA100 (425) and EMA200 (391) are intact below. The EMA20 has crossed below the EMA50, which is a bearish cross, but price is attempting to reclaim the EMA50 from below. If it holds above 439 for several sessions, that is constructive.
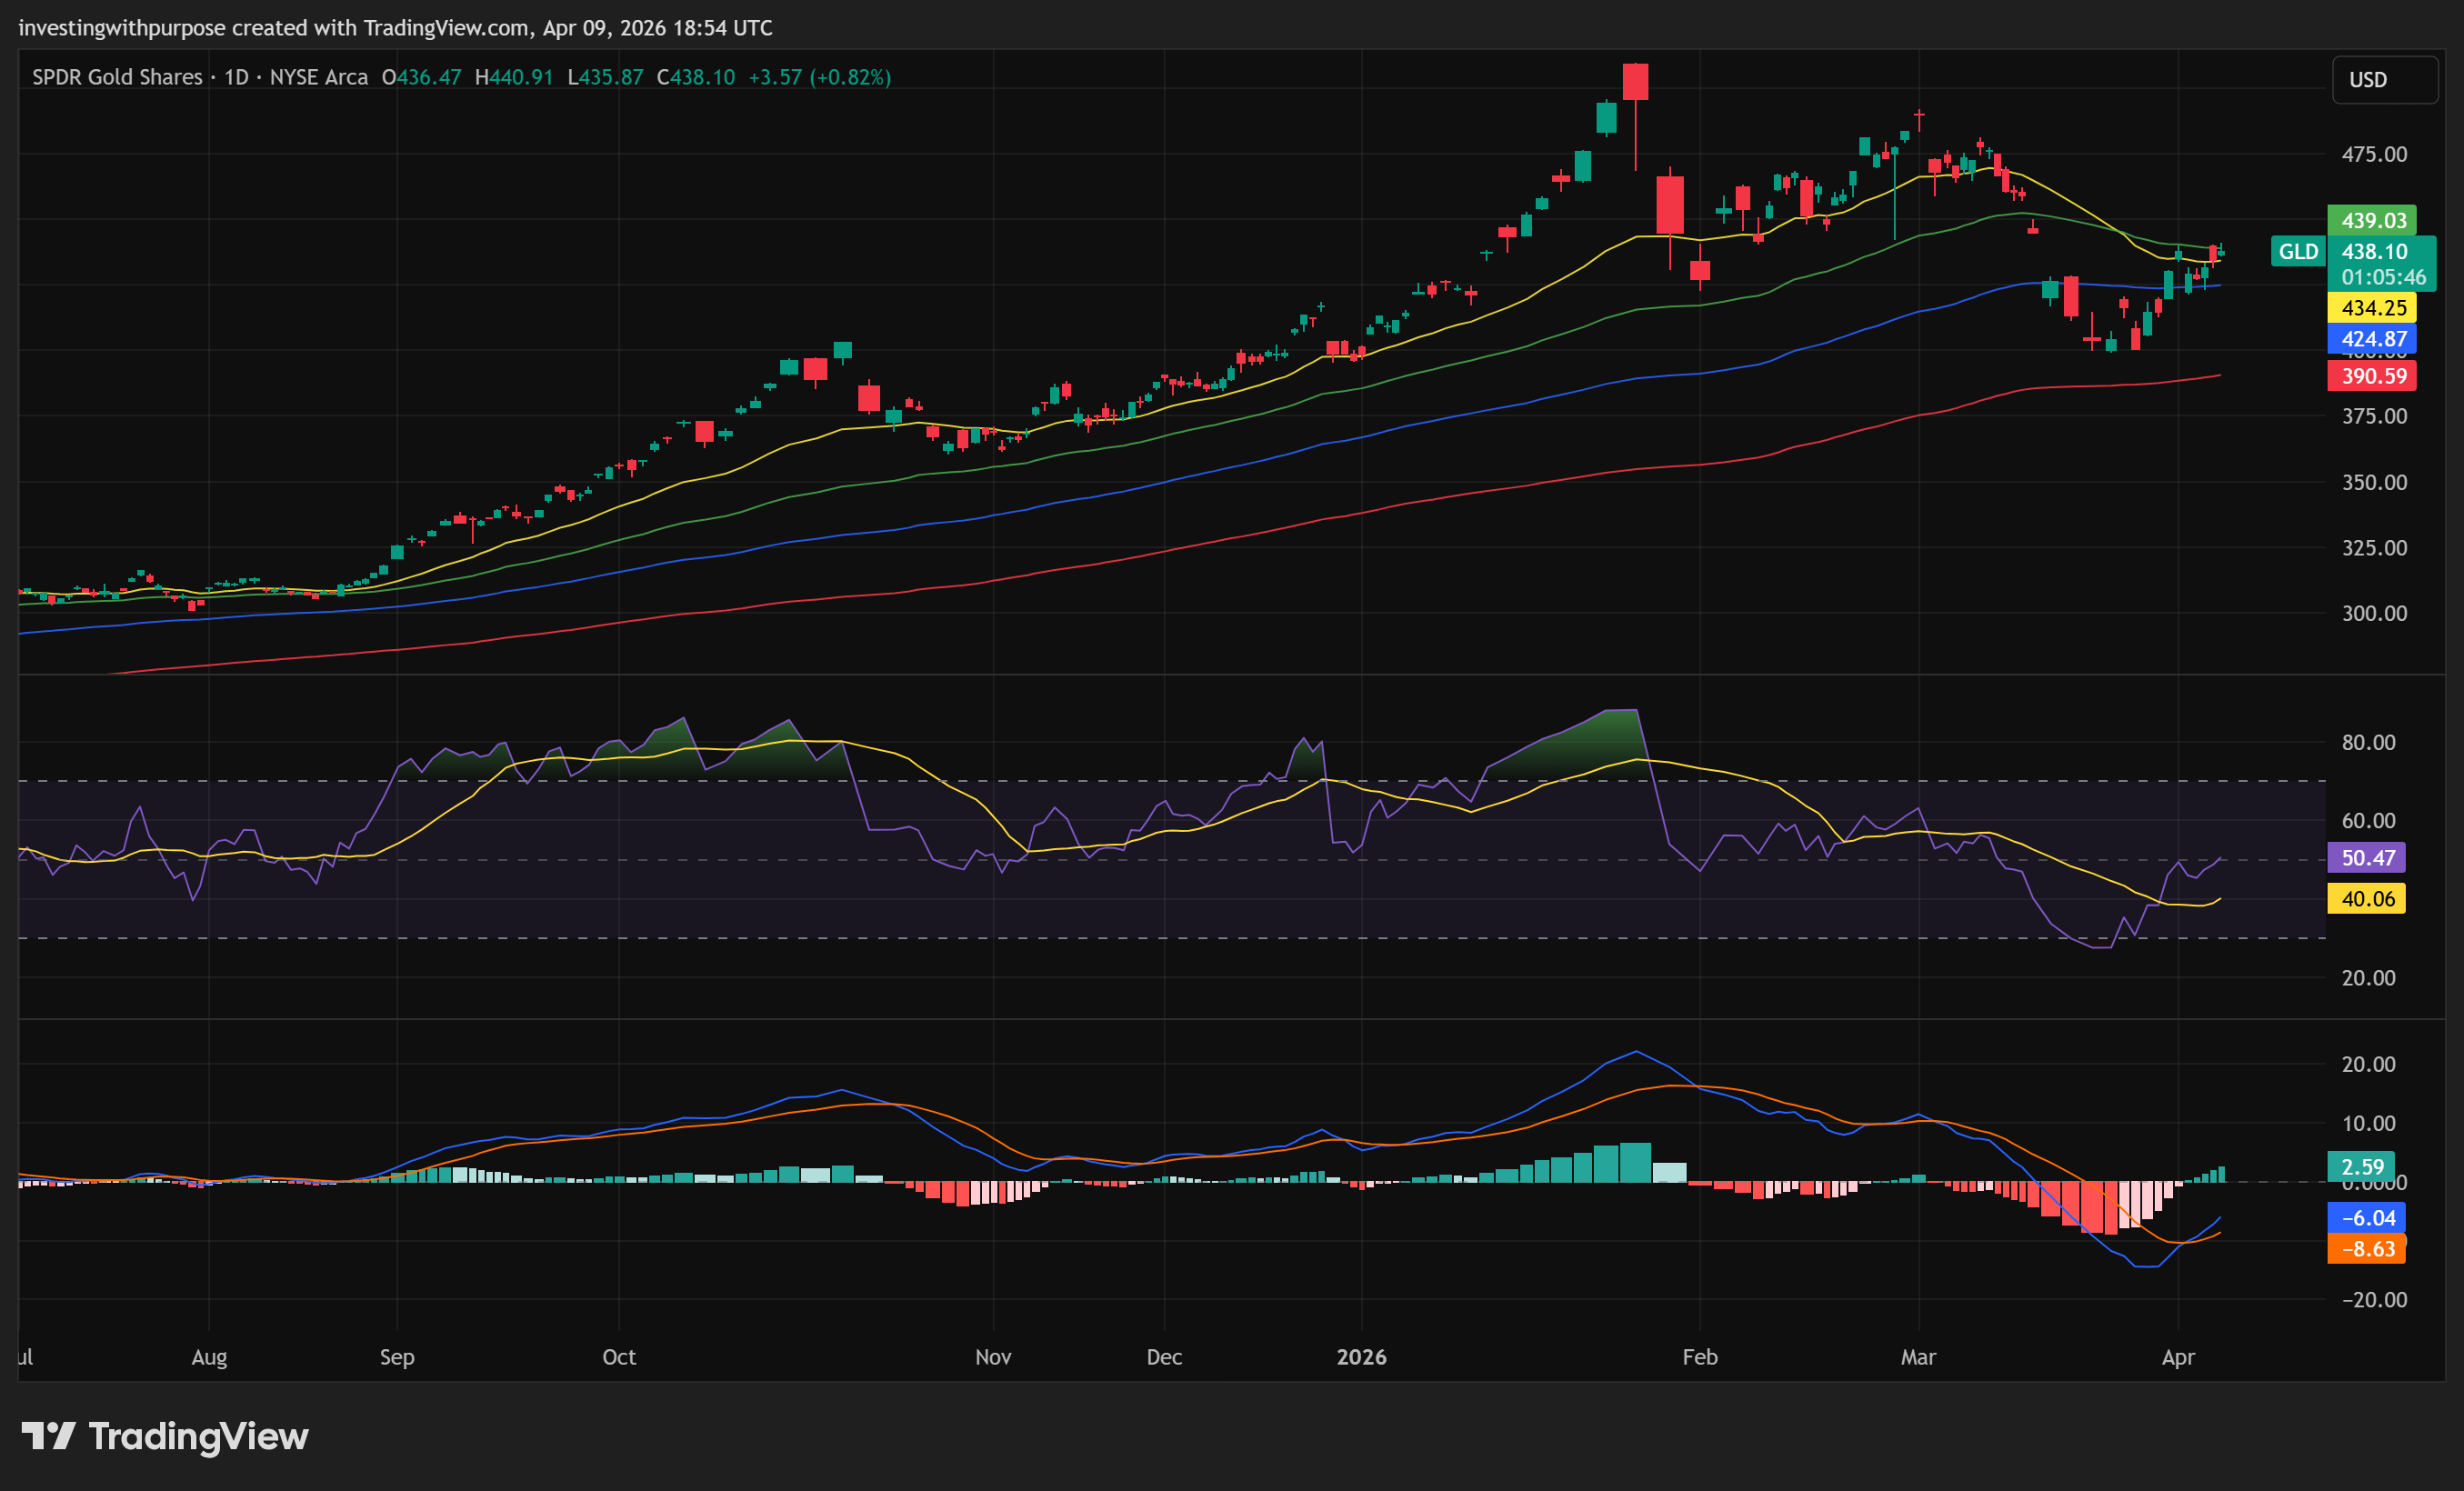
Daily MACD is improving. Both lines remain negative, but the histogram has been positive and rising for 8 consecutive bars. That is the momentum inflection. The Kalman filter has turned positive with accelerating speed, confirming the direction change is real, not noise.
The problem is timing. Daily StochRSI is at 96. Williams %R is at -1.2. Both are at extreme overbought readings. A pullback in the next 2-5 sessions is highly probable.
The daily Ichimoku is firmly bearish. Price is below the cloud, which sits between 452 and 467. That overhead supply zone is the major hurdle for any sustained recovery. A move above the cloud would be a significant structural shift.
Daily Fibonacci retracement from the swing high (510) to the swing low (360): the 50% level sits at 435 (just reclaimed) and the 38.2% at 453. Current price is between them, grinding toward the more important 38.2% resistance.
4-Hour Structure: Bullish, But Testing a Critical Level
The 4-hour chart is where the short-term mechanics live, and they are constructive.
Price is above all short-term EMAs (EMA20 at 431, EMA50 at 437, EMA100 at 439, EMA200 at 425). The EMA20 has crossed above the EMA50. MACD has crossed above zero for the first time since the selloff began. RSI is at 58, healthy with room to run.
But price is sitting at a precise confluence: the 4-hour Fibonacci 61.8% retracement from the ATH to the March low lands at 441. The Ichimoku cloud base on the 4-hour sits at 442. The daily EMA50 is at 439. The daily Kijun is at 440.
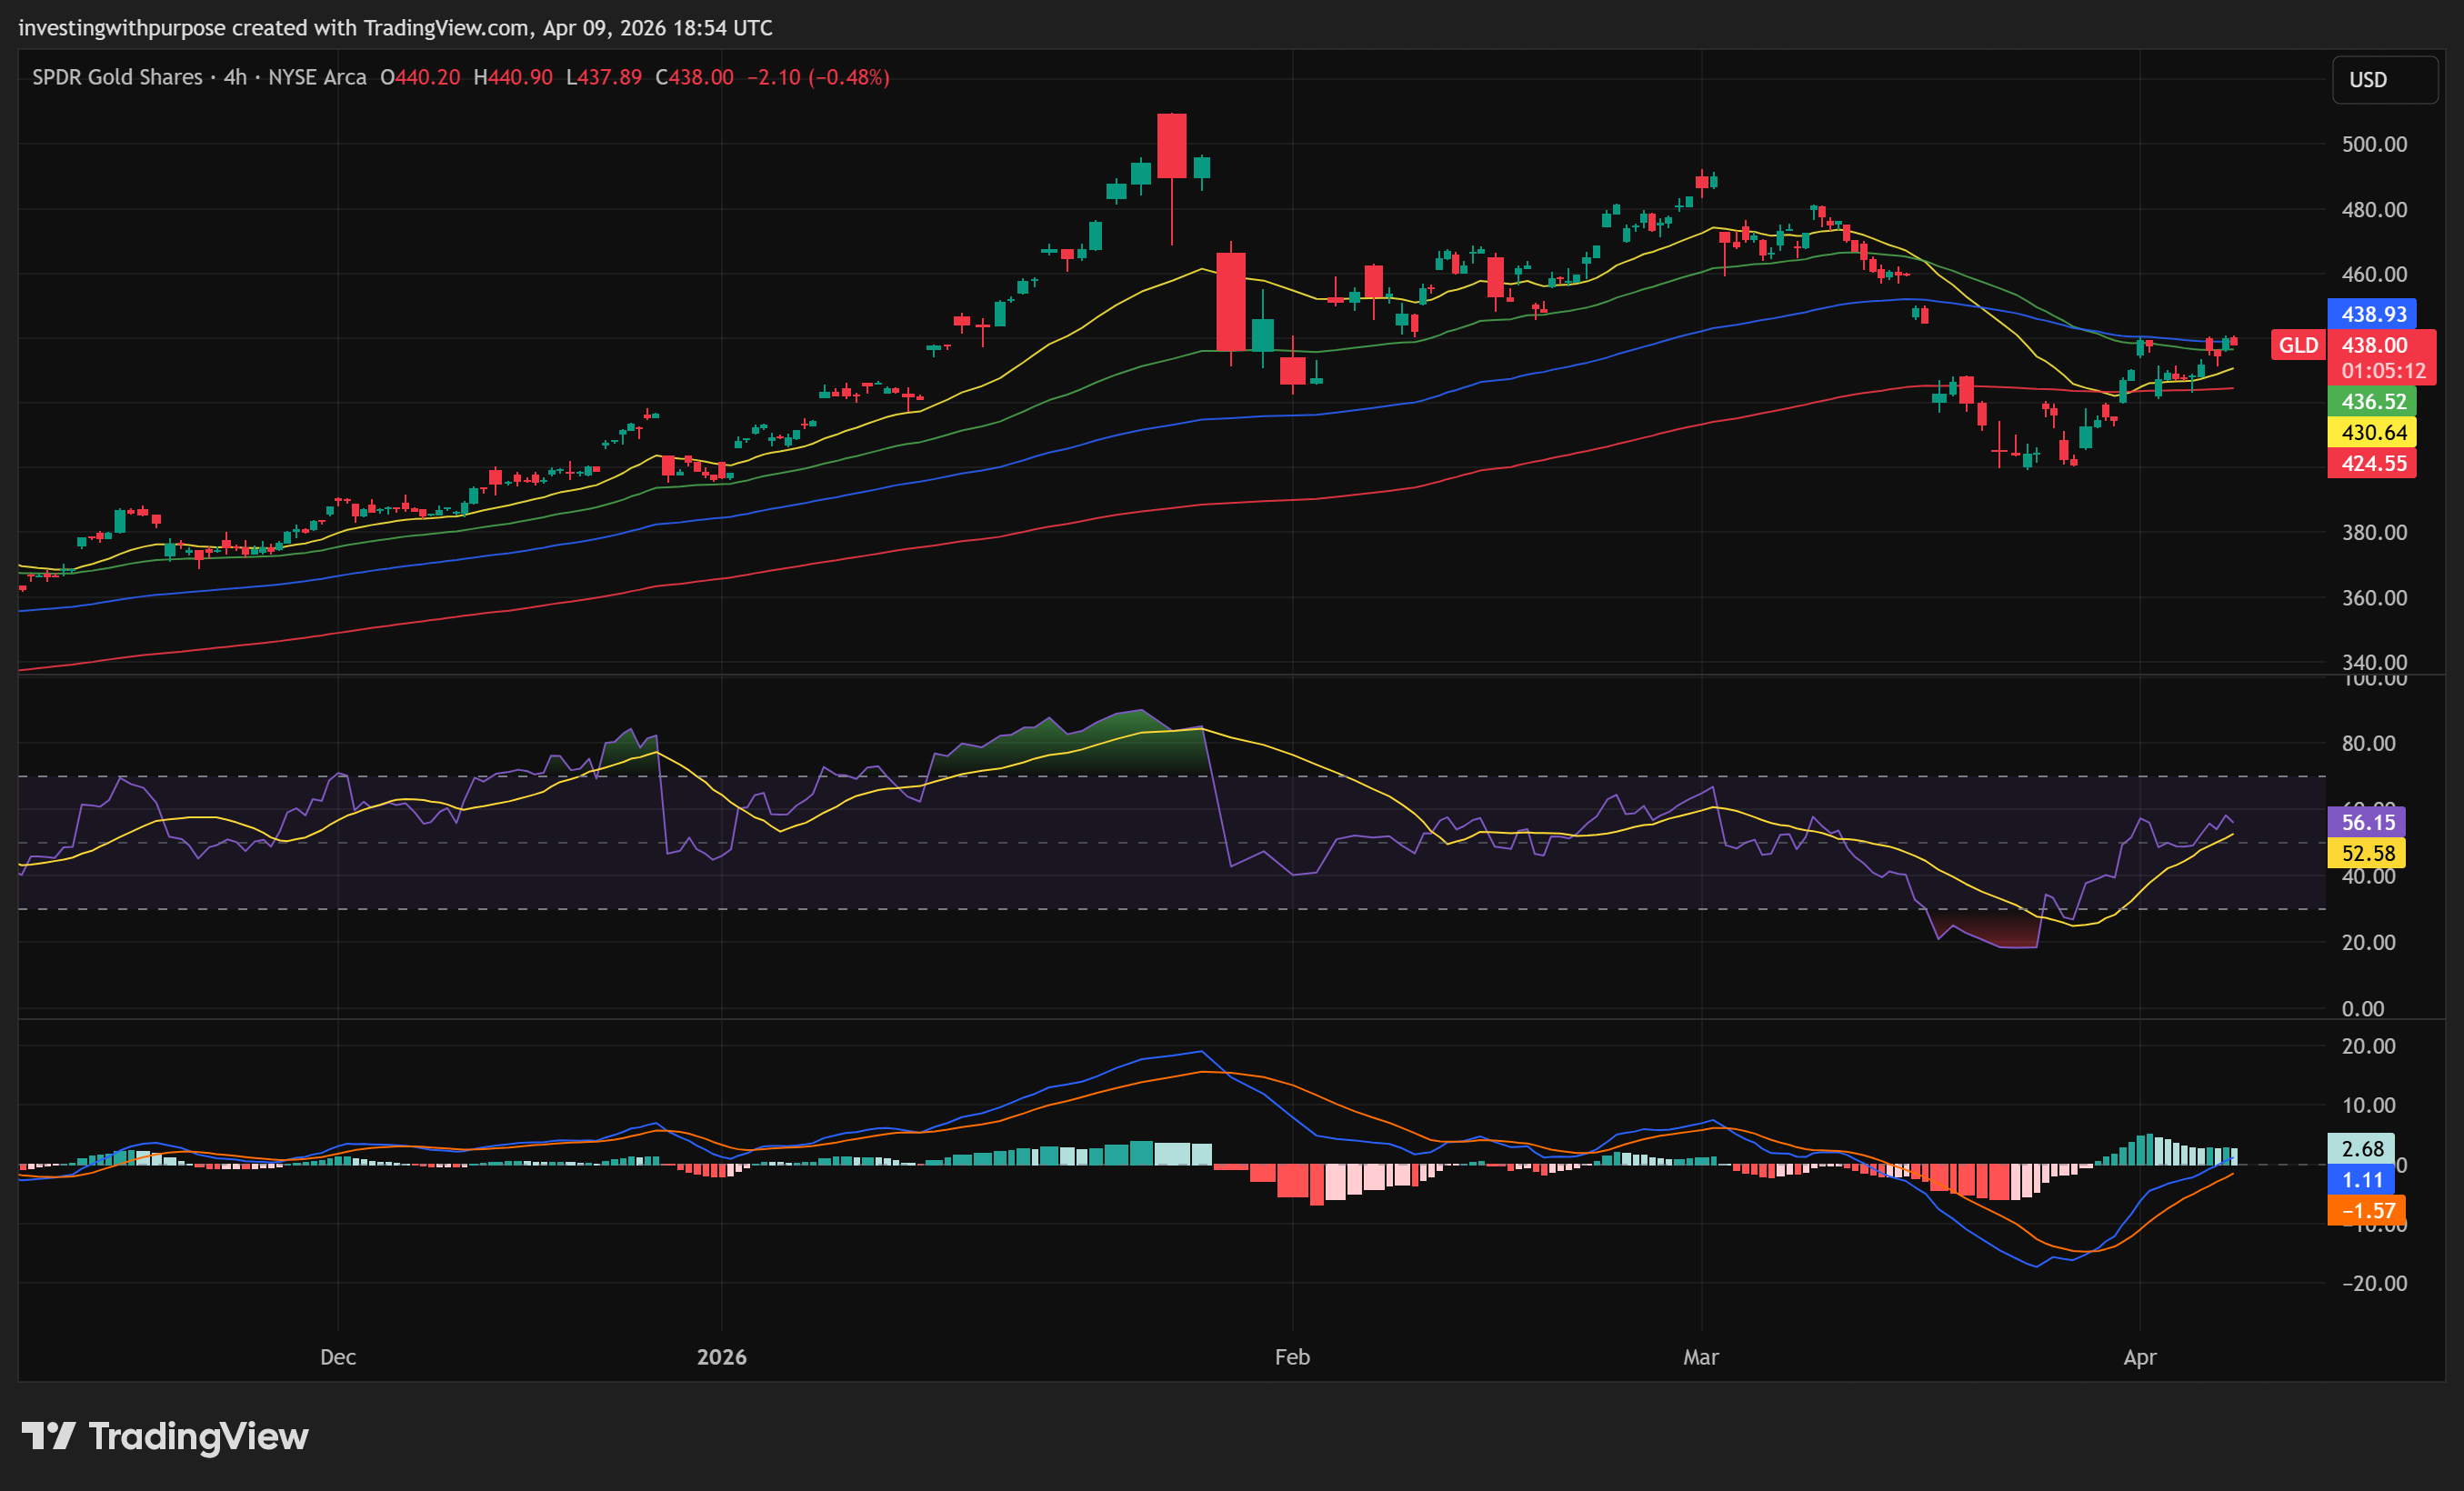
This is a four-way resistance convergence at 440-442. It is one of those levels where the resolution will define the next $20+ move.
And the volume is troubling. The 4-hour SMA20 of volume has collapsed from 9.4 million to 4.7 million. The most recent bars show volume ratios below 0.01. The move higher is happening in a vacuum. Moves on thin volume are inherently fragile.
4-hour Heikin-Ashi candles have printed 5 consecutive bullish bars. That is clean short-term momentum. But it is arriving at resistance with no volume behind it.
Technical Conclusion
The weekly structure is intact and deeply oversold, which creates a structural bid for the medium term. The daily is repairing but unconfirmed on momentum, and overbought in the short term. The 4-hour is bullish but sitting at a critical resistance confluence on evaporating volume.
The most probable near-term path is a pullback from the 440-442 zone, followed by a higher-low formation, followed by a second attempt at resistance with better conviction. The quality of that pullback, where it holds and how volume behaves, will determine whether this recovery has legs or fades.
The levels are set. Now let us build the plan around them.
Our Trade Plan
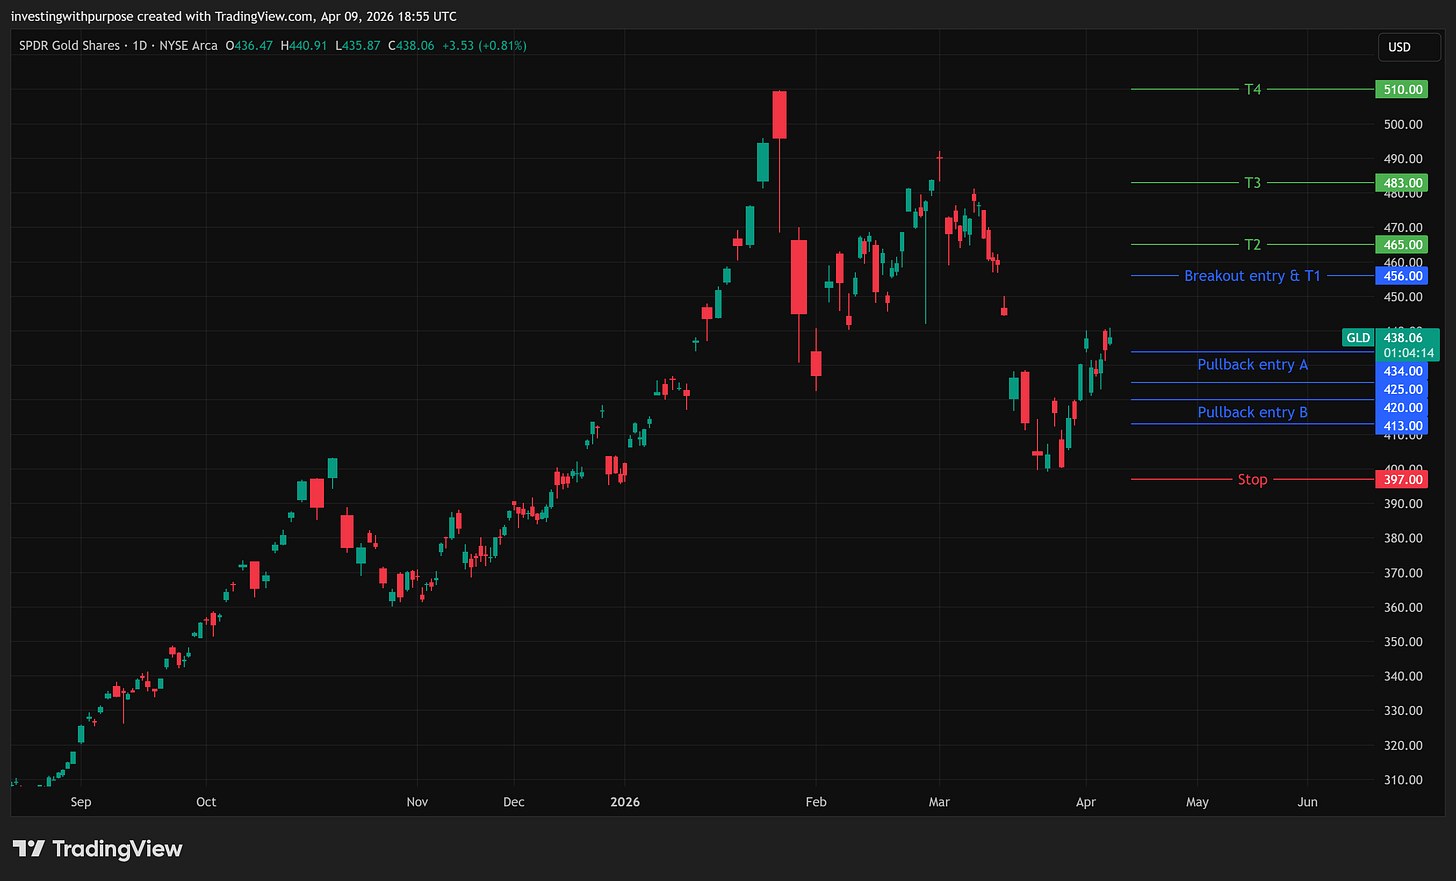
Entry Zones
Pullback entry (primary): $425-$435 (Gold $4,600-$4,740)
This is the daily EMA20, the daily Fibonacci 50%, and the 4-hour EMA50. If price pulls back from the 440-442 resistance, this is where structural buyers should re-engage. The highest-quality risk/reward in the current setup.
Pullback entry (secondary): $413-$420 (Gold $4,500-$4,570)
Daily Fibonacci 61.8%, 4-hour EMA200, and the late-March swing lows. This zone only comes into play if the first support fails. An entry here means wider risk but significantly better asymmetry.
Breakout entry: $456-$460 (Gold $4,970-$5,010) on a daily close with above-average volume
Clearing the daily Fibonacci 38.2%, the 4-hour cloud top, and the daily Ichimoku cloud base confirms the weekly uptrend has resumed. This entry trades price for conviction.
Invalidation
$397 (Gold $4,320), daily close below.
The March structural low. A break here means the recovery has failed, the weekly Fibonacci zone is broken, and the daily EMA200 (391) is under direct threat. The correction is no longer corrective. Exit fully.
Targets
T1: $452-$455 (Gold $4,930-$4,960). Daily Fibonacci 38.2%, Ichimoku cloud base, 4-hour Fibonacci 50%. First meaningful resistance above the current zone.
T2: $465-$470 (Gold $5,070-$5,120). Heart of the daily Ichimoku cloud. Clearing this confirms the trend has resumed.
T3: $483-$492 (Gold $5,260-$5,360). Prior high-volume reversal zone and 4-hour Fibonacci 23.6%. Full recovery from the March decline.
T4: $510+ (Gold $5,550+). All-time high retest. Only reachable if weekly MACD flips bullish and volume confirms.

Rolling Stop Logic
At T1, raise stop to $430. Locks in above daily EMA20 and confirms a higher low.
At T2, raise stop to $450. Price has cleared the cloud. A return below means the breakout failed.
At T3, raise stop to $465. Former cloud resistance becomes structural support.
Position Sizing
The distance between entry and stop defines risk per share. Position size should be calibrated so a stop-out represents a tolerable loss relative to total capital.
Wider stop means smaller position. Tighter stop means larger position.
Primary entry ($430) to stop ($397) is $33 risk per share. Moderate distance, standard sizing.
Secondary entry ($417) to stop ($397) is $20 risk per share. Tighter risk, allows a larger position for the same dollar exposure.
Breakout entry ($458) to stop ($397) is $61 risk per share. Wide distance, smaller position required.
Decide the maximum dollar amount you are willing to lose before entering. Divide by risk per share. That is your size.
Bottom Line
Gold’s bull market is not over. The 22% correction was violent, but it held exactly where it needed to hold: above the weekly EMA50, above the daily EMA200, and within the Fibonacci retracement zone that defines a healthy correction in a secular uptrend.
The structural forces, central bank buying at 800+ tonnes per year, inelastic mine supply, and persistent geopolitical risk, have not changed. If anything, lower prices have made them more potent.
But the recovery is not yet proven. Volume on the bounce is significantly weaker than volume on the decline. Short-term oscillators are stretched. And price is sitting at the most important resistance confluence on the chart at 440-442.
This is a patience setup, not a chase setup.
The optimal positioning is to wait for a pullback into the $425-$435 zone, where risk is clearly defined and the reward path to $465+ offers attractive asymmetry. If price breaks above $455 on volume, the breakout entry becomes valid with a different risk profile.
The single most important level remains $397. Above it, the bull case is alive and the structural floor holds. Below it, the thesis changes entirely.
Position around the levels. Let the market come to you. And when it does, size the trade based on the risk you can define, not the return you hope for.
This article is for informational and educational purposes only and reflects personal opinion, not individualized investment advice. Nothing here should be interpreted as a recommendation to buy, sell, or hold any security. All investments involve risk, including the potential loss of principal. Market conditions can change quickly, and past performance does not guarantee future results.