


What both earnings lines are hiding, and why 1 of them had to sell stock.
Alphabet and Microsoft both reported after the US close on Wednesday 28 October. Alphabet opened Thursday 11.7% lower, at $286.77 against a $324.89 close. Microsoft opened 1.7% higher at $540.21 and gave it back. At 12:58 New York time, with the session still running, Alphabet traded at $284.51 and Microsoft at $524.92, against a Nasdaq 100 fund down 1.4%.
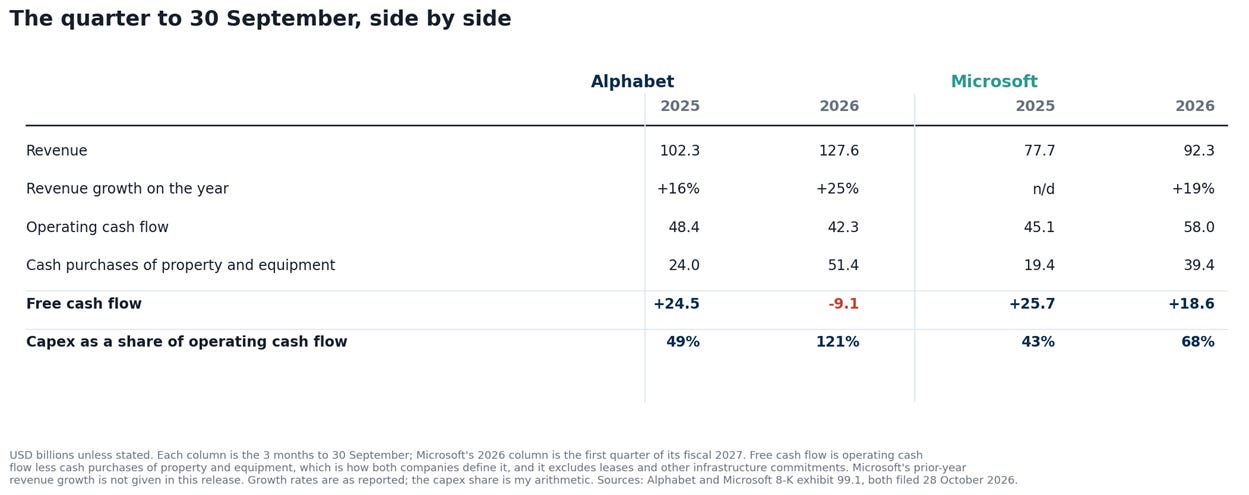
Capital expenditure, or capex, is cash spent on property and equipment. Free cash flow here means operating cash flow less that cash capex, which is how both companies define it. Both roughly doubled the first. Only 1 of them kept much of the second.
Neither Earnings Line Tells You Much
Alphabet’s diluted EPS was $2.12 against $2.87. Other income swung from positive $12.8bn to negative $8.2bn, and the $8.7bn loss on equity securities alone cost $0.55 of EPS. These marks dominate: across 9 months Alphabet booked a $126.8bn gain on securities, which is why year-to-date net income reads $201.2bn.
Microsoft’s line moved the other way. GAAP diluted EPS of $4.92 was up 32%, but its OpenAI investments produced a $207m net gain this quarter against a $3,086m loss a year ago, a $3,293m swing. Microsoft publishes the adjusted figure itself: $4.89, up 18%, close to the 21% growth in operating income.
One EPS understates a good quarter, the other overstates one. Ignore both and look at the cash.
The Cash, With The Fine Taken Out
Alphabet spent $51.4bn on property and equipment against $24.0bn a year ago. Operating cash flow fell to $42.3bn from $48.4bn, leaving reported free cash flow of minus $9.1bn.
That reported figure includes a one-off. Note 10 of the 10-Q discloses that in July 2026, after the European Court of Justice rejected its final appeal on the Android case, Alphabet paid $5.2bn in cash for the fine plus accrued interest. July sits inside this quarter.
Strip that payment out as an illustration and operating cash flow was about $47.5bn, roughly level with last year, and free cash flow about minus $3.9bn. That is the more useful number, and it is still negative. On that basis the swing from a positive $24.5bn a year ago is almost entirely capex, not a collapse in cash conversion.
Where conversion did absorb cash: inventory took $2.7bn more than last year, and the balance sheet shows inventory at $13.3bn against $2.4bn at the start of the year. Alphabet now sells TPU systems, so it buys components and builds machines well before it delivers them. Cash goes out before it comes in, and a business scaling hardware needs structurally more working capital rather than a one-off bulge that unwinds.
A single quarter isn’t a trend. The first half of 2026 produced positive free cash flow in aggregate; the 9-month deficit of $4.8bn is driven by this quarter alone.
The Operating Margin, Adjusted Once
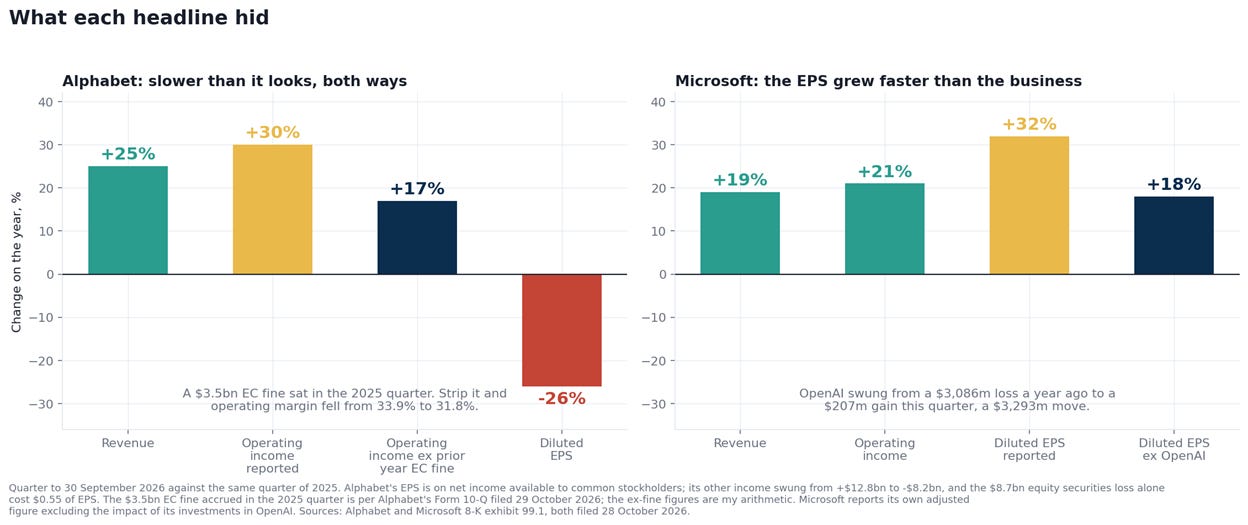
Alphabet’s release leads with operating income up 30% and a 31.8% margin. The 10-Q notes that general and administrative costs fell partly because the 2025 quarter carried a $3.5bn European Commission fine, a separate matter from the Android payment above.
Add that one item back to the base and operating income grew about 17% on revenue up 25%, with margin at roughly 33.9% against 31.8%. That is a partial adjustment for 1 known prior-year charge, not a clean underlying margin.
The mix is improving regardless. Google Cloud’s operating income went from $3.6bn to $11.1bn, lifting its margin from 23.7% to 36.2%. Services earned $39.2bn. Other Bets lost $2.0bn and Alphabet-level activities, mostly shared AI research, lost $7.7bn against $4.5bn. Management has flagged that renting third-party capacity brings near-term Cloud margin pressure, so the 12-point expansion isn’t a run rate.
In advertising, the slowest line was Google Network at about 1%, not YouTube, which grew 9% to $11.2bn. Traffic acquisition costs rose 10% to $16.4bn, marginally slower than the 10.6% growth in the advertising revenue they attach to.
Why Dilution Matters Here
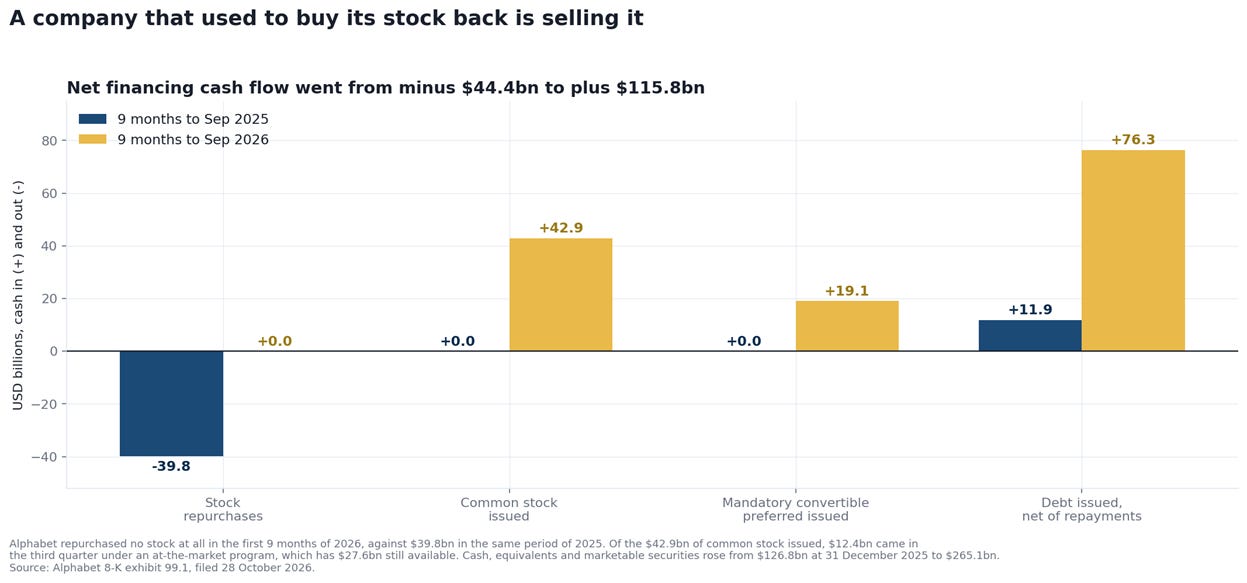
Over 9 months Alphabet repurchased no stock, against $39.8bn in the same period of 2025. It took $42.9bn of net proceeds from common stock, largely through an at-the-market program that sells shares gradually at prevailing prices, and $19.1bn from mandatory convertible preferred. Long-term debt went from $46.5bn to $125.1bn, with the quarter’s $28.7bn of notes stated as being for general corporate purposes.
Raising capital isn’t a failing. The issue is per share. A buyback shrinks the count so each remaining share owns more of the business; issuing does the reverse, and the preferred adds further dilution when it converts or when dividends are settled in stock. Alphabet has moved from one side of that ledger to the other within a year.
It’s worth being precise about scale. The $62bn of equity and preferred raised this year is far larger than the quarter’s cash deficit, and the filings describe general corporate purposes rather than a specific project. What the raise funds is not something the disclosures establish.
What The Cash Pile Actually Contains
Alphabet reports $265.1bn of cash, equivalents and marketable securities. The composition matters.
Cash and equivalents are $56.3bn. Of the $208.8bn of marketable securities, $90.4bn is equities, and the 10-Q notes that this includes $75.2bn of SpaceX shares subject to short-term restrictions on the ability to sell. Government, corporate and asset-backed debt makes up about $118.4bn. Separately, non-marketable equity securities carry a value of $128.2bn and have no ready market at all.
So the genuinely liquid, non-equity resources are closer to $175bn than $265bn, against $125.1bn of long-term debt. That’s still a formidable balance sheet. It is a different one from the headline.
What Free Cash Flow Leaves Out, On Both Sides
Free cash flow as defined above excludes operating lease payments beyond those already in operating cash flow, finance lease principal, and future commitments not yet incurred.
Alphabet discloses $802.1bn of contractual obligations with terms beyond a year, mostly long-term supply agreements for infrastructure and inventory running through 2032. Microsoft discloses $364.6bn of leases, primarily datacenters, not yet commenced at 30 September, starting between fiscal 2027 and 2034.
These are future obligations, and neither figure shows a company unable to fund its investment. They do mean that “free cash flow covers capex” describes this quarter’s cash, not the full capacity program either company has committed to.
Backlog On Both Sides
Microsoft’s commercial remaining performance obligation, contracted revenue not yet recognized, was $677bn at 30 September, up 73% on the year with a weighted average duration of about 2.3 years and roughly 30% expected within 12 months. Set against the $678bn it reported at 30 June, it was broadly flat over the quarter, so the annual growth rate flatters the recent trend.
Alphabet’s revenue backlog was $567.7bn, with $560.8bn in Google Cloud and just over 55% expected as revenue over 24 months. 2 details belong with it: Alphabet widened the definition in the first quarter of 2026 to include contracts of a year or less, and $16.8bn relates to a multi-year agreement with Crux AI, an equity method joint venture and related party in which Alphabet has committed backstops of up to $10.0bn.
Backlog evidences demand and revenue visibility. It says nothing about margin, about when cash arrives, or about returns on the capital being spent to serve it.
Microsoft’s Quarter
Revenue of $92.3bn grew 19%, operating income of $45.9bn grew 21%, Azure grew 48% and Microsoft Cloud reached $63.9bn, up 30%. Operating cash flow grew 29% to $58.0bn, funded $39.4bn of capex and left $18.6bn, and Microsoft returned $10.2bn to shareholders and repaid $4.85bn of debt. Devices and consumer revenue fell 3%, with Windows and devices down 22%.
Microsoft’s free cash flow still fell 27%, from $25.7bn. Capex is outgrowing cash generation at both companies. Microsoft is far enough ahead that the line stays comfortably positive.
Bottom Line
On funding quality the preference is Microsoft. It covered a doubled capex bill from operations, kept $18.6bn, returned capital rather than raising it, and its reported earnings needed only the adjustment it makes itself. Alphabet grew faster and expanded its Cloud margin more, while funding the quarter with negative free cash flow, a halted buyback and $62bn of new equity and preferred.
This is a judgement about funding, not valuation. Positive free cash flow shows Microsoft can pay for this year’s capacity; it says nothing about the return either company earns on it, and I haven’t made a valuation case for either.
The counterargument for Alphabet is strong. Excluding the $5.2bn fine, operating cash flow was roughly flat while revenue grew 25%, so the cash shortfall is overwhelmingly the choice to build. Cloud operating income more than tripled, the backlog behind it is $560.8bn, and a company holding $175bn of liquid resources can fund a deficit of this size without issuing anything. On that reading the share reaction prices a changed funding model rather than a damaged business.
What would shift the preference: Alphabet converting revenue growth into operating cash flow growth, capex settling back within operating cash flow, and issuance that is matched by earnings per share still rising, since the test is dilution against returns rather than issuance itself. The 2027 capex figure management declined to give, promised for the fourth-quarter call, is the next marker. For Microsoft, watch whether commercial backlog resumes sequential growth and whether capex keeps closing the gap on operating cash flow.
This is research and commentary, not personal investment advice. The author may hold positions in names discussed.