
Infineon. The Trade That Keeps Giving.
The market is finally paying attention to what was hiding in plain sight.

We don’t say this often, because the market has a way of humbling everyone eventually. But this one played out the way it was supposed to.
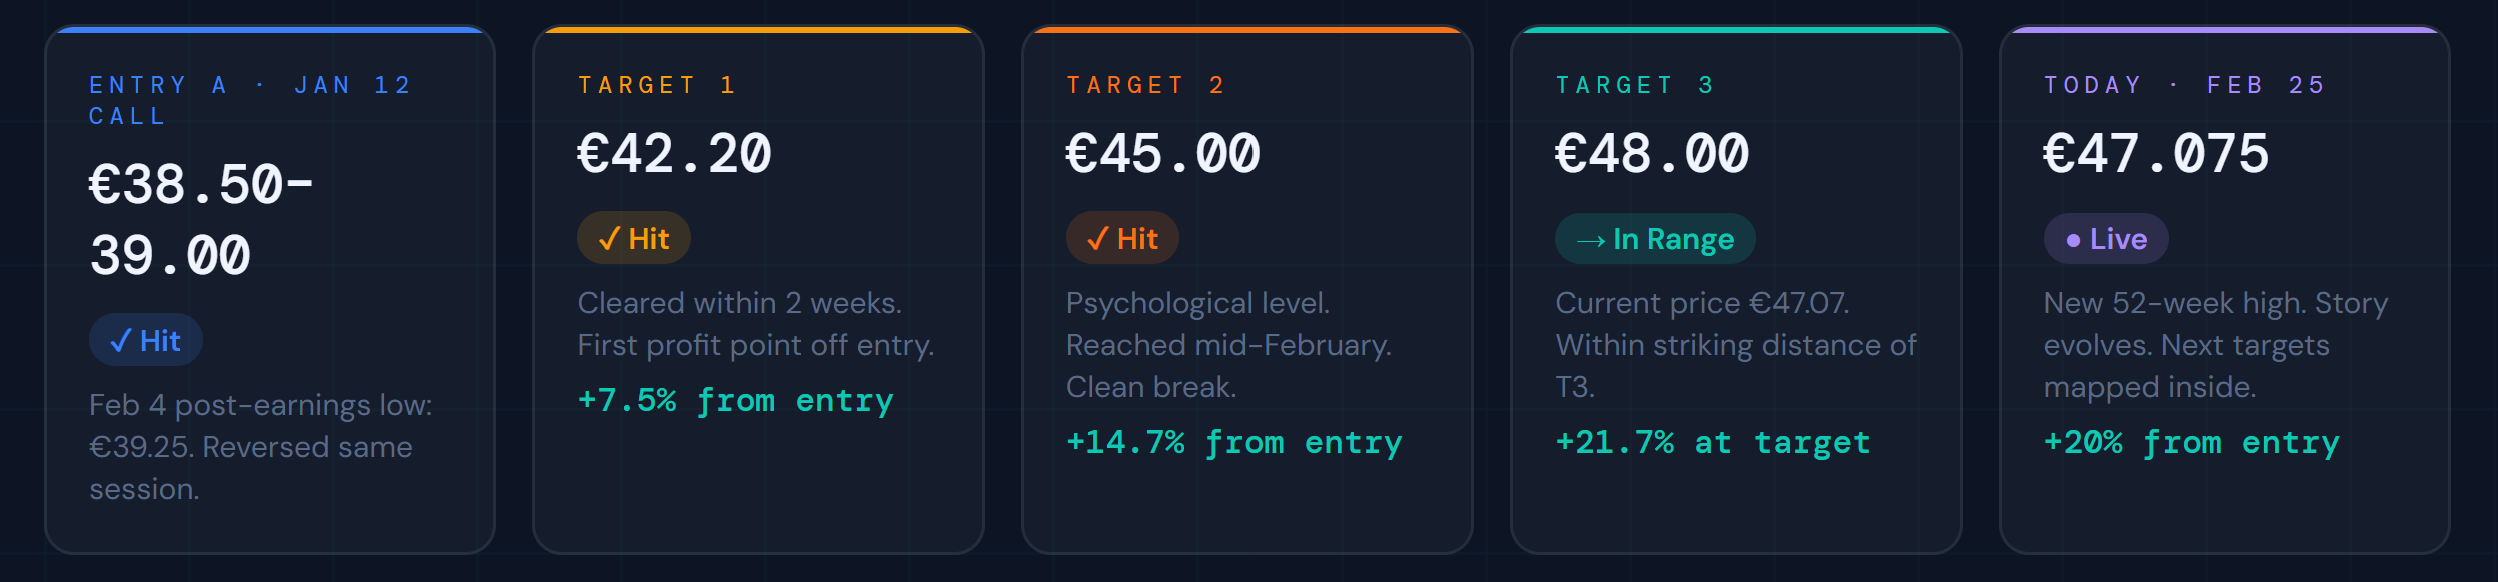
In our January 12 piece, “The Quiet Winners of Europe’s AI Chip Cycle,” we covered Infineon alongside ASML and Aixtron as part of the broader European semiconductor power stack. At the time, IFX (XETR) was trading near €41. We laid out 3 pullback entry zones, with Entry A at €38.50 to €39.00, and 3 price targets: €42.20, €45.00, and €48.00.
The stock pulled back to exactly that zone on February 4, following earnings. It touched €39.25 intraday and reversed hard. From there it ran through all 3 targets in sequence. T1 at €42.20 cleared within weeks. T2 at €45 and T3 at €48 followed. It’s at €47.075 today, holding right in the zone we mapped.
We’re not here to take a lap. We’re here because the story has materially evolved since January, and the next chapter is more interesting than the last one.
The German semiconductor company, listed on XETRA, has spent the better part of two years being dragged through a brutal inventory correction in its automotive and industrial segments. Revenue fell. Margins compressed. The stock was cut nearly in half from its peak. None of that was fun. But what was building underneath it the whole time; a pipeline of AI power infrastructure contracts, a once-in-a-generation factory investment, and a set of design wins that position Infineon as a critical supplier to the datacenters running the AI economy, is now beginning to surface in the numbers.
Q1 FY2026 results, reported February 4, confirmed the turn is underway. This article unpacks what changed, what it means, and how to think about the stock today at €47.
Key Takeaways
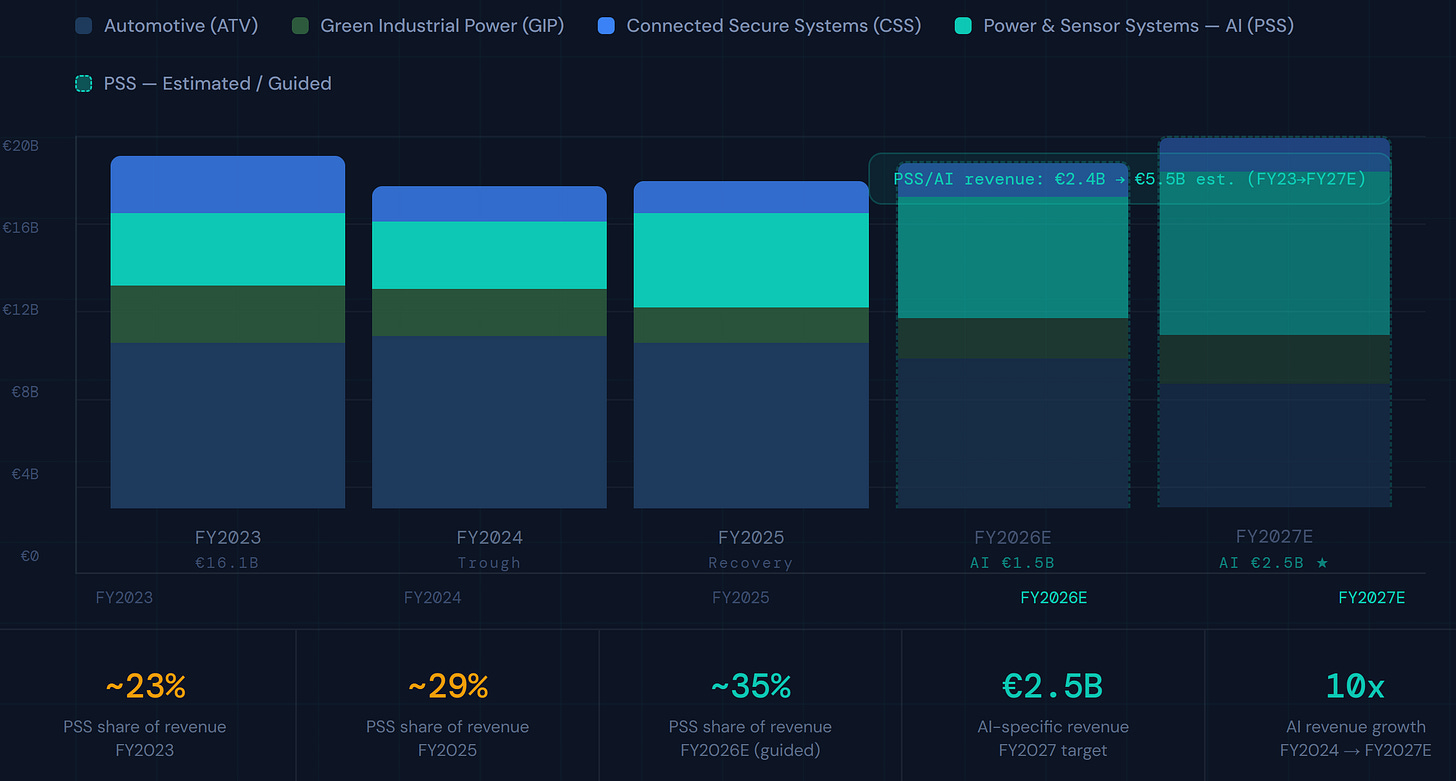
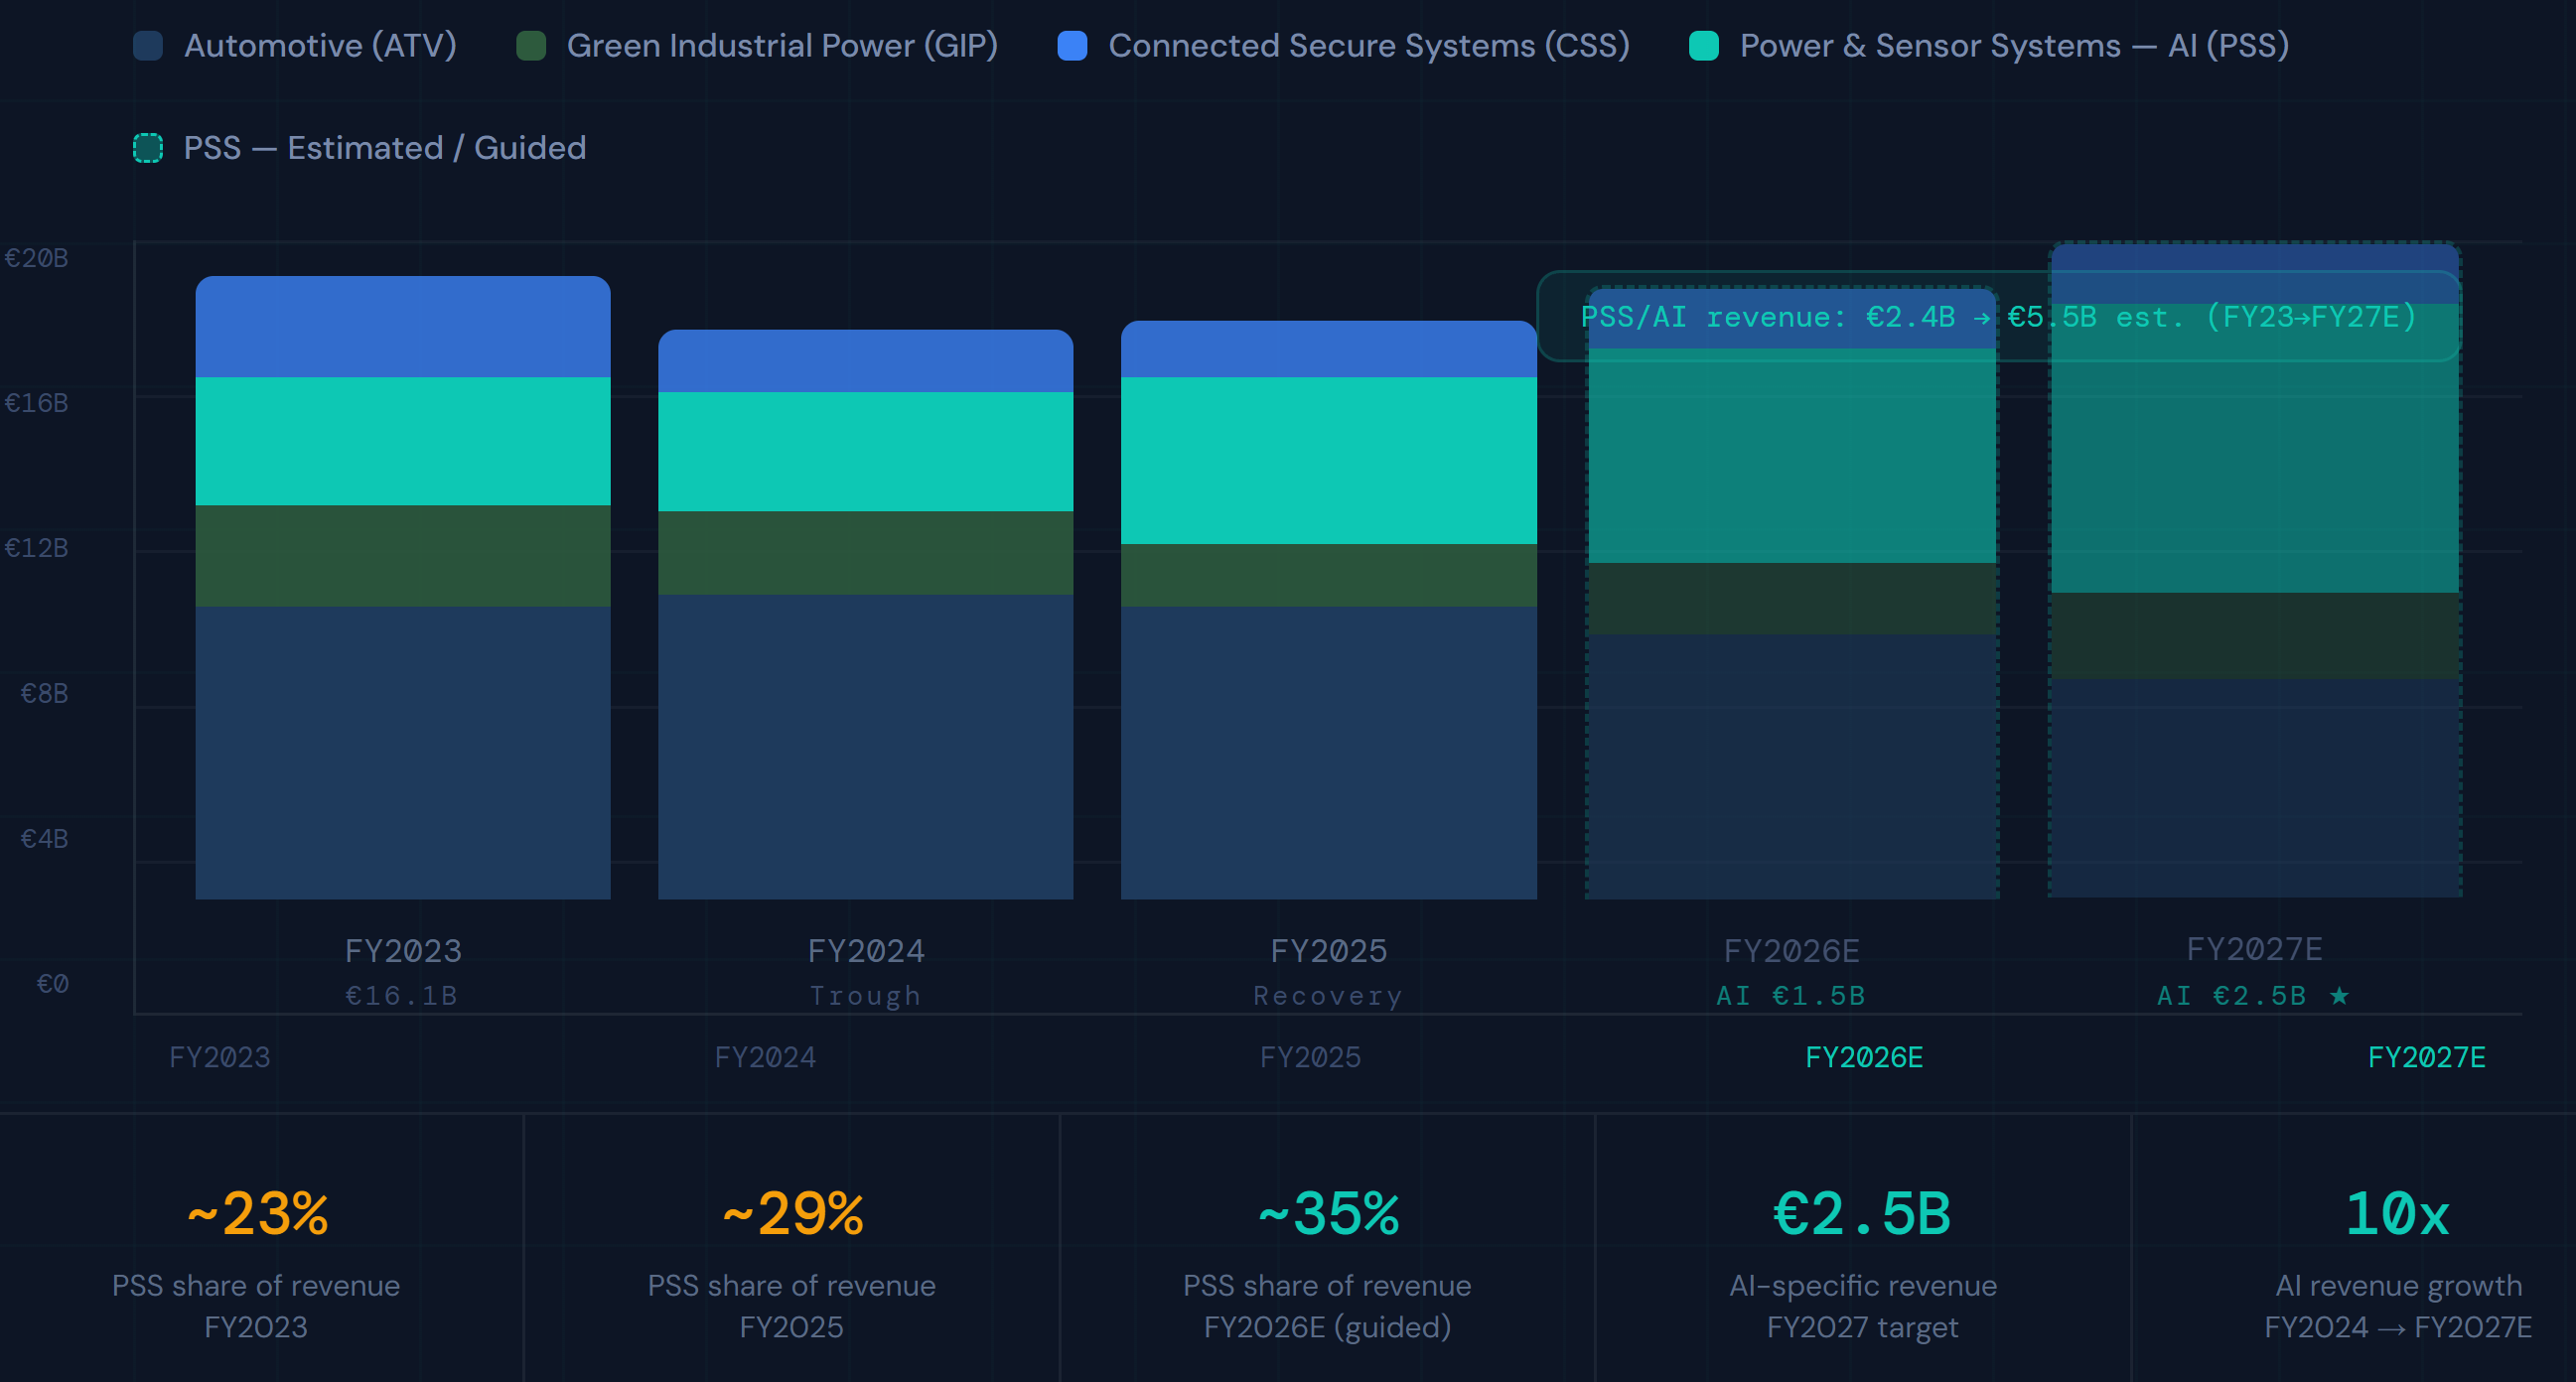
Infineon’s AI power business is growing toward €1.5 billion in revenue this fiscal year, with €2.5 billion targeted by FY2027. That’s a near-10x expansion in 3 years.
The company is the first semiconductor supplier to partner with NVIDIA on next-generation AI datacenter power architecture. That is not a small detail.
A €5 billion factory in Dresden is on schedule to open this summer. It was built specifically for the AI power opportunity.
The stock recovered 46% from its February lows in 3 weeks. It is not cheap on a trailing basis. But the forward earnings picture changes significantly as AI revenue scales.
The most important number right now is €43. That’s where the medium-term buy case becomes genuinely compelling on a risk-adjusted basis.
What the Business Actually Does, and Why That Matters Now
Most of the interesting things at Infineon are happening in the segment investors understand least.
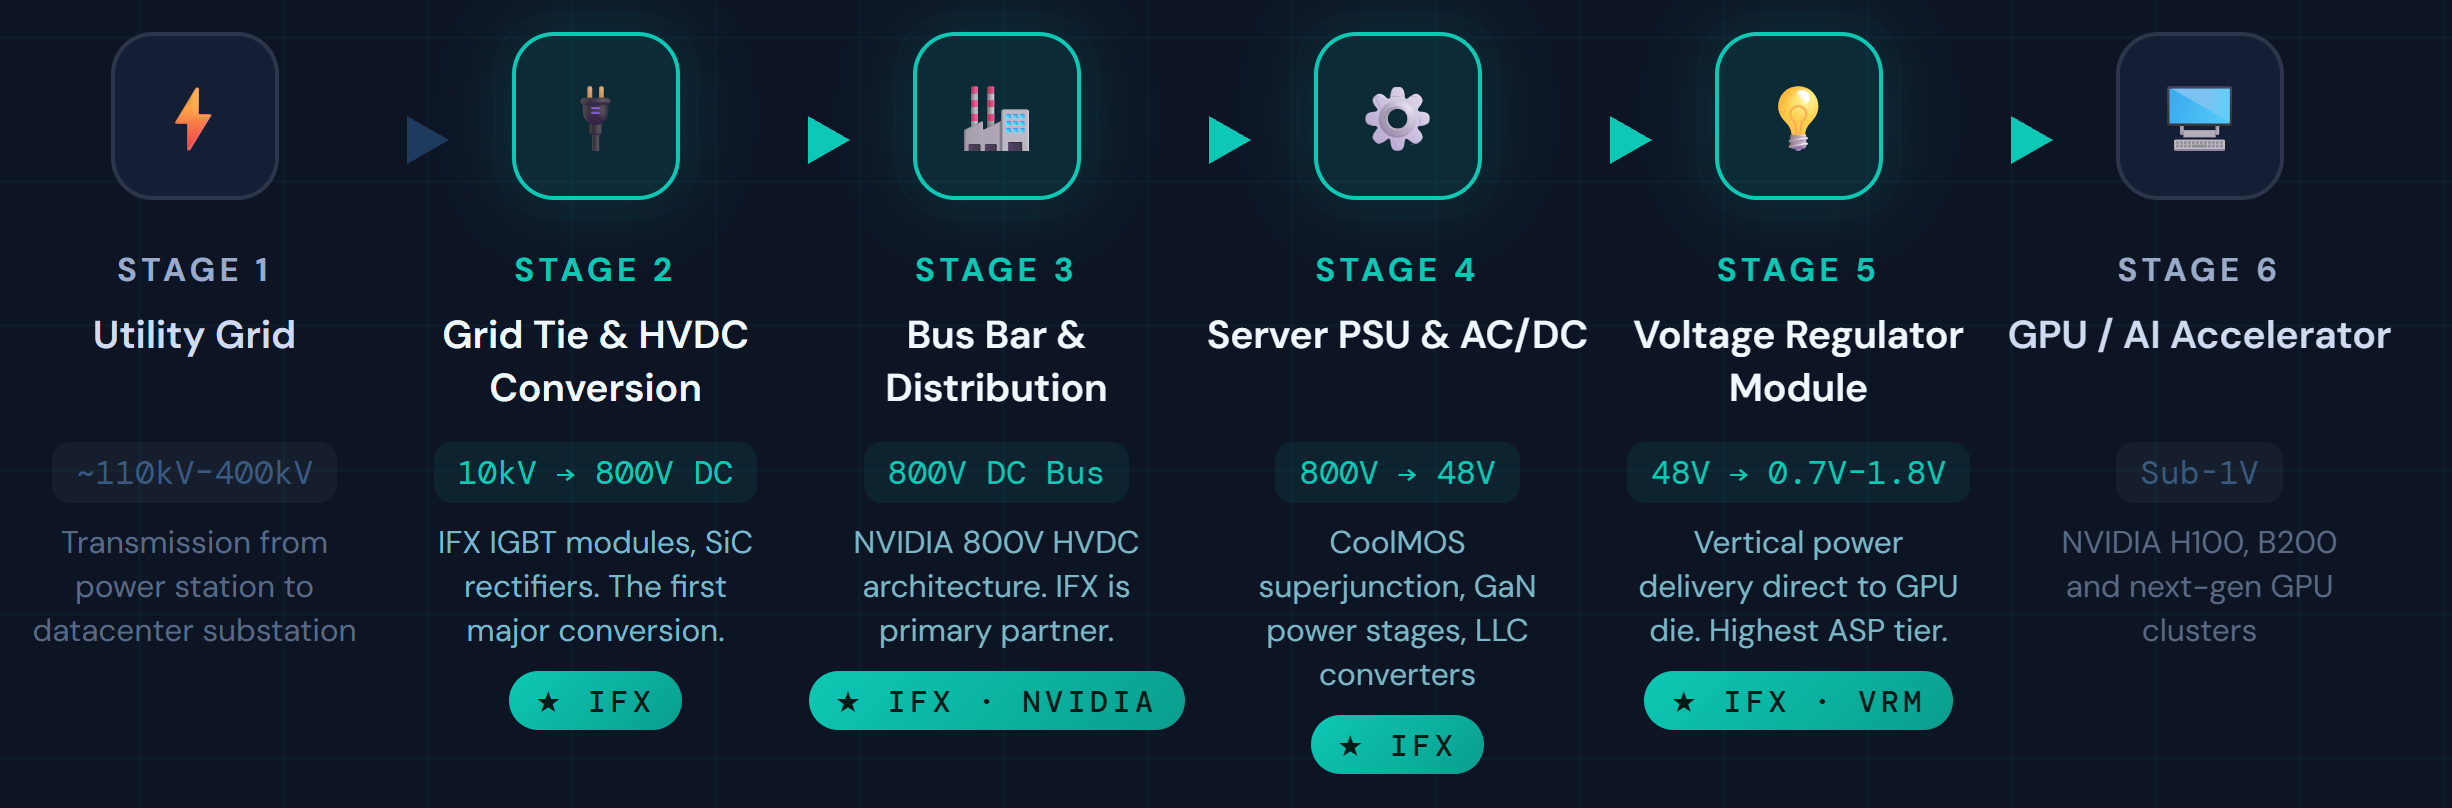
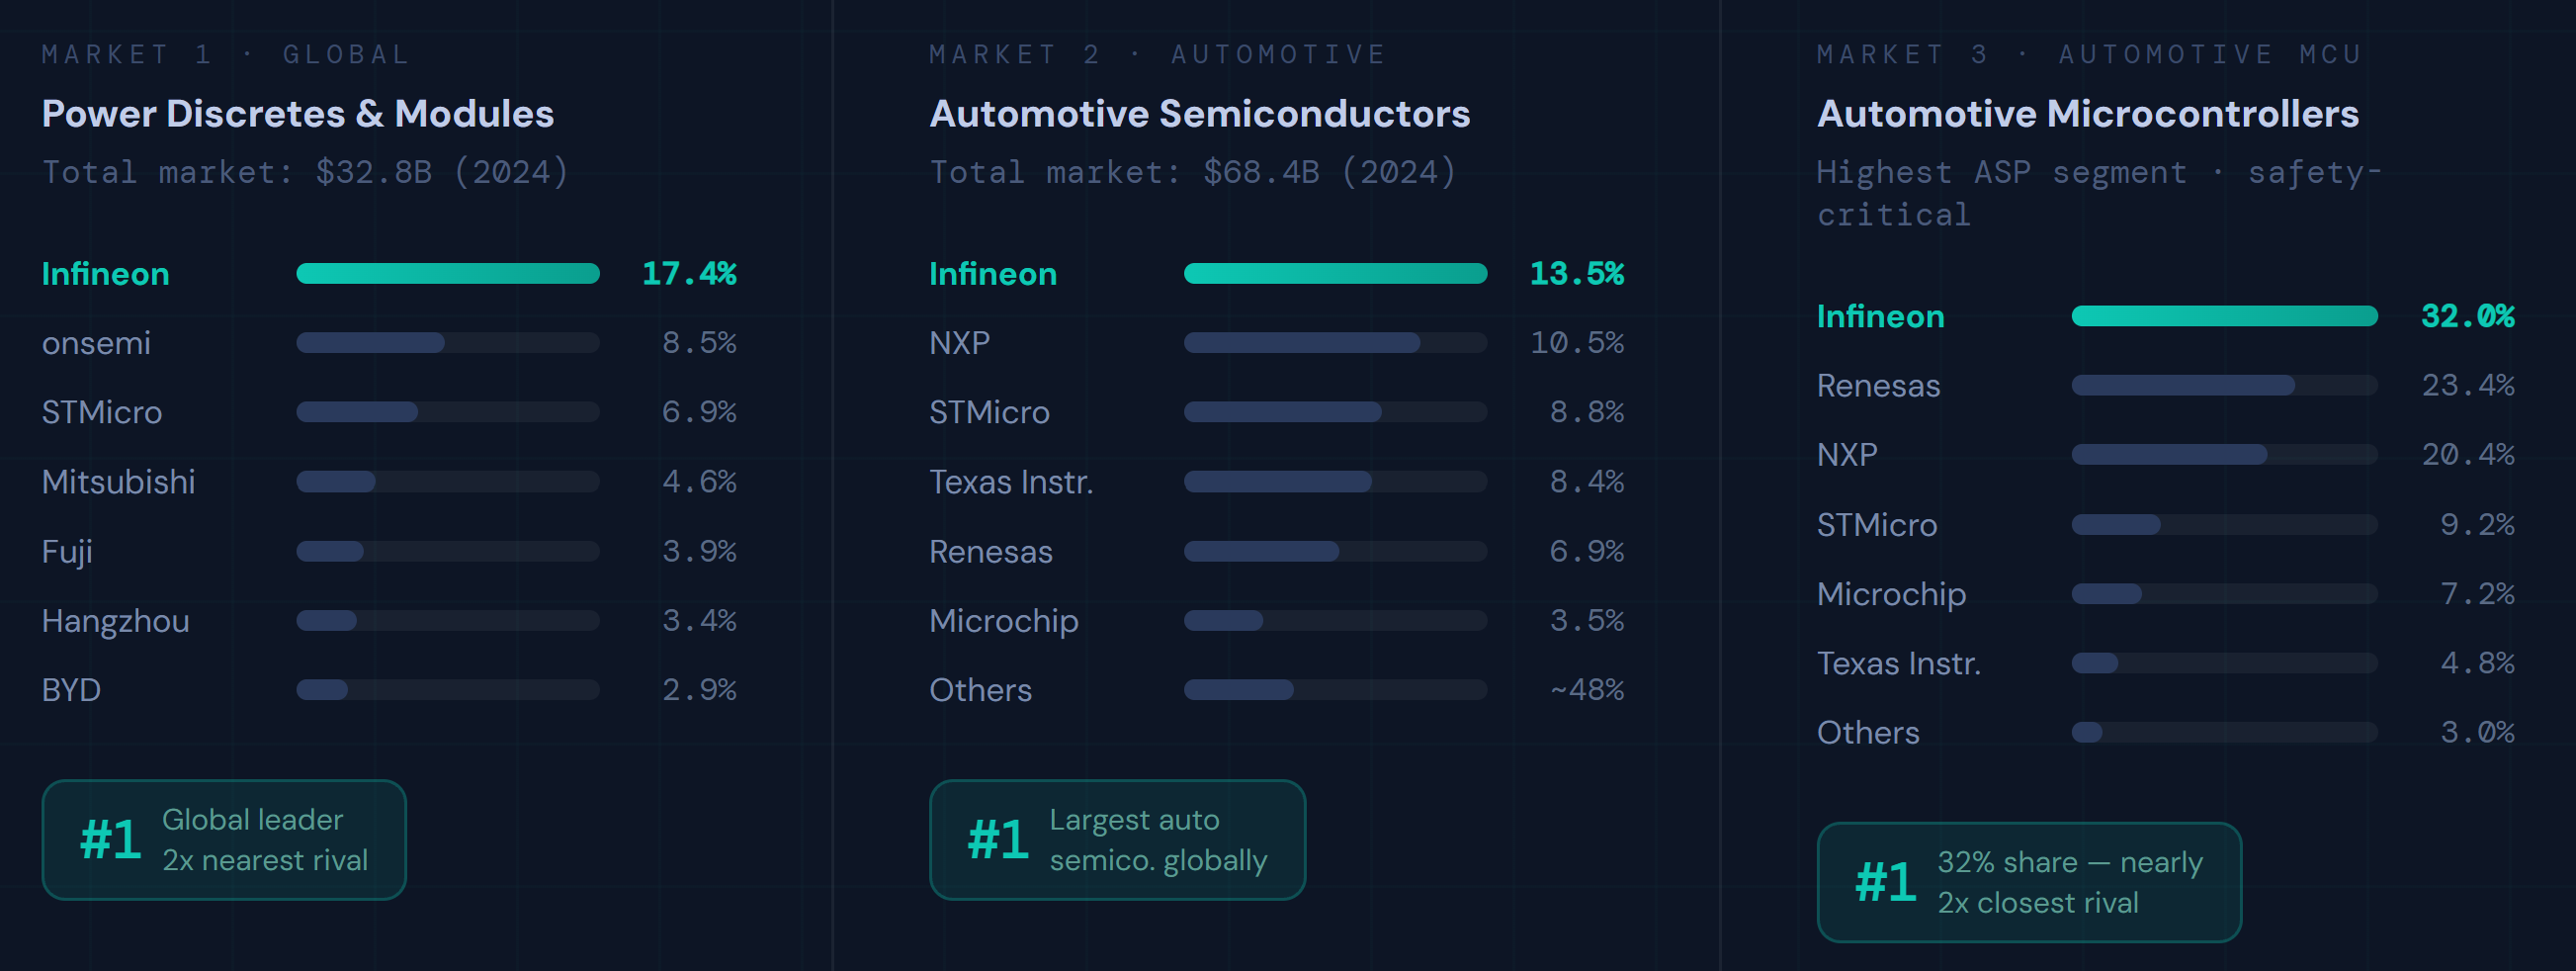
Infineon makes semiconductors. But not the chips that process data. It makes the chips that manage, convert, and deliver power. That distinction matters enormously.
Every AI datacenter runs on enormous amounts of electricity. Getting that electricity from the grid to the actual compute chips, and doing it efficiently at scale, requires layers of sophisticated power conversion. Voltage drops from thousands of volts to single-digit volts across multiple stages. Each stage requires specialized semiconductors. Infineon makes most of them.
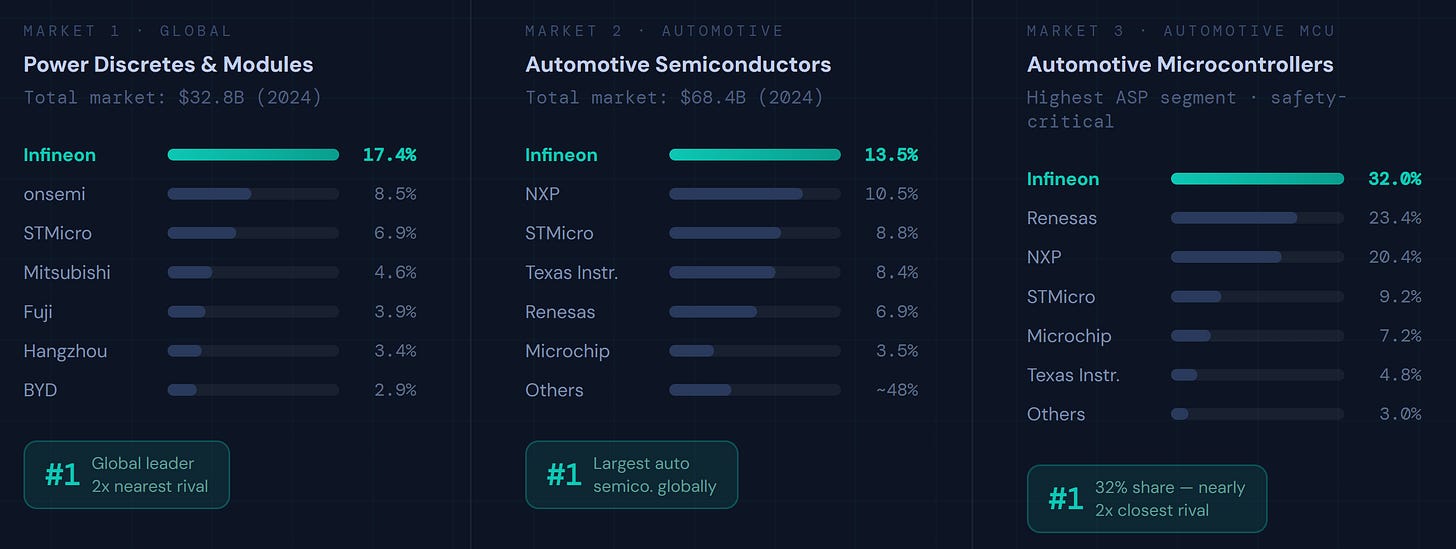
The company has 4 segments. Automotive is the largest, about 50% of revenue, covering electric vehicle powertrains, radar systems, and the microcontrollers that run modern cars. Green Industrial Power handles industrial automation, renewable energy inverters, and grid infrastructure. Connected Secure Systems covers IoT, payment chips, and smart identity. And Power and Sensor Systems, the PSS segment, is where AI lives.
PSS was a steady but unremarkable contributor until 2024. Today it is the fastest-growing part of the business, and it’s still accelerating.
Q1 FY2026 results, the January quarter:
Revenue came in at €3.66 billion, up 7% year over year, or closer to 14% adjusted for currency. The euro has strengthened significantly versus the dollar, which masks the real underlying growth rate in the reported numbers.
Adjusted gross margin expanded to 43%, the best reading since early FY2024, up more than 2 percentage points from the prior quarter. That’s factory utilization improving as AI demand fills capacity.
Earnings per share of €0.35 beat estimates. Not a blowout, but clean.
Order backlog rose to €21 billion, a 6th consecutive monthly increase. Backlog at 1.4 times trailing revenue is a healthy, demand-pull indicator.
Free cash flow was negative in the quarter. That’s deliberate. Management pulled forward €500 million of capital expenditure into FY2026 to accelerate the Dresden ramp. That’s a choice, not a problem.
FY2026 guidance confirms the narrative: The company is guiding for moderate revenue growth, an adjusted gross margin in the low-40s percent range, and capital expenditure of €2.7 billion. Adjusted free cash flow guidance is €1.4 billion. The AI revenue target of €1.5 billion is, notably, supply-constrained rather than demand-constrained. The CEO’s words: “still supply limited.” That is an unusual and meaningful distinction. Demand is not the bottleneck.
The AMS OSRAM sensor acquisition, a €570 million deal expected to close in Q2 2026, adds €230 million of annual revenue and opens a door into humanoid robotics applications.
Fundamental Analysis
The numbers are already turning. The question is how far they turn.
Let’s be direct about where the business stands. Infineon just went through one of the worst inventory corrections in the semiconductor industry in a decade. FY2024 was painful. Revenue fell, factories ran below capacity, and margins compressed sharply. The stock responded accordingly.
What the correction obscured is that the company never stopped investing. R&D spending actually rose as a percentage of revenue during the downturn, reaching 19% of sales in FY2025. That’s not what a company in structural decline looks like. That’s a company absorbing short-term pain to protect long-term positioning.
Where the numbers stand:
Trailing revenue: approximately €14.9 billion for FY2025.
Adjusted gross margin: 43% in Q1 FY2026, recovering from a trough of 38% during the worst of the cycle. The path to 45%+ is straightforward: Dresden utilization improves, AI product mix grows, and factory overhead gets absorbed by rising volumes.
Operating leverage is the key financial characteristic to understand. Because Infineon owns its own factories, a large share of its cost base is fixed. When revenue falls, profits fall much faster. When revenue recovers, profits recover even faster. In the downturn, a 17% revenue decline produced a 50%+ EBITDA decline. In the recovery, every €100 million of additional revenue has contributed roughly €150 to €170 million of additional EBITDA. That math becomes very interesting as AI revenue scales from €1.5 billion to €2.5 billion.
Net debt is elevated at approximately €5 billion, or about 1.2 times trailing EBITDA. Management is comfortable up to 2 times. The bond market validated that comfort in February, when a €2 billion bond placement was heavily oversubscribed. Leverage will peak this year and decline from FY2027 as free cash flow expands. It bears watching but it’s not a warning sign.
Valuation on trailing numbers looks stretched at approximately 14.5 times EV/EBITDA. On FY2027 numbers in a base case scenario, where AI revenue hits €2.5 billion and margins expand toward 45%, the stock trades closer to 9 to 11 times forward EBITDA. That’s where the re-rating argument lives.
The SiC angle deserves a mention. Silicon Carbide is the material of choice for high-voltage electric vehicle powertrains. Infineon holds roughly 18 to 20% of the global market. The more important story is the 200mm transition. Moving from 150mm to 200mm wafers produces more than twice as many chips per wafer and reduces per-unit cost by up to 40%. Infineon began shipping 200mm SiC products in early 2025. By 2027, cost leadership in SiC is achievable. That matters in a market where competitors are already trying to compete on price.
The business is at an inflection point. The trough is behind it. AI revenue is real, growing, and supply-constrained. The factory investment is on schedule. If Q2 FY2026 results in May confirm the AI ramp is tracking to guidance, the forward valuation case becomes very difficult to dismiss.
Technical Analysis
The price action has already made a decision. The question is whether you’re early or late.
The stock bottomed in April 2025 near €23. From there, it has essentially doubled. That kind of recovery doesn’t happen in broken companies. It happens when the market reappraises a business that went through a cyclical trough.
The structure of the recovery matters. The move from €23 to current levels has not been a straight line. It has been a series of impulsive advances followed by consolidations, with each trough higher than the last and each peak higher than the last. That’s the definition of an uptrend.
How the current setup reads across timeframes:
On a longer-term weekly view, every major moving average is pointing upward and price is well above all of them. The weekly momentum indicator recently crossed its most bullish reading since the 2021 bull market peak. Volume has been systematically rising on up weeks and contracting on down weeks. Institutional money is accumulating, not distributing.
On the daily timeframe, the picture is equally constructive. The Ichimoku cloud, a Japanese multi-component trend indicator that measures momentum, trend direction, and support simultaneously, is in its most bullish configuration. Price is well above the cloud, and the cloud is thick, rising, and shifting from bearish to bullish in the forward projection. That matters because it means the structural support level is rising over time, not eroding.
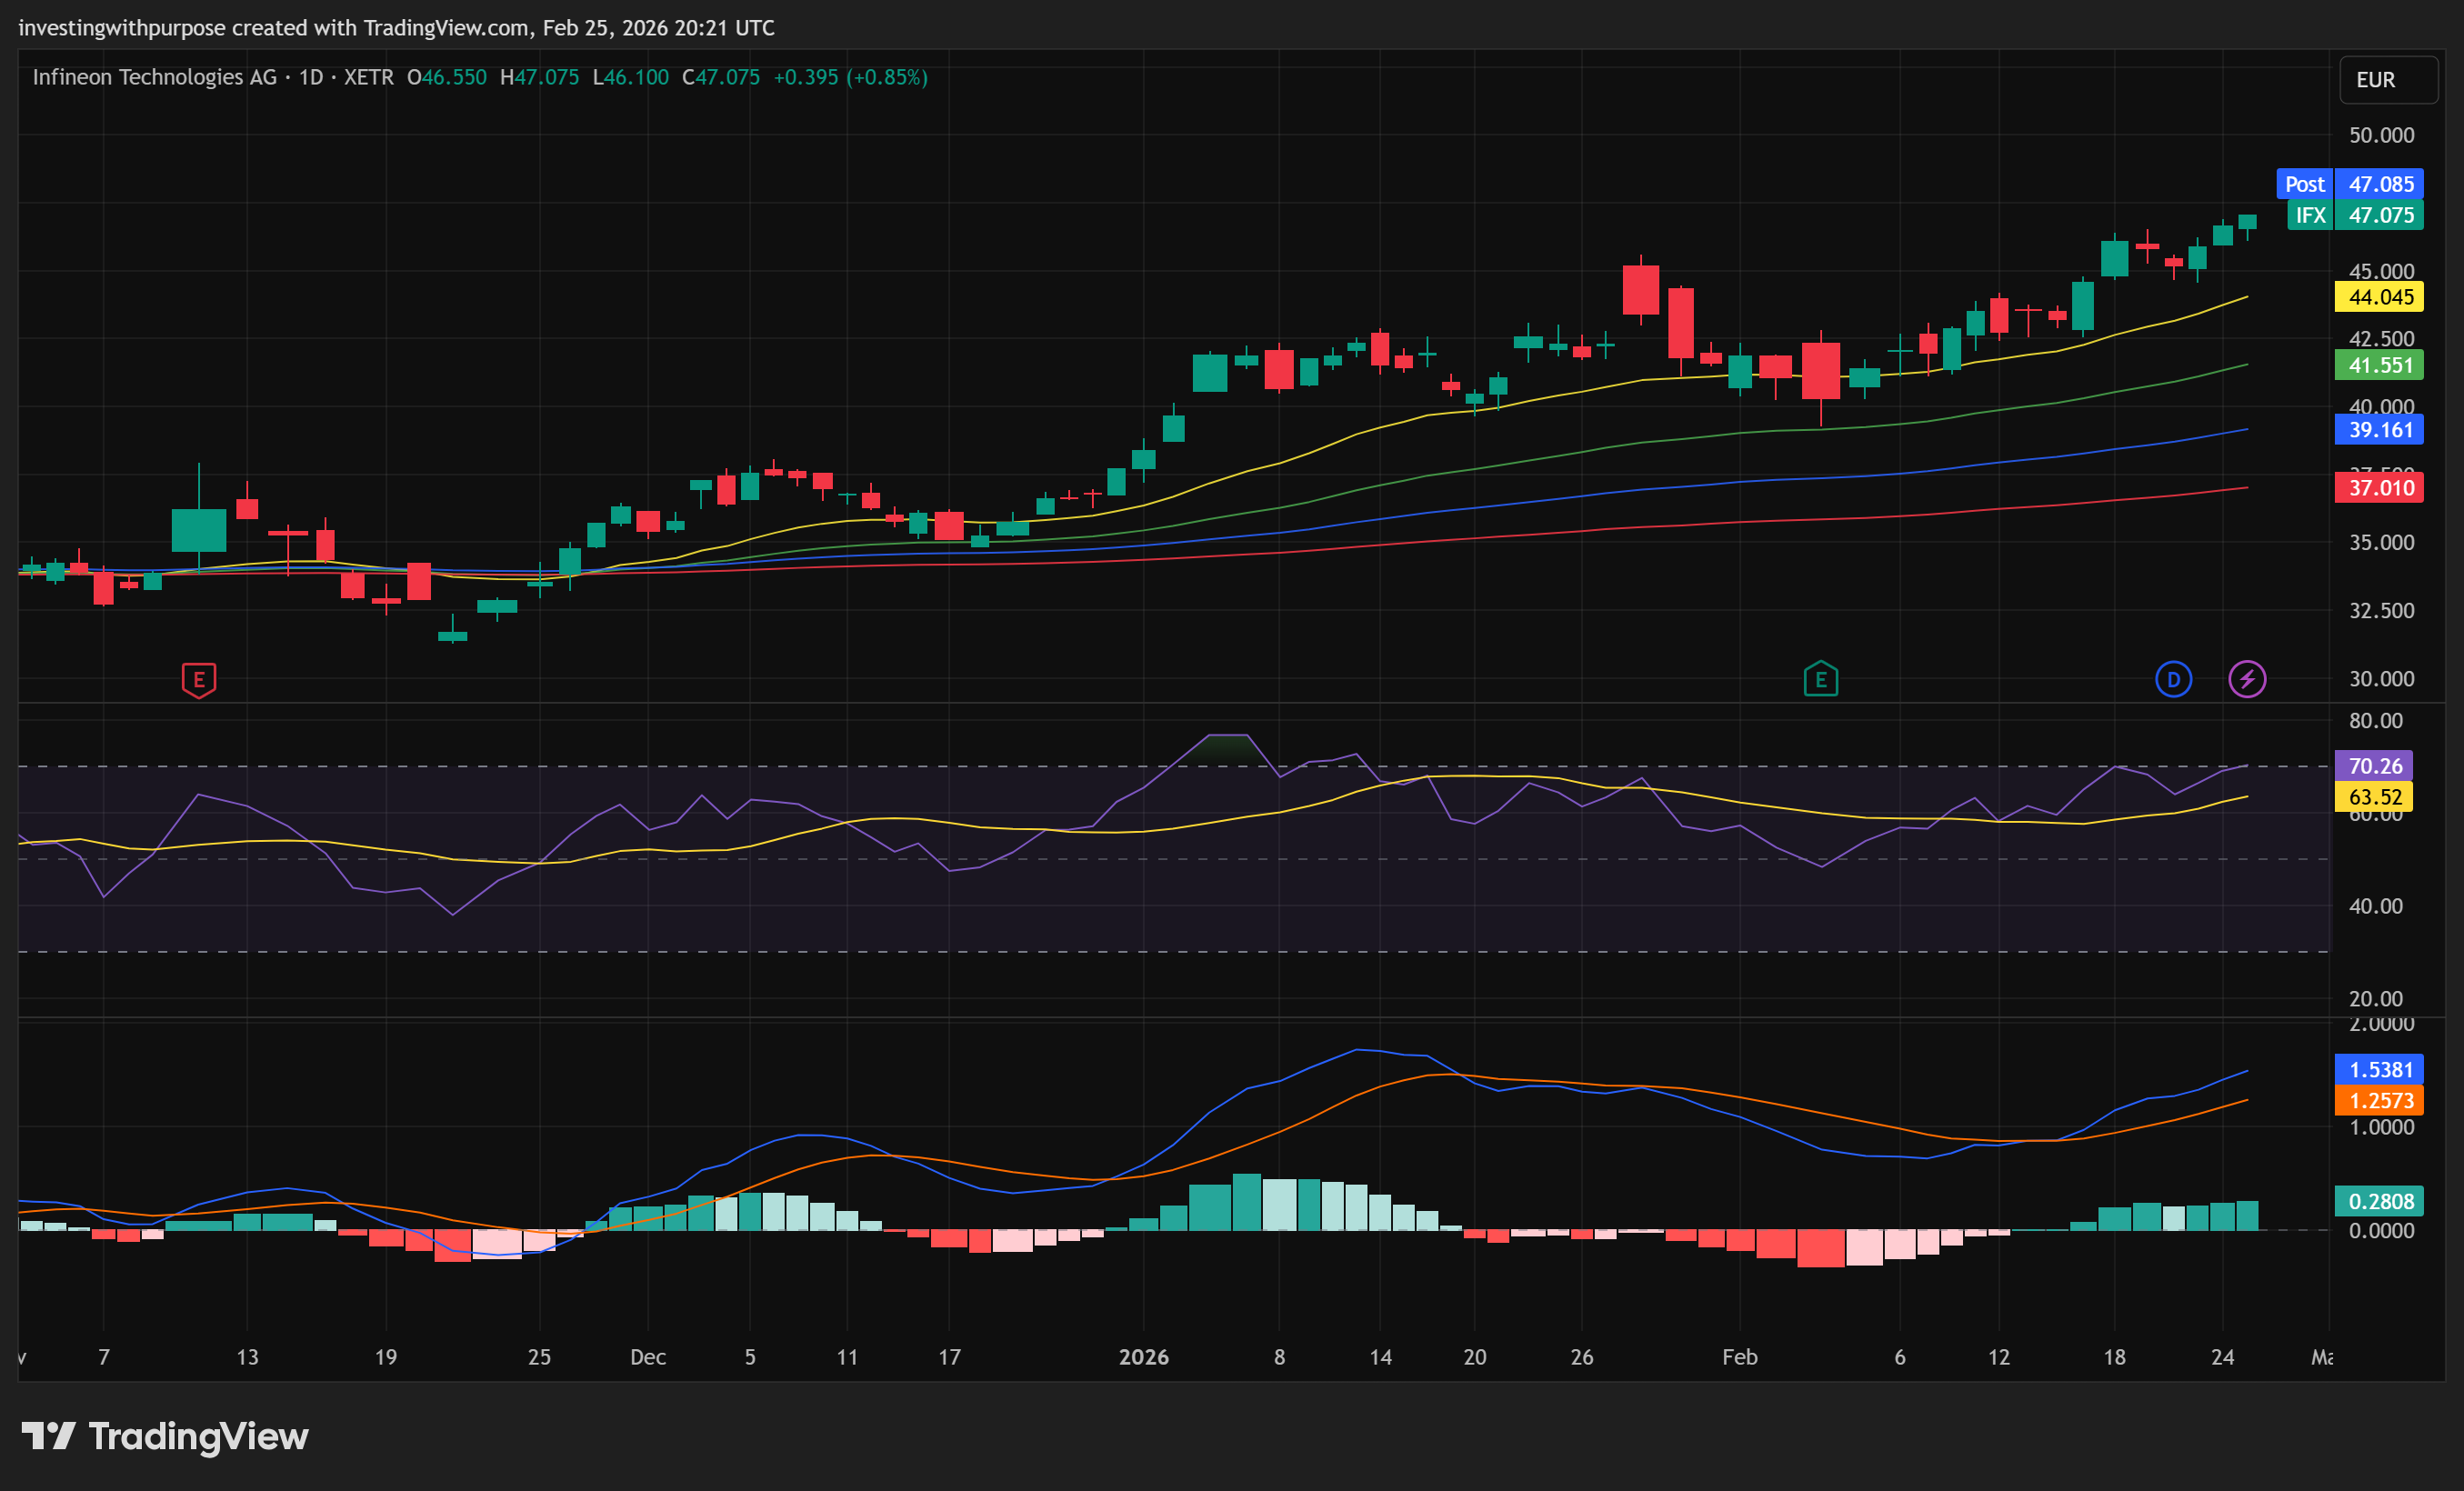
The February 4 low of €39.25 is important. It was the post-earnings shakeout, the moment when the market decided to sell the news. The stock fell to that level and immediately reversed. The character of that reversal, large volume, strong close, immediate follow-through, is what defined it as a genuine support level rather than a temporary pause.
From €39.25, the stock has gained 20% in 3 weeks. That pace creates a specific problem for new investors: the short-term momentum readings are now extreme. The weekly momentum oscillator is at its upper boundary. That doesn’t mean the stock falls tomorrow. In strong trends, momentum can stay elevated for weeks. But it does mean the risk-adjusted entry for new money is better at lower levels than at current ones.
Key structural levels:
€47.72 is the immediate resistance. It marks the 78.6% Fibonacci extension of the February swing move. Extensions measure how far a move has gone beyond its starting point relative to its structure. Breaking above €47.72 cleanly, with volume and a daily close, would confirm continuation.
€49.62 to €50 is the next meaningful resistance zone. It sits at the 127.2% extension of the same move, and €50 is a psychological round number that will attract sellers. Expect it to act as a pause, not necessarily a reversal.
€44.82 to €45.64 is the first meaningful support on a pullback. This is where the 4-hour trend structure rebalances, where the short-term momentum oscillator would likely reset from overbought back to neutral territory.
€43.17 to €43.76 is the higher-conviction entry zone. This level clusters the daily baseline indicator, the 38.2% Fibonacci retracement of the February swing, and the rising 50-day moving average. If the stock pulls back this far, multiple independent support signals converge. That’s where the risk-reward is most favorable for medium-term investors.
€39.25 is the structural floor. A daily close below it changes the character of the entire move. Not a pullback. A structural break. More on that in the trade plan.
One additional scenario worth holding lightly: if the move from the September 2025 low is counted as a 5-wave impulse structure, the current wave represents the final advance before a corrective phase. On that reading, the stock could reach €53 before a more meaningful pullback ensues. Treat that as a possibility, not a prediction. What it does is frame the upside potential on a continuation trade without overstating the certainty.
The trend is intact and well-supported by multiple indicators. Momentum is extended short-term. The best entries are below the current price. Existing holders have a clear trailing stop framework. New investors should be patient and disciplined.
Our Trade Plan
Discipline is what separates a good setup from a good trade.
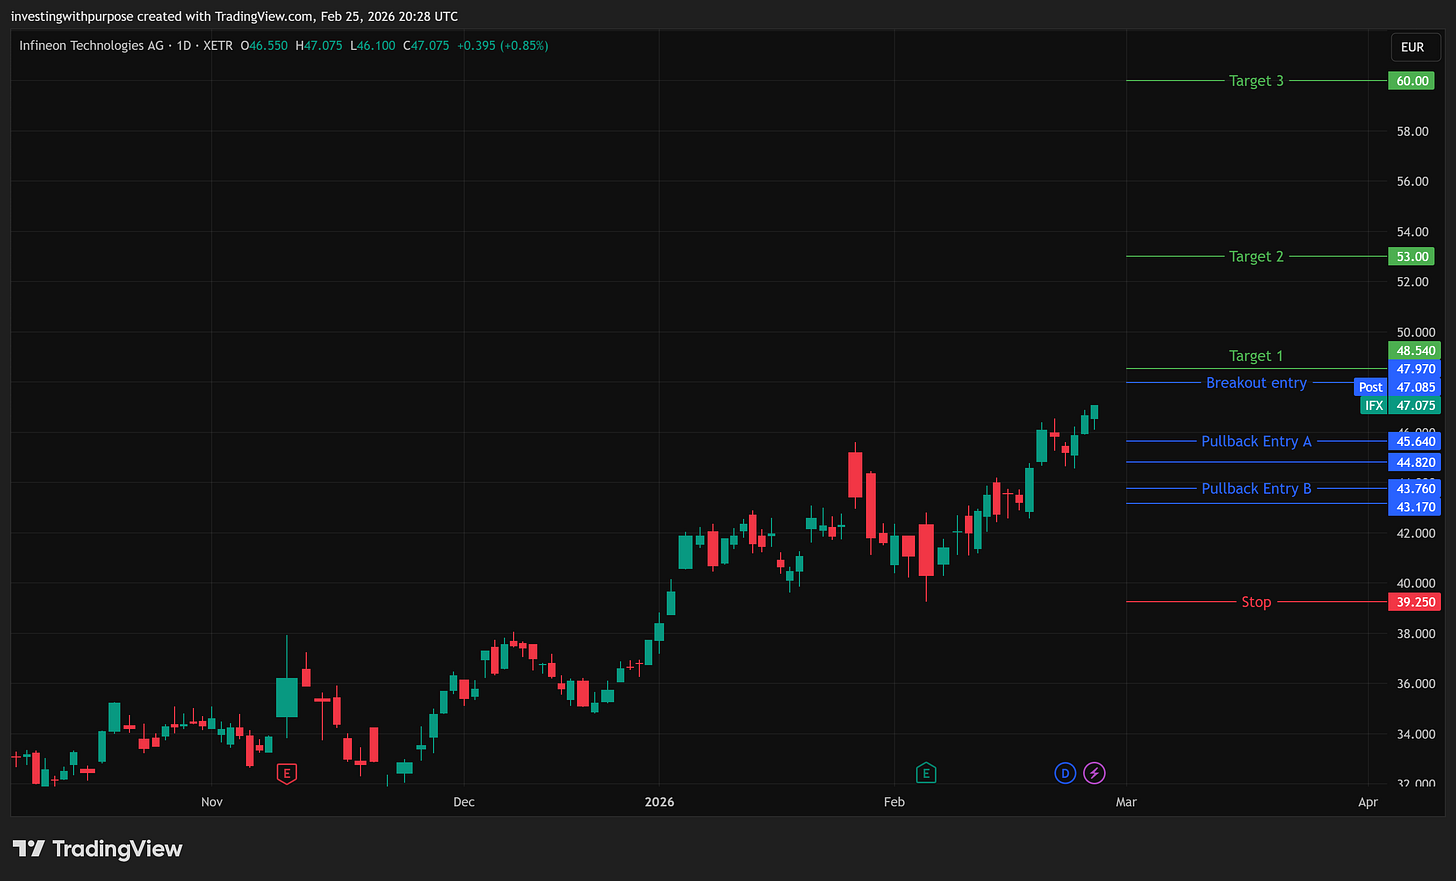
Pullback entries:
First zone: €44.82 to €45.64. This is where the short-term structure finds its first meaningful support after a retracement. It’s a partial entry, not a full position. The momentum reset may not be complete at this level, and a second leg lower is possible.
Preferred zone: €43.17 to €43.76. Multiple support signals converge here. The daily baseline indicator, the 38.2% retracement level, and the rising 50-day moving average all intersect in this range. This is where the risk-reward becomes genuinely attractive for medium-term investors. Size a full position here.
Breakout entry: A confirmed daily close above €47.72 with volume above the 30-day average constitutes a breakout. The entry is around €47.85, not at the exact resistance level. The stop for a breakout trade is at €45.33, approximately 1.5 times the average daily trading range below the breakout point. The reward target is €49.62 to €50 for the first leg and €53 for the extended move. The risk-reward on the initial target is modest. This trade only makes sense if you’re sizing for the larger move to €53.
Invalidation: €39.25. A daily close below the February 4 low means the recovery structure has failed. This is not a stop to debate or move. It means the thesis needs to be rebuilt from scratch. Exit, preserve capital, and reassess.
Targets:
Short-term: €48.54 to €50. The measured move of the February rally and the psychological €50 barrier. Sell a portion here, especially in a breakout trade.
Medium-term: €53. The wave structure extension and the Fibonacci 1.618 projection both point here. This is the base-case destination if momentum remains intact and Q2 earnings confirm the AI ramp.
Long-term: €60 to €61. The fundamental base case. This requires Dresden delivering its ramp, AI revenue reaching €2.5 billion in FY2027, and margins expanding back toward 45%. 12 to 18 months.
Position sizing:
Size your position so that a stop-out at the normal stop level costs 1-2% of your portfolio. If you’re entering at €43.17 with a stop at €41.13, you’re risking €2.04 per share. Adjust to 0.5-0.75% risk if concentration is a concern or if you’re taking a second entry position at the shallower zone.
Reduce position size by half ahead of Q2 FY2026 results in May. Earnings events carry binary risk. Rebuild after the print if guidance holds.

Rolling stop: Once the stock reaches €48.54, move the stop to the entry point. Once it reaches €50, move the stop to €46. Once it reaches €53, move the stop to €49. Trail by moving below the most recent 5-day swing low after each significant target is reached. Never widen a stop once set.
Bottom Line
Infineon is not a story about cheap valuation. On trailing numbers it’s fairly priced. The story is about where earnings are going, and the answer is: significantly higher, driven by a real, supply-constrained AI power business that is only beginning to scale.
The stock has had a sharp move. The right response to that is patience, not urgency. The preferred entry is a pullback to €43 to €44, where the risk-reward is clean and multiple support signals converge. If that pullback doesn’t come and the stock breaks €47.72 cleanly, a smaller breakout position with a defined stop makes sense.
The single most important level to hold in mind is €39.25. If the stock closes below it on a daily basis, the bull case is structurally broken and capital should be preserved for a better entry later.
Everything else, the AI pipeline, the Dresden ramp, the SiC cost advantage, the management continuity, points in the same direction. This is a high-quality European industrial company in the middle of a structural transformation, trading at a discount to what it will be worth in 2 years if that transformation delivers.
Q2 results in May are the next major test. Between now and then, patience is the edge.
The information provided in this publication is for informational and educational purposes only and should not be construed as financial advice. Nothing contained herein constitutes a solicitation, recommendation, endorsement, or offer to buy or sell any securities or other financial instruments.