Revenue grew 25%, adjusted EPS doubled the consensus, foundry losses narrowed, and third-party reports put 18A yields near 85%. The headline $11B loss is an accounting echo of the stock’s own rally, not an operating number. Our June 17 piece said the price had run past the proof; the market spent 5 weeks repricing, and then the proof showed up.
The proof arrived. The premium had already left.
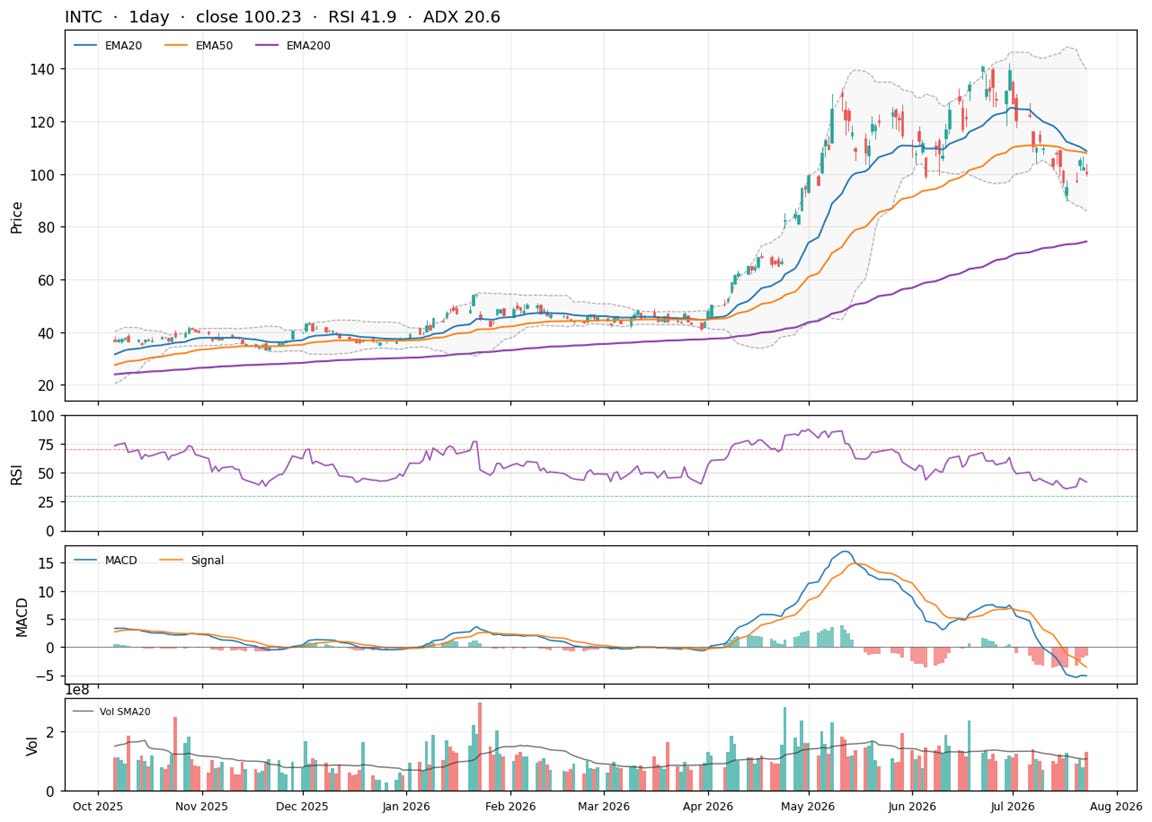
Our June 17 piece is on the record, and its title was the thesis: “The Comeback Is Real. The Price Has Run Past the Proof.” Written at $117.05, it argued Intel was priced as if the turnaround were finished while the company was still losing money. The market then did both halves of the work: the stock ran to a $142.35 record on June 30, fell to $95.04 by July 17 as a sector selloff met reports questioning 18A economics, and entered Wednesday’s report at $100.23. Then came the print: Intel’s fastest revenue growth in more than 15 years, a 12% spike within minutes in late trading, and a fade to under 4% by evening. A stock that had already repriced didn’t pay twice for confirmation. Prices below are based on the July 23, 2026 close; results are from Intel’s release and call.
Key Takeaways
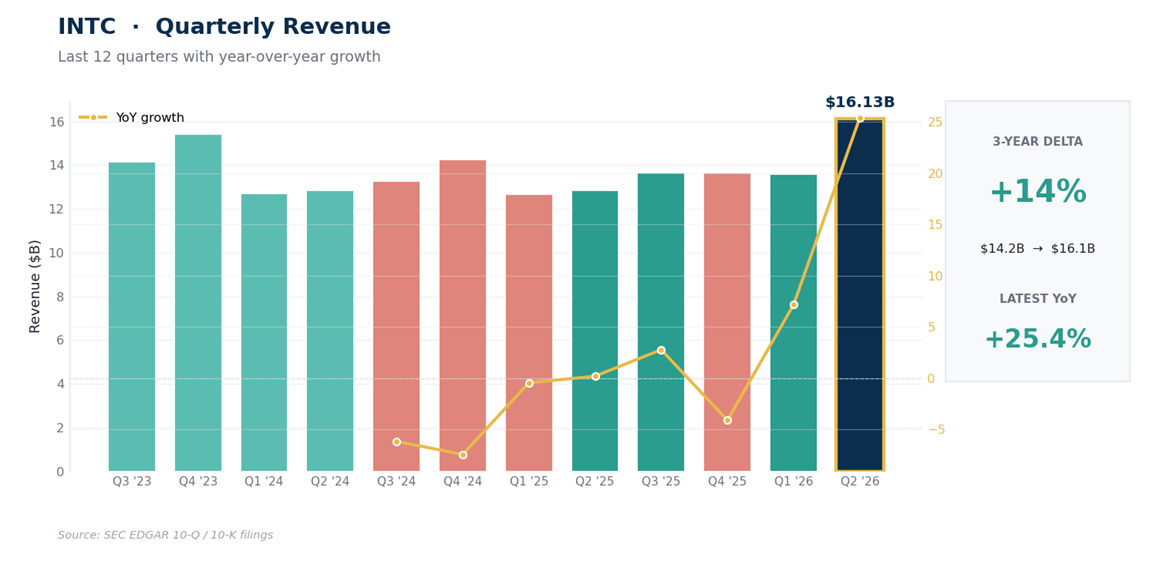
Revenue growth was the fastest since 2011: $16.1B, up 25% against the $14.42B consensus, with adjusted EPS of $0.42 doubling the $0.21 estimate and non-GAAP gross margin at 41.8%.
Data Center and AI led: revenue up 59% to $6.3B with a $2.5B segment operating profit at a 40% margin, and management says it is supply constrained, with capex guidance raised above $20B.
The Q3 guide beat too: revenue of $15.8 to $16.8B and adjusted EPS of $0.38, against expectations near $15.1B and $0.27, with GAAP EPS guided positive at $0.31.
The $11B GAAP loss is not operational: a $12.5B non-cash revaluation of the shares held in escrow for the US government, a charge that grows when Intel’s stock rises, swamped $1.8B of GAAP operating income; adjusted net income was $2.2B.
Foundry progress came in kind, not yet in scale: revenue rose 31% to $5.8B (mostly Intel building for Intel), the operating loss narrowed to $2.1B from about $3.2B a year ago, and external revenue reached $293M, up 68% sequentially.
The new map: pullback zone 94 to 97, invalidation at a daily close below 89, repair above 109, references at 116, 133, and the 142 record.
The Print the Rally Was Waiting For
Score the quarter on its own first. Revenue of $16.1B rose 25%, Intel’s fastest growth since 2011, and beat the consensus by more than $1.6B. Adjusted EPS of $0.42 doubled the estimate. Non-GAAP gross margin printed 41.8% against a 39% guide, the clearest sign yet that better products and fuller fabs are flowing through to economics.
Data Center and AI did the heavy lifting, up 59% to $6.3B with a 40% segment operating margin, and the client business grew 13% to $8.9B. The CFO’s framing was the striking part: Intel is supply constrained, data-center customers want more than it can make, and the company cited 10 long-term supply agreements while raising this year’s capex above $20B, with 2027 expected higher. The Q3 guide put numbers on the momentum: $15.8 to $16.8B of revenue and $0.38 of adjusted EPS, both far above consensus, with even GAAP EPS guided positive at $0.31.
The $11B Asterisk
The same release shows a GAAP net loss of $11.0B, and readers of this letter know we always chase the asterisk. This one is unusual. Intel produced $1.8B of GAAP operating income, but a $12.5B non-cash charge, the quarterly mark-to-market on the shares held in escrow for the US government’s stake (acquired near $20.47 in 2025), pushed the bottom line to an $11B loss. Accounting rules revalue that obligation at each quarter’s share price, so the better the stock does, the bigger this paper loss gets; it’s effectively a charge for Intel’s own rally, and it reverses in quarters when the stock falls.
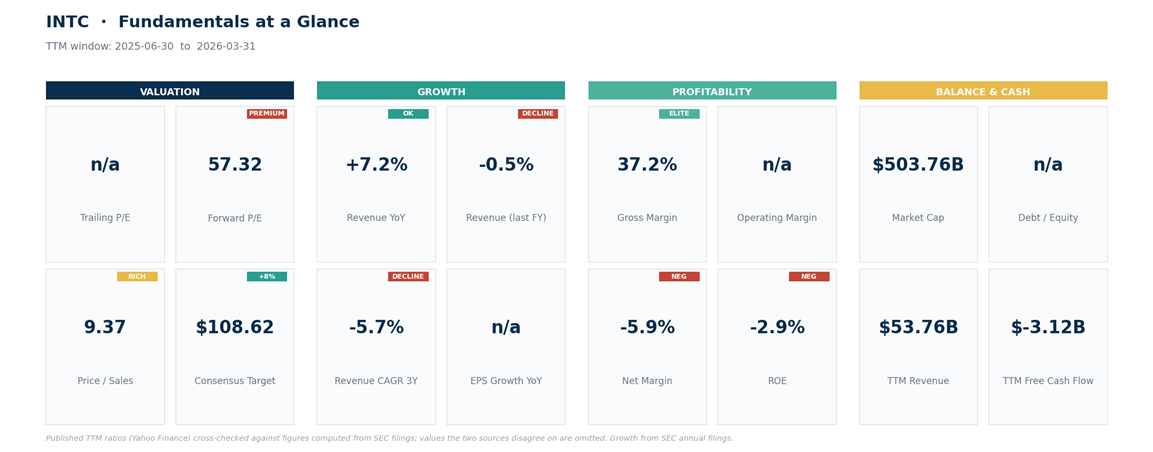
After Intel’s full set of non-GAAP adjustments, which also strip stock compensation, restructuring, and investment marks, adjusted net income was $2.2B. The screen-level consequence: trailing GAAP earnings are negative, so there’s no trailing P/E at all, and the working anchor is the forward multiple near 57x. That’s the honest, expensive number this stock must still grow into.
The Foundry Scoreboard
Our June piece said the real validation was specific: “external customers buying 18A at volume, with competitive yields and margins.” Grade that against this print honestly.
Yields: management says 18A is tracking ahead of expectations, and third-party reports place yields near 85%, a genuine answer to the July doubts.
Customers: Fortinet became the first named external customer, on an older node, while 18A cloud-provider engagement remained pipeline talk rather than a new named commitment (the AWS collaboration dates to 2024).
Losses: foundry revenue rose 31% year over year to $5.8B, though most of that is Intel building for Intel; the segment’s operating loss narrowed to $2.1B from about $3.2B a year ago, an improvement of roughly $348M from the prior quarter.
And scale is where the honesty bites: external foundry revenue was $293M, up 68% sequentially and still under 2% of total revenue. The proof arrived in kind. It has not yet arrived in size, and size is what a $500B market value is paying for.
What the Price Buys Now
The repricing changed the math more than the print did. In June, Intel traded around 10 times sales and 20% above the Street’s average target near $90. Today the market value is $503.8B, about 8.8 times freshly updated trailing sales, and the average target has risen to $108.63, about 8% above the price, with the median at $102.50, essentially at it. Price fell 14% while targets rose 20%: the gap we flagged closed from both directions.
The cash flow line keeps the caution honest. Intel generated $7B of operating cash flow, but adjusted free cash flow was negative $8.4B amid partner distributions and the manufacturing buildout. The earnings recovery is real; the cash economics aren’t clean yet, and at 57x forward earnings with capex above $20B a year, the price still assumes foundry losses keep narrowing and the supply-constrained demand keeps its pace. What changed is the cushion: a quarter like this one, delivered at $100 instead of $140, is being asked to defend far less.
The Framework Audit
Our June 17 map gets scored like every other one we publish. The 105 to 114 pullback zone filled, then broke in mid-July, costing zone buyers roughly 7% to 10%. The caution line, a daily close below $98, fired on July 16 at $96.98; it didn’t call the top, but it took disciplined followers out near $97, about 8% above the $89.59 panic low that followed. The upside targets never triggered: the market topped at $142.35, within $3 of our first $145 target, and reversed. The framework contained the damage; it didn’t dodge it. That’s what frameworks are for.
The Map
One possible framework, not a promise.
Intel, daily timeframe, all triggers meaning daily closes. The stock sits below its 20-day and 50-day averages (both near 108 to 109) with momentum still soft after the slide (RSI near 42), and its average daily range is above 8% of the price, so give every level gap room.