


Sometimes the market hands you a story stock at infrastructure prices. Sometimes it’s right to.
IREN 0.00%↑ closed Friday at $36.80.
That’s 52% below the $76.87 high from last November and 48% below the $70.71 it printed in early June. It’s also 27% above the $28.93 low it touched on July 29.
None of those moves were really about the business.
Today it’s above $39.00
Here’s why the name is worth your time:
IREN 0.00%↑ owns 5 GW of secured grid power, it’s converting that power into AI compute under multiyear contracts with MSFT 0.00%↑, NVDA 0.00%↑, Perplexity, and Figure AI.
In June 2026, it showed it could finance the buildout at an A credit rating (instead of just selling more stock).
Key Takeaways
July’s low was a liquidity event, not an earnings event. A leveraged fund holding 11.7 million shares got margin-called and sold its entire book to Citadel. The stock rallied 30% the day that seller vanished.
The real de-rating came 4 weeks earlier, on July 1, when Meta said it would lease out spare compute. That turned a hyperscaler from customer into competitor, and it hasn’t been un-said.
Bitcoin mining is still 76.8% of revenue and shrinking fast. It fell to $111.2 M last quarter from $167.4 M, while AI Cloud nearly doubled to $33.6 M. The handoff is real but early.
The funding bear case got a serious answer in June. A $3.65 B facility rated A by Fitch covers 96% of the Microsoft GPU spend at a 6% blended cost, with customer prepayments worth roughly 45% of GPU capital spend on newer deals.
Diluted shares are up 53% from a year earlier and capital spending ran at 3.7x revenue over 12 months. This isn’t a self-funding business yet, and you’re paid to wait only if delivery lands on schedule.
Before the numbers, the story of the last 5 weeks:
What Actually Happened in July
The sequence matters here, because almost none of this movement came from IREN.
July 1
Meta confirmed it would sell access to spare data centre capacity. The reaction was immediate and brutal for anyone renting out GPUs: a company everyone modelled as a future customer had just become a possible competitor. CoreWeave fell about 14% and Nebius about 17% in the same session. IREN went from $43.32 to $38.82 the following day. The AI infrastructure complex has not recovered that ground.
Mid-July
The de-rating widened into the whole group. IREN slid from $59.96 on June 18 to $33.62 by July 17, a 44% drawdown in a month, with peers down similar amounts. Nothing company-specific happened. The market was simply repricing what a megawatt of contracted GPU capacity is worth when the buyer list might be shorter than assumed.
July 20
IREN announced $2.8 billion of new customer contracts and raised its year-end target. The stock jumped 19.6% on 93.3 million shares, its heaviest session of the move.
July 29 and 30
This is the part that matters. Leopold Aschenbrenner’s Situational Awareness fund, which had run leverage reported as high as 400%, took margin calls from Goldman Sachs, JPMorgan and Bank of America. The fund fell 67% in July and shrank from roughly $45 billion to roughly $10 billion. It sold its whole public equity book to Citadel. IREN was its 4th-largest position at 11.7 million shares.
On July 29 IREN fell 13.6% to $29.31, touching $28.93. On July 30, once the fund’s book had changed hands and the forced seller was gone, it closed at $38.26, up 30.5%.
The Business and Last Earnings
IREN spent 7 years buying grid-connected land and power in renewable-rich regions, then filling it with computers. For most of that history those computers mined Bitcoin. Now they’re being swapped for GPUs, and the company sells compute by the hour instead of hashes.
Power is the point. Anyone can order GPUs. Almost nobody can energize 480MW this year and another 730 MW next year, because substations, interconnection queues and grid connections take years to permit and build. That head start is the asset, and it’s why NVIDIA signed a partnership covering up to 5GW of infrastructure rather than just selling IREN some silicon.
The quarter ended March 31 shows exactly where the transition sits. Revenue was $144.8 M, flat against the same period a year earlier, with a net loss of $247.8 M and reported diluted earnings per share of -$0.74. Adjusted earnings before interest, taxes, depreciation and amortization came in at $59.5 M, a 41% margin, down for a 3rd straight quarter from $121.9 M.
Underneath that flat revenue line, 2 businesses are moving in opposite directions:
Bitcoin mining revenue of $111.2 M, down 33.6% from the prior quarter on a lower average Bitcoin price and hardware retired ahead of GPU installation
AI Cloud revenue of $33.6 M, up 94.2% from the prior quarter
Impairments of $140.4 M, mostly decommissioned mining hardware, with management saying plainly to expect more of them
Depreciation of $121.2 M, up from $99.2 M, as the GPU fleet starts hitting the income statement
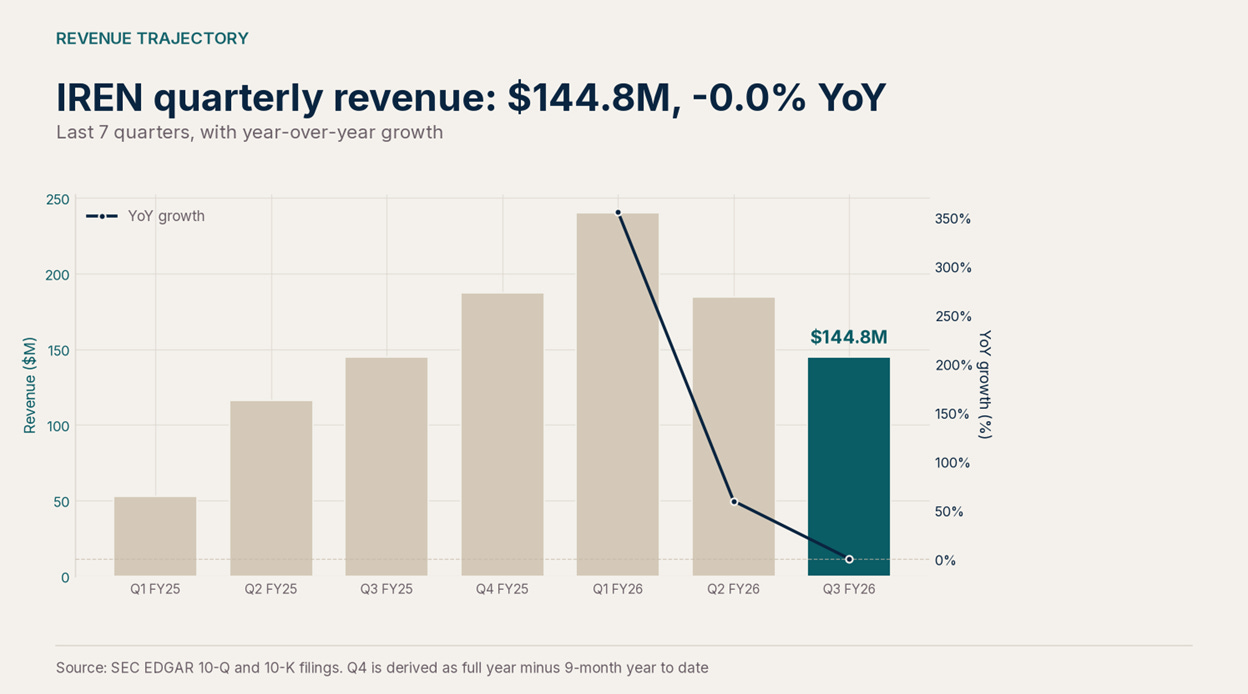
The top line looks flat because a shrinking business is masking a doubling one. That single fact explains why the reported numbers look so much worse than the contracted ones, and why the stock trades on announcements rather than results.
On contracted revenue, the company lifted its year-end 2026 annualized run-rate target from $3.7 B to more than $4 B on July 20, and said roughly 85% is now under contract. The customer list runs from Microsoft and NVIDIA through Perplexity, Figure AI, Together AI, Fluidstack, Fireworks AI, Fal AI and Hume AI. Agreements average about 4 years. Deals signed since June carry prepayments equal to roughly 45% of the associated GPU capital spend. Cash stood at approximately $7.6 B at June 30, including $1.7 B restricted against the Microsoft financing.
Concentration deserves a mention too. Of the $3.1 B that was under contract as of May, roughly $1.9 B was Microsoft and $0.7 B was NVIDIA. The July additions diversified that meaningfully, which is the reason the announcement mattered more than the dollar figure suggested.
But 1 customer still anchors the plan.
Fundamental Analysis
Over the TTM, IREN generated $757.1 M of revenue and spent $2.83 B on capital projects. That’s capital spending at 3.7x revenue. FCF was negative $2.13 B, a free cash flow yield of -16.3%.
That ratio tells you what you’re actually buying. This is a construction project with a revenue stream attached, and it stays that way through 2027 at least.
The valuation multiples need care, because 1 of them is broken:
Price to sales of 17.3x, price to book of 4.93x
Enterprise value to EBITDA of 31.2x
Gross margin 53.6%, operating margin -29.2%, return on equity 3.1%, return on assets 1.4%
Debt to equity of 1.49, current ratio of 3.72
A trailing price to earnings that screens anywhere from 48x to 171x depending on whose earnings you use, and which you should ignore either way, because trailing net income of $76.9 million comes almost entirely from a single quarter of non-cash fair-value gains rather than operations
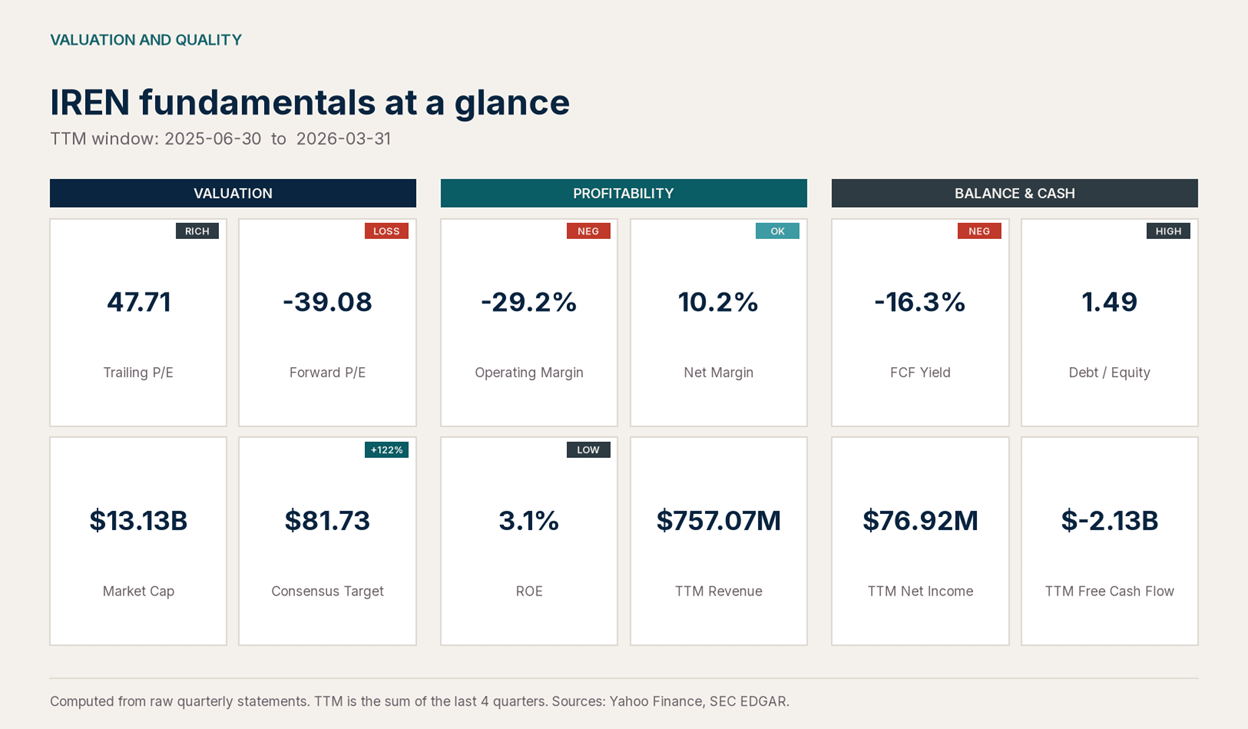
IREN shows positive trailing net income and a net margin above 10%. The September 2025 quarter booked a $665 M non-cash gain on financial instruments, which flipped a losing year into a nominally profitable one. Operating margin of -29.2% is the key number.
Set the trailing multiples aside and the forward math gets more interesting. Enterprise value is roughly $14.9 B. Against the company’s own $4 B run-rate target that’s 3.7x, and against consensus revenue of $3 B for the fiscal year ending June 2027, about 5.0x. Neither is expensive for infrastructure growing this fast. Both assume delivery lands.
Against peers, the balance sheet is what stands out:
IREN 0.00%↑: debt to equity 1.49, gross margin 53.6%, flat reported growth, up 123% over 52 weeks
CoreWeave CRWV 0.00%↑: debt to equity 7.39, gross margin 69.4%, revenue up 112%, down 32% over 52 weeks
Nebius NBIS 0.00%↑: debt to equity 1.32, gross margin 72.1%, revenue up 684%
Cipher CIFR 0.00%↑: debt to equity 6.42, gross margin 12.4%, revenue down 29%
Applied Digital APLD 0.00%↑: debt to equity 1.36, gross margin 25.9%, revenue up 407%
Every name in that group burns cash, and heavily. IREN is the only one whose reported growth is flat, purely because mining is falling faster than AI Cloud fills in. But it carries the second-lowest leverage in the peer set, and that’s a direct result of how the buildout is being paid for.
IREN closed $3.65 B of investment-grade GPU financing covering 96% of $5.81 B of GPU capital spend for the $9.7 B Microsoft contract. Blended cost of debt was 6%. Fitch rated it A and DBRS rated it A(low), the highest public rating achieved on GPU collateral and the first such deal done in the US private placement market.
That means that debt markets will now underwrite GPUs as investment-grade collateral, at rates that look nothing like venture funding. A year ago that was an open question and much of the bear case rested on the answer. The chief financial officer put it directly on the last call: roughly 95% of Microsoft GPU capital spend is expected to be funded through prepayments and GPU financing at an average interest rate of about 3%.
Diluted share count went from 218.7 million to 333.7 million in 12 months, up 53%. Convertible notes stand at $3.69 billion. NVIDIA’s right to buy 30 million shares at $70.00 would add another 8.4% if exercised, though with the stock 47% below that strike it’s a problem for a much better day.
Consensus is unusually one-sided. Across 15 analysts the mean target is $81.73 implying 122% upside. Even the lowest published target, $41.00, sits above the current price, which is rare and slightly uncomfortable.
Fundamental conclusion: the assets are real, the contracts are real, and the financing is materially better than the market gave credit for. What you’re underwriting is a 9-month, 30-fold scale-up in the AI business while the legacy business shrinks underneath it. Everything in the bull case is a contract or a target. Everything in the bear case is a reported number. That asymmetry is the whole investment.
Technical Analysis
Weekly Chart
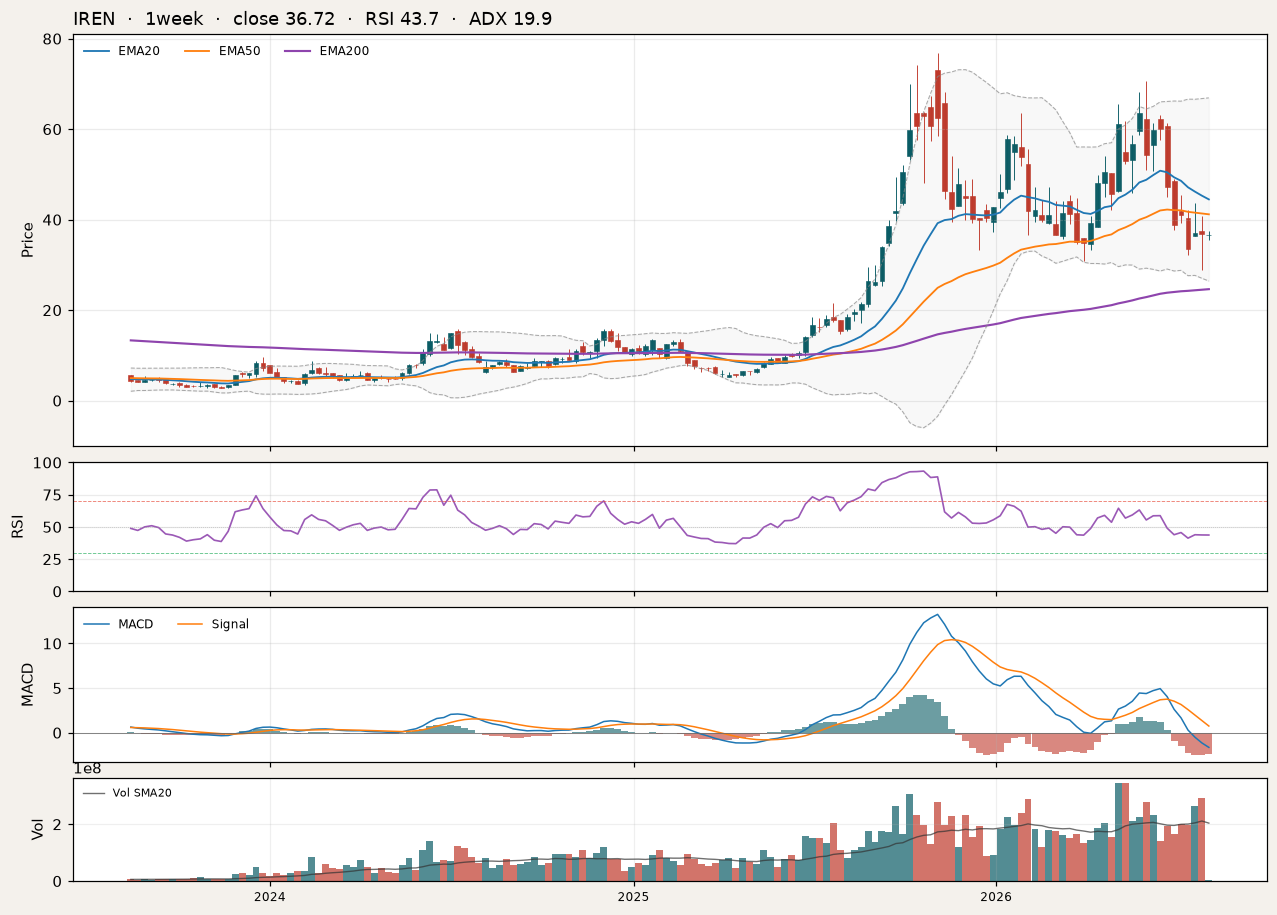
The weekly trend has rolled over. Price sits below its 20-week and 50-week averages at $44.48 and $41.18, and below the weekly Ichimoku cloud, a band running from roughly $41.00 to $47.76 that marks where the market last agreed on value. Downside pressure remains in control.
The structure since November is a sequence of lower highs, $76.87 then $70.71, and July’s $28.93 undercut March’s $30.76. Lower highs plus a lower low is a downtrend.
The 61.8% retracement, the level that usually decides whether a correction is a pause or a reversal, sits at $31.93. Price broke it on July 29 and reclaimed it the very next session. A break that fails immediately, on the heaviest volume of the entire move, is a liquidation low rather than trend continuation. That distinction is the technical heart of this setup.
Daily Chart
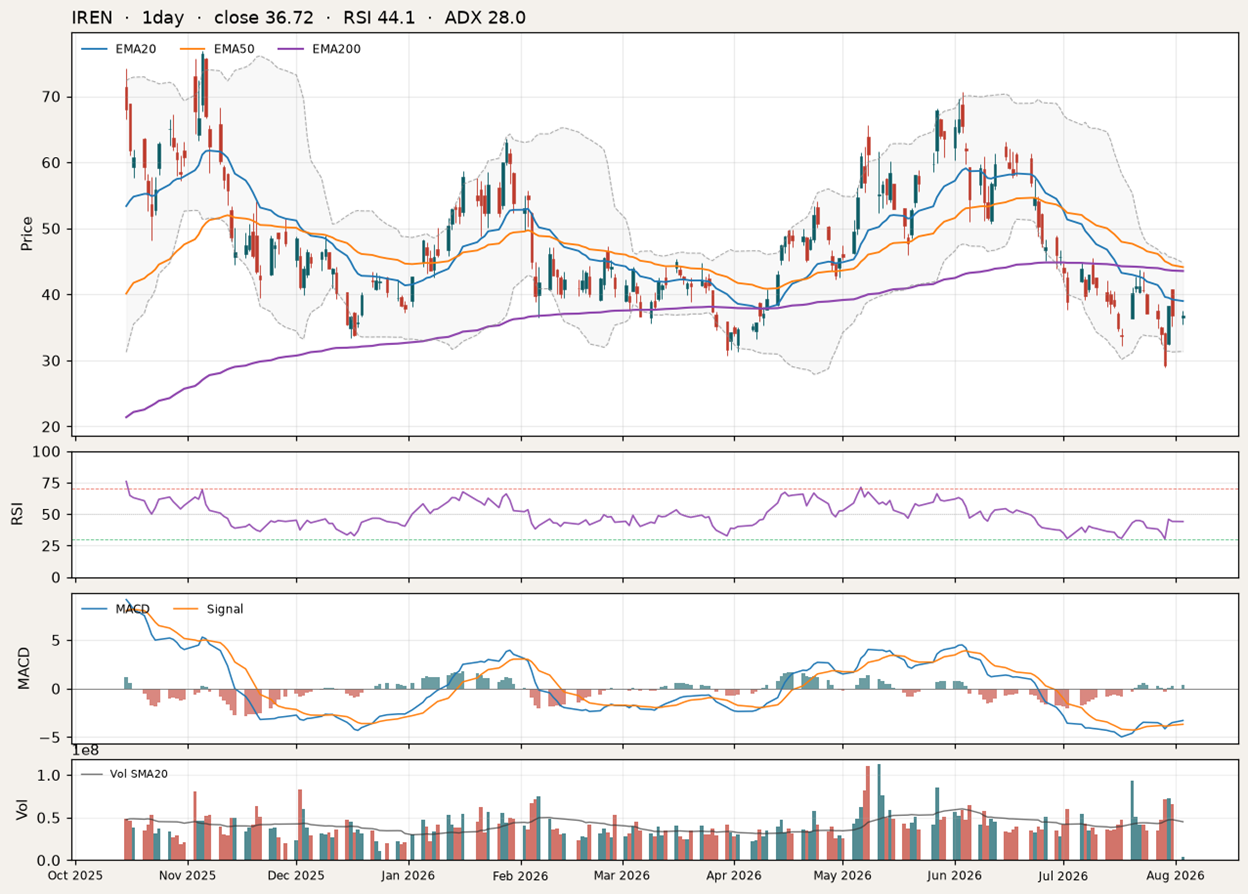
On the daily timeframe the damage is visible and the repair is early. At $36.80, price was below all 4 daily moving averages, with the 1D EMA20 at $38.99 and the 1D EMA50 at $44.13.
With today’s session, price hovering around $39, IREN finally reclaimed the 20-day EMA.
The 200-day average has just flattened and started to roll over for the first time in this cycle, which is the clearest evidence that the multi-year uptrend has genuinely paused rather than merely dipped.
Momentum tells a better story than price does. RSI at 44.1 has climbed from 30.3 on July 29 without yet reaching the midpoint, so there’s room in either direction. ADX 28.0 says a real downtrend is in place, though it’s cooling after peaking at 33.8 on July 17. The MACD line at -3.29 sits below its signal at -3.68, so momentum is still negative, but the gap between them has narrowed steadily since July 21, which means selling pressure is fading even while price goes sideways.
There’s also a mild positive divergence. Price made a lower low into July 29, at $28.93 against $32.22 on July 17, while RSI held roughly flat at 30.3 versus 30.7. Momentum refused to confirm the new low.
The short-term picture is more stretched. StochRSI at 92.4 marks the bounce as overbought on a very short leash, and on the 4-hour timeframe price is pinned right at its 20-period average around $36.89 with a reading of 17.8 on the trend-strength gauge, which is the technical definition of no trend at all. That’s consolidation, and it usually resolves with a fast move.
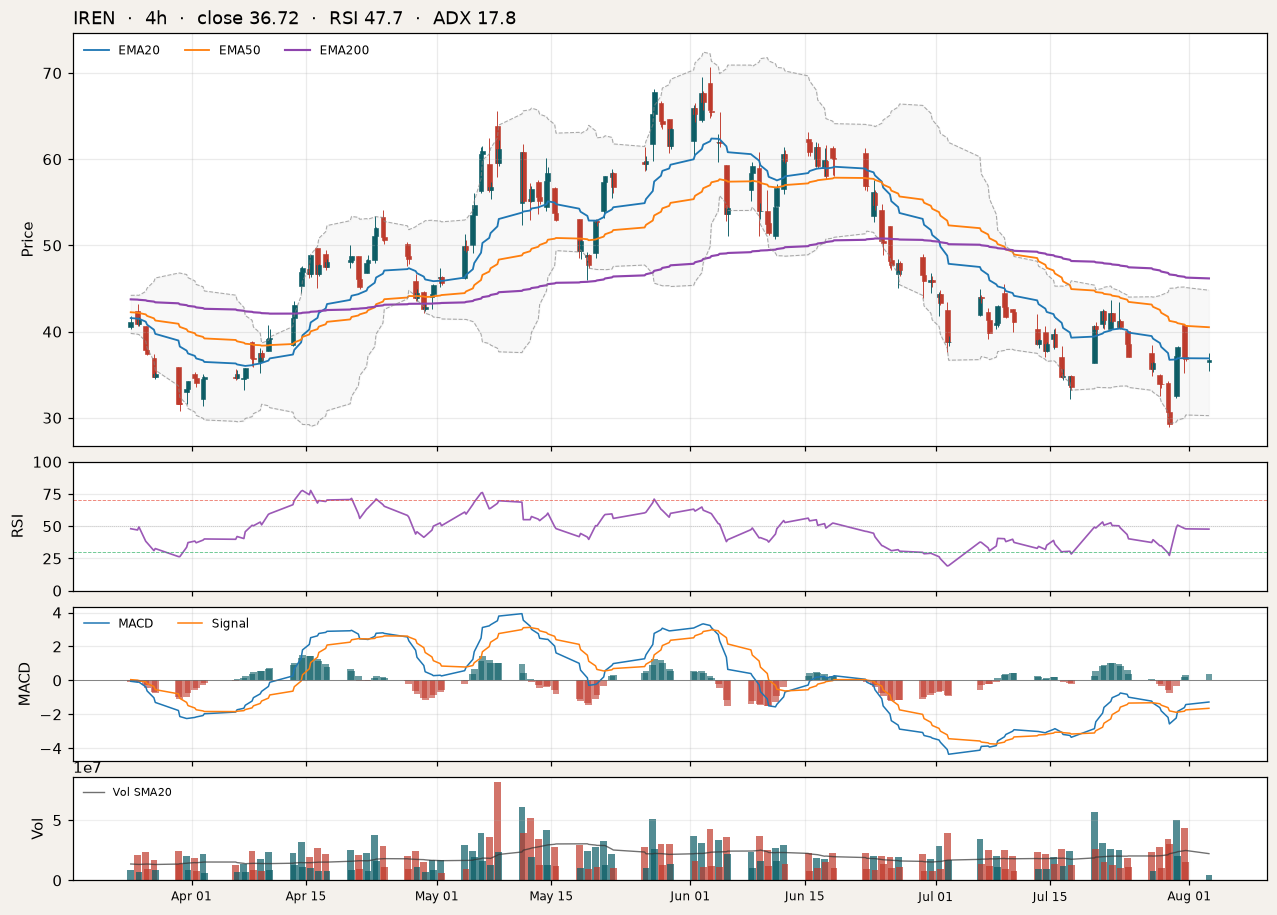
Below, $34.88 to $35.46 is near-term support from the late-July lows. Then $31.93, the line that decides the bigger picture. Then $28.93, the low that cannot break.
One number frames the risk in all of it. The average daily range is $4.40, roughly 12% of the share price, against a beta above 4. Sizing here isn’t optional, it’s crucial.
Technical conclusion: IREN is basing. The weekly trend is still down and price sits under every daily average, so this isn’t a buy-and-forget setup and calling it a bottom would be wishful. What changed is the character of the selling. July’s flush was forced supply, that supply has been transferred to a buyer who wanted it, and the failed break of $31.93 hands you a defined line to trade against. Patience above $28.93, aggression only above $41.30.
Trade Plan
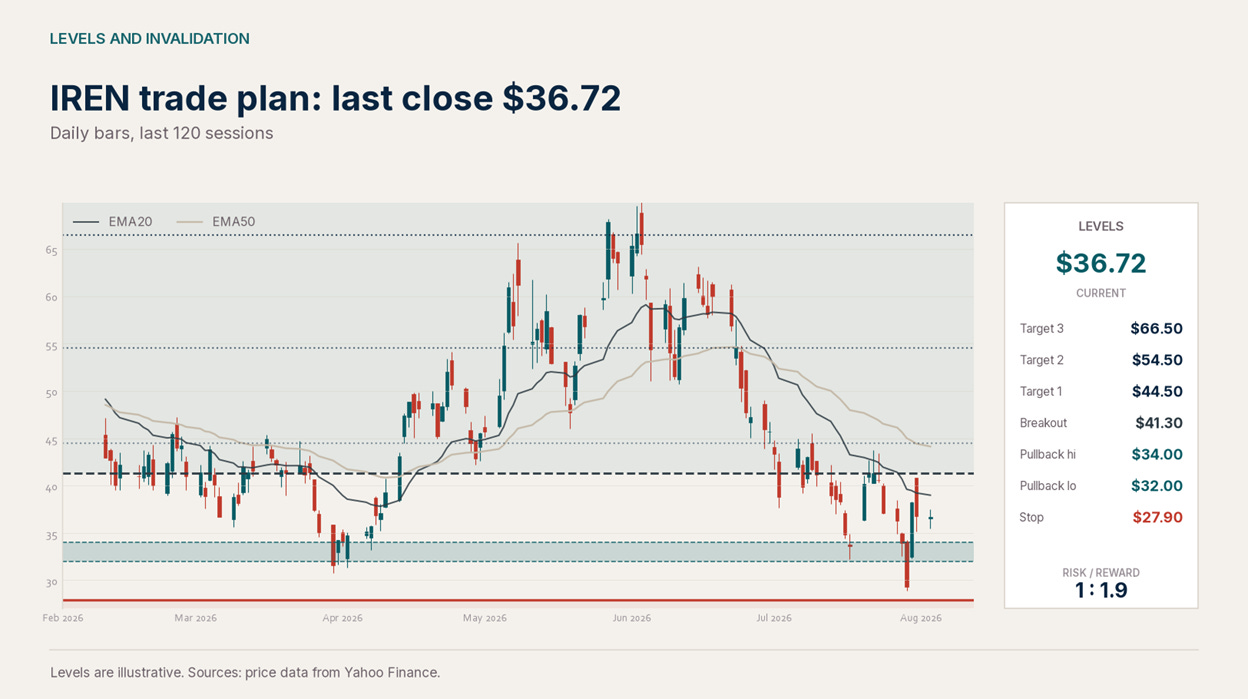
Pullback entry, $32.00 to $34.00. The retest zone. It sits above the July low and just over the $31.93 retracement that failed to break, so you’re buying where the last sellers gave up rather than chasing a bounce that’s already run 27%.
Breakout entry, above $41.30 on a daily close. That reclaims the post-announcement shelf and the 50% retracement at $40.51 in one move. Below it, every rally is still selling into a downtrend, and the burden of proof sits with the bulls.
Stop, $27.90. Not arbitrary padding. A close below $28.93 means the failed breakdown didn’t fail after all, the weekly retracement is genuinely lost, and the single best reason for owning this is gone.
Target 1, $44.50. Where the 50-day average, the upper volatility band and the 61.8% retracement of the June decline sit on top of each other. Expect friction.
Target 2, $54.50. The base of the daily cloud and the 38.2% retracement, and the first place the longer-term trend could actually flip rather than just bounce.
Target 3, $66.50. The upper weekly band and June’s supply zone. This one needs the delivery story working, not just the price.
Rolling the stop. At Target 1, lift the stop to your entry, since holding above $44.50 establishes a higher low and confirms the base has held. At Target 2, stop trailing to fixed prices and trail beneath the 1D EMA20 instead, because by then the trend is doing the work and a rigid level will shake you out of the move you waited for.
Sizing. Your risk is the distance from entry to stop, not the dollar value of the position. From $33.00 down to $27.90 that’s about 15%, and it’s wider from a $41.30 breakout unless you raise the stop with the entry. Decide what you’re willing to lose on the idea as a whole, then divide by that distance to get your position size. A position that feels comfortable on a quiet day won’t feel that way when the daily range opens to 12%, and this stock has done that repeatedly.
What Would Change the Read
There are 3, in order of how much they’d matter.
AI Cloud revenue at the next print. Not the target, the actual line. It was $33.6 M. If it doesn’t roughly double again, the ramp is behind schedule and the $4 B target starts looking like a 2027 number.
Commissioning at Horizon. The Microsoft handoff was scheduled for this quarter. Slippage there pushes revenue right and pressures the financing economics, since the debt costs money from the day it’s drawn.
Any equity raise. The June financing bought credibility precisely because it wasn’t equity. A large share issue would tell you the funding architecture isn’t holding, and with the count already up 53% the market’s tolerance is thin.
Bottom Line
IREN 0.00%↑ is actionable, but not at any price and not in size.
The bull case is stronger than the tape suggests. Power is the binding constraint in AI infrastructure, IREN has 5GW of it secured against a 480MW draw this year, the customer list now runs from Microsoft and NVIDIA down to frontier labs, and June’s financing showed the buildout can be funded with A-rated debt and customer prepayments rather than endless equity. At 3.7x the company’s own run-rate target, you aren’t paying a premium for any of that.
The bear case is simpler, and it’s made entirely of reported numbers. Roughly 77% of revenue still comes from Bitcoin mining and it’s falling. Capital spending is 3.7x revenue. Share count is up 53% in a year. More impairments are coming, because management said so. And measured from that last reported quarter, the AI business has to grow roughly 30-fold in 9 months for the target to be hit.
Both are true at once. That’s why a company with 5GW of secured power and a $9.7 billion contract from Microsoft trades at half its high while the lowest analyst target on the street sits above the share price.
The next real information arrives with fiscal 2026 results. Calendars currently point to Thursday, August 27, about 24 days out, though the company hasn’t formally confirmed the date and some services carry mid-September instead. Either way, what matters in that release is the AI Cloud revenue line and the commissioning schedule at Horizon, not the headline loss, which will be ugly whatever happens.
If you’re already holding, the plan stays live above $28.93 and you don’t need to do anything else. If you’re looking to start, wait for $32.00 to $34.00 or make the stock prove itself above $41.30. Chasing it here, mid-range with the weekly trend still pointing down and the bounce already 27% old, is the one thing that doesn’t pay.
The single level that decides it all is $28.93. Above it, this is a base being built by a company whose contracts are arriving faster than its revenue. Below it, it’s a downtrend that hasn’t finished, and the story can wait.
All content provided is for informational and educational purposes only and does not constitute investment advice, a recommendation, or an offer to buy or sell any security. The trade plans, levels, and scenarios discussed are illustrative frameworks based on market structure and are not guarantees of performance. Markets involve risk, and losses are possible. Past performance is not indicative of future results. Each reader is responsible for their own investment decisions, position sizing, and risk management.