


TSMC just guided 2026 to 40% dollar growth and the chip complex sold off anyway. Underneath the churn, the market now prices the challenger at more than twice the incumbent’s forward multiple: AMD at 37x, NVDA at 16x, with AVGO at 19x wearing the deepest drawdown of the 3. That ordering is the whole debate.
The river is proven. The dams are the argument.
This was the week upstream proof and downstream doubt collided. TSMC guided 2026 revenue growth above 40% in dollars, ASML is expanding system capacity 30% to meet orders, and Amazon just raised $25B of bonds partly to fund data centers. Meanwhile global chip stocks have reportedly shed $3.3 trillion of market value since late June, with Friday’s leg driven by an efficient new model from China’s Moonshot AI and a reported schedule slip in Alphabet’s next Gemini. The suppliers reinforced the near-term buildout; the selloff re-asked what it’s worth.
The multiples say the sharper argument is about structure, who captures the next dollar of a visibly funded buildout, and the answer being paid for is this article’s thesis: NVDA, growing 85% with 65% operating margins, trades at 16x forward earnings, while AMD trades at 37x and AVGO at 19x. All 3 forward multiples come from the same consensus feed, use analysts’ adjusted EPS estimates, and are struck at July 17, 2026 closing prices, so treat the ordering as the signal and the decimals as approximations. The incumbent is priced like its moat is already breached; the challenger is priced like the challenge has already succeeded. One of those prices is likely wrong.
Key Takeaways
The inversion: forward multiples run NVDA 16x, AVGO 19x, AMD 37x, while the 12-month return ranking reverses: AMD up 216%, AVGO up 29%, NVDA up 18%. The market’s highest incremental expectations sit on the challenger.
NVDA at $202.81: April-quarter revenue grew 85% to $81.61B with net income more than tripling, yet the stock sits 14% below its May record. The Street’s mean target is 49% higher.
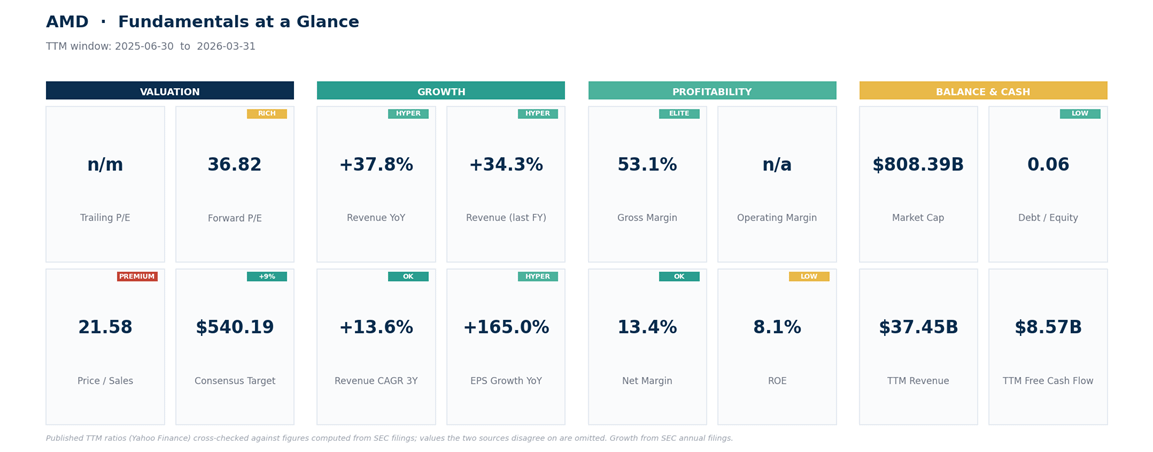
AMD at $495.76: up 104% from its April low to a June 30 record at $584.73, anchored by the OpenAI MI450 deal, at 37x forward with a 12% trailing operating margin and the thinnest analyst cushion (+9%).
·AVGO at $370.83: the custom-silicon franchise grew 48% last quarter at a 68% gross margin, yet wears the trio’s deepest drawdown, 25%, resting on its 200-day average.
The calendar adjudicates: AMD reports Tuesday, August 4; NVDA Wednesday, August 26; AVGO Thursday, September 3. Each print tests a different version of 2027.
The incumbent first, because its price is the strangest.
NVDA: Priced for a Breach That Hasn’t Happened
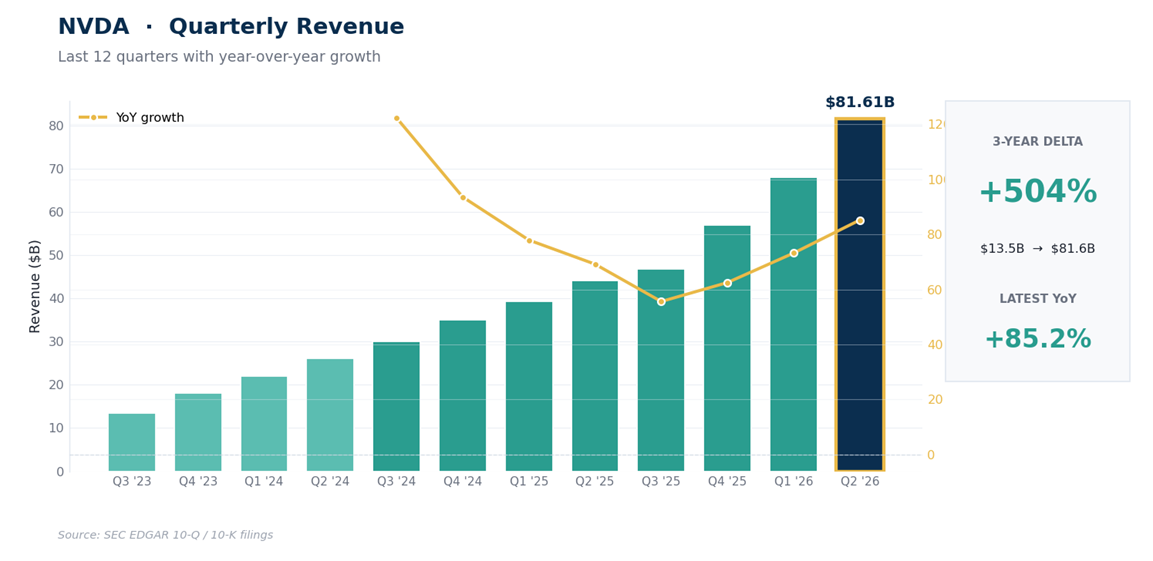
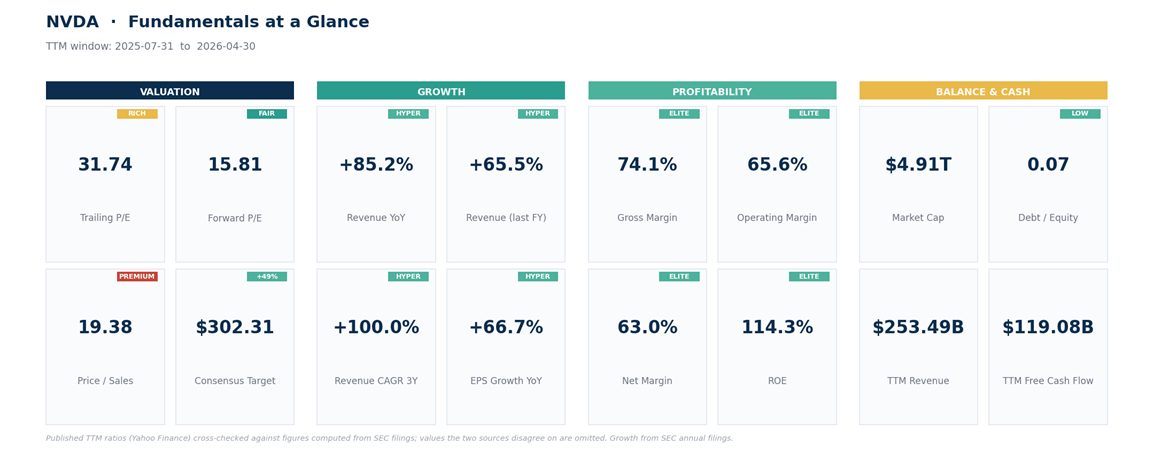
Start with what the business did. April-quarter revenue of $81.61B grew 85% from a year ago, the 5-quarter revenue arc reads $44B, $47B, $57B, $68B, $81.6B, and trailing-12-month revenue is $253.5B at a 74% gross margin and roughly 65% operating margin, with $119B of trailing free cash flow. No other company at this scale currently matches those economics, and the market’s response over 12 months has been an 18% gain and a de-rate to 31.7x trailing and about 16x forward earnings, a multiple the S&P’s staid industrials would recognize.
The de-rate has reasons, and they’re not silly. Goldman’s forecast has custom silicon reaching parity with merchant GPUs in AI data centers by 2027; a July 6 SemiAnalysis report, disputed by NVIDIA, put its next flagship rack system slipping to 2028 on circuit-board yields; and Apple just reclaimed the most-valuable-company crown from it, a symbolic changing of the guard.
The market is pricing meaningful share and margin erosion, in advance, on a company still compounding at 85%. That’s the setup: if the moat erodes slowly rather than suddenly, 16x forward is among the cheapest growth profiles anywhere in mega-caps, which is roughly what the Street’s mean target at $302 (49% above the price) is arguing.
The tape has gone quiet while that argument rages: 2 months inside a 190-to-236 range, the 20-day and 50-day averages flat and stacked at $204.50, daily RSI, a 0-to-100 momentum gauge, dead neutral at 48. The weekly uptrend is intact. This is a coil, and the August 26 report is the likeliest uncoiling.
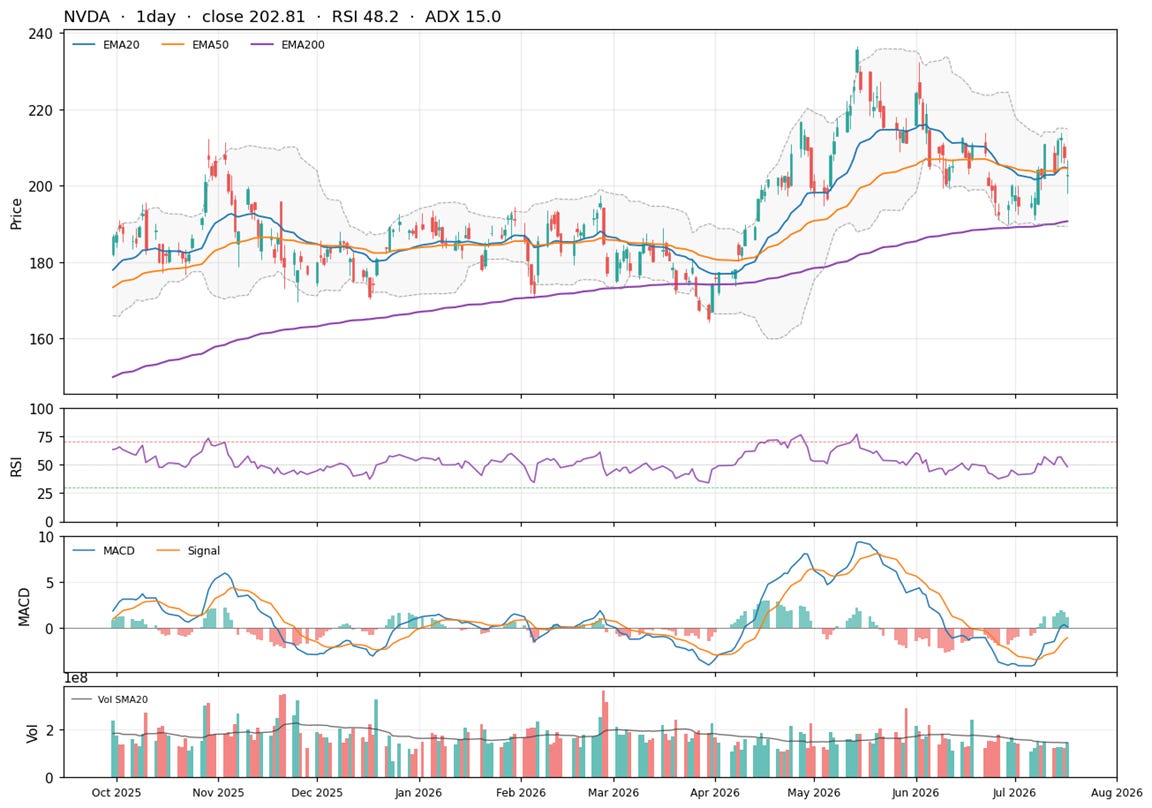
Net read: the fundamentals are accelerating, the multiple is compressing, and the price is range-bound while those forces cancel. Whichever way 190 or 213 breaks likely runs.
The challenger next, because its price assumes the most.
AMD: Where the Expectations Run Highest
AMD is the market’s chosen vehicle for the “NVIDIA share loss” trade, and the year rewarded it extravagantly: up 216% over 12 months, including a 104% run from its April low of $286 to a June 30 record at $584.73. The story is real. March-quarter revenue grew 38% to $10.25B, data-center revenue is reported near $5.8B and growing 57%, and the multi-year MI450 agreement with OpenAI gave the challenger thesis a marquee anchor.
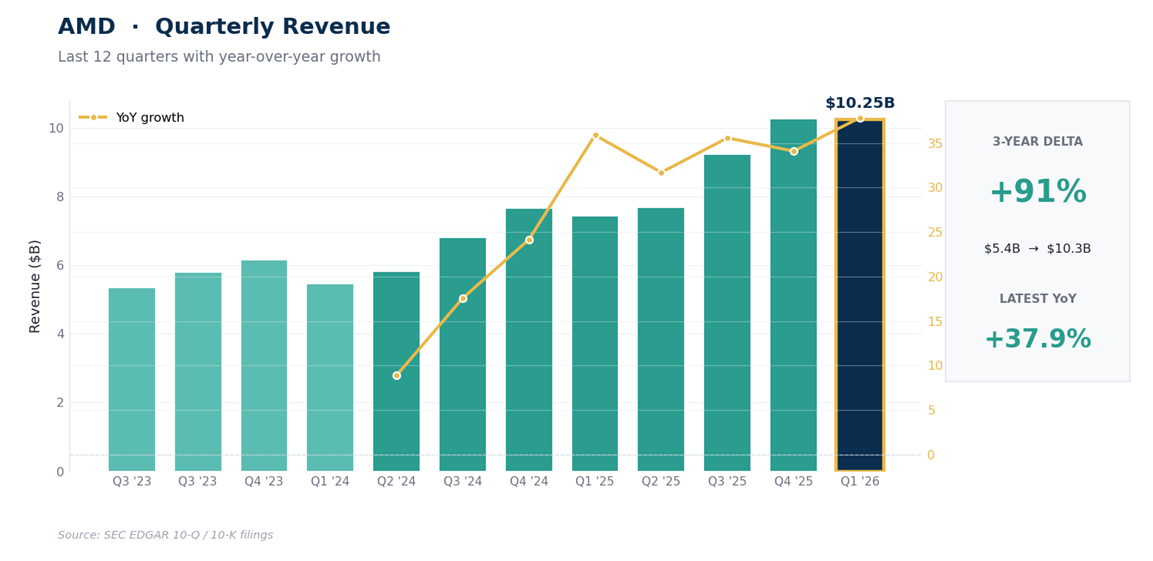
The premium has a rational case, and it deserves a fair hearing. Today’s 12% trailing operating margin is a mix artifact more than a ceiling: as accelerators become the revenue base, gross profit scales across a relatively fixed cost pool, the OpenAI agreement locks in a marquee buyer through the MI450 cycle, and each software release narrows the gap that has kept workloads inside NVIDIA’s ecosystem. If that operating leverage arrives, trailing earnings badly understate normalized power, and 37x overstates the true multiple.
Now the sequencing problem. AMD earns a 50% gross margin on a business one-seventh NVDA’s revenue, and at 37x forward against the incumbent’s 16x, the leverage has to arrive on schedule, not eventually. The Street’s own math says the easy repricing already happened: the mean target of $540 sits just 9% above the price, the thinnest cushion of the trio, with 10 of 51 analysts at hold.
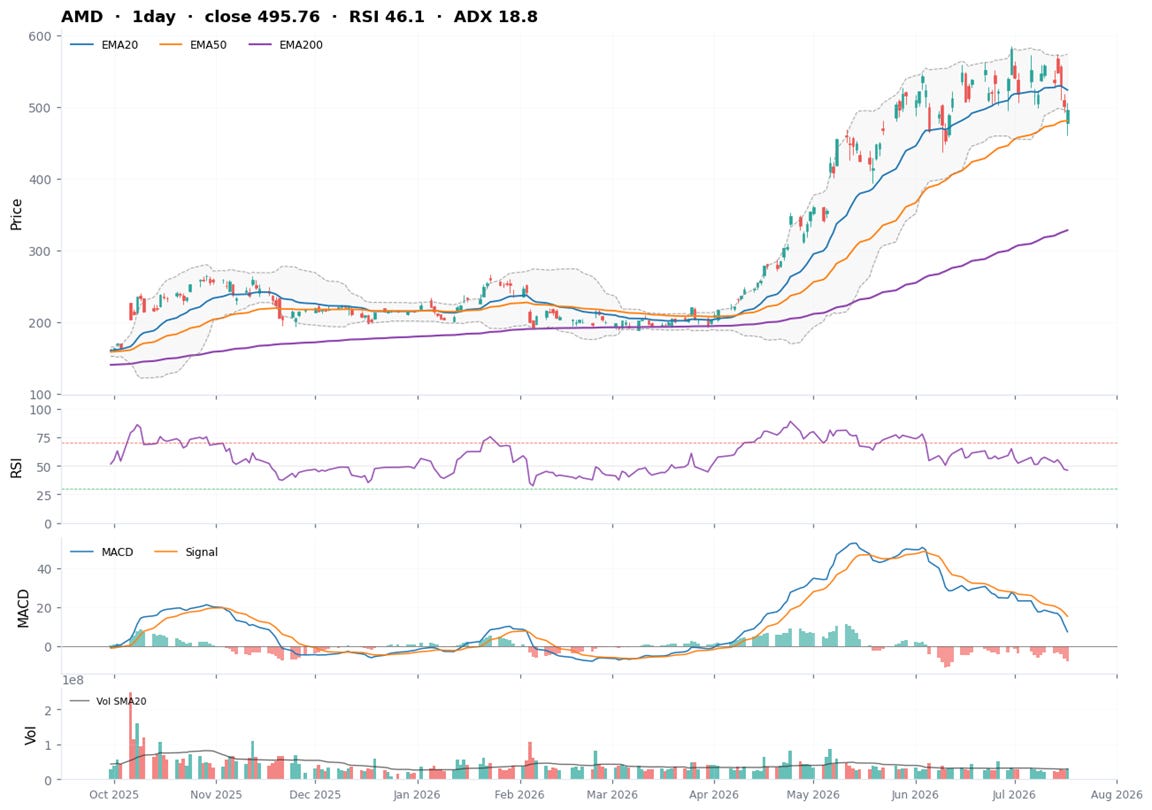
The tape is a parabola catching its breath: 15% off the record, below the 20-day average, holding just above the 50-day at $481, with the fast stochastic momentum reading pinned near 1, extremely oversold on this setting, though such readings can persist in strong pullbacks.
The 38.2% retracement of the April-to-June run sits at $471, right under the 50-day: that 465 to 482 band is where this pullback either proves itself routine or doesn’t. And the clock is short: AMD reports in 17 days, first of the 3, which makes it the trio’s nearest referendum and its most dangerous pre-positioning trade.
Net read: strongest momentum, thinnest margin for error, soonest test. If the challenger thesis wobbles on August 4, 37x forward has a long way to compress.
And the quiet one, whose tape disagrees with its story.
AVGO: The Structural Winner at Its Key Test
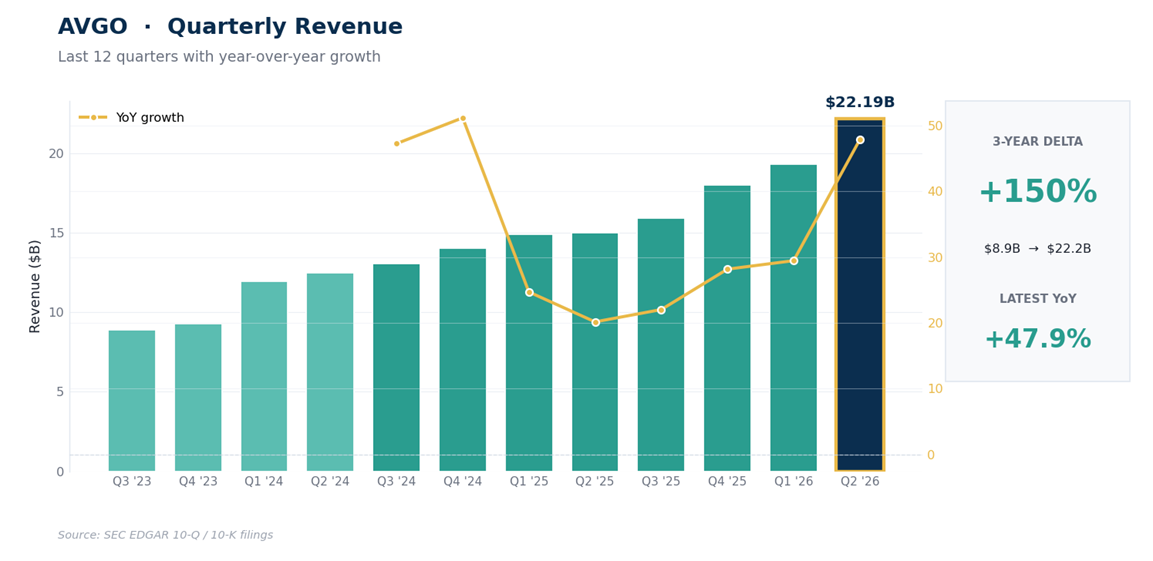
On the fundamentals, Broadcom owns the trend everyone fears on NVIDIA’s behalf. Custom accelerators for hyperscalers plus the networking that stitches AI clusters together drove April-quarter revenue up 48% to $22.19B at a 68% gross margin, reports put its AI revenue guidance near $16B for the current quarter, and a reported $30B multi-year custom-chip arrangement with Apple extends the franchise. If Goldman’s 50/50 silicon split arrives, AVGO is its largest single beneficiary.
Yet the tape is the weakest of the 3: down 25% from its June 3 record at $495, below every daily moving average except the 200-day at $358, which the July 2 low at $356.40 tested and held. Some of that’s June froth unwinding, and some is worth taking seriously: AVGO’s AI revenue is concentrated in a handful of hyperscaler design wins, and the same capex scrutiny that knocked the sector this week lands hardest on the supplier whose backlog is a few big customers’ budgets.
On valuation, the trailing 62x isn’t clean (acquisition amortization depresses GAAP earnings); the forward 19x is the better anchor, and the mean target at $525 sits 41% above the price.
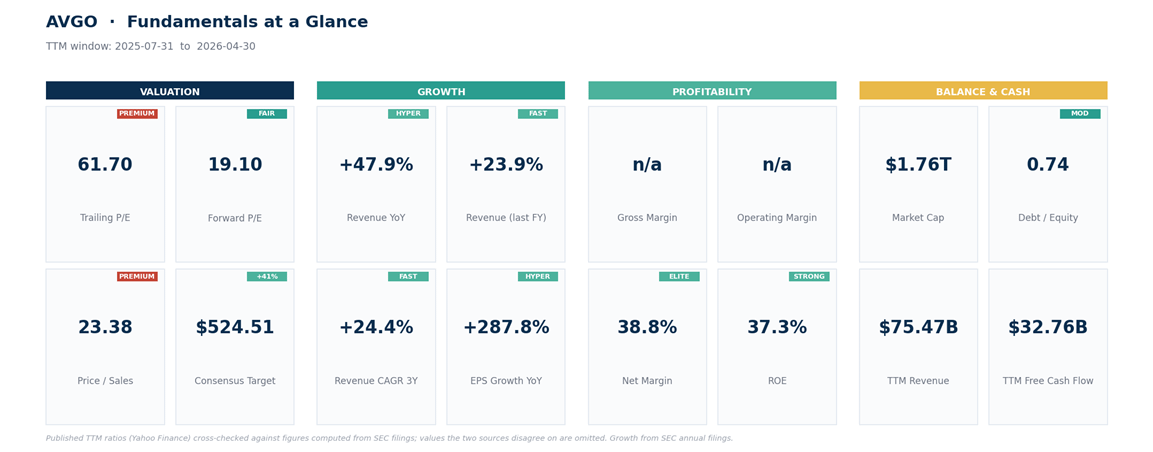
Net read: the strongest structural story in the group is sitting on its most important technical level. The 356 to 368 band (200-day average, the 61.8% retracement of the spring run, and the July floor) either holds and defines the trade, or fails and warns that someone knows something about those hyperscaler budgets.
How to act on all 3, one framework each. Educated approches, not promises.
The Trade Plans
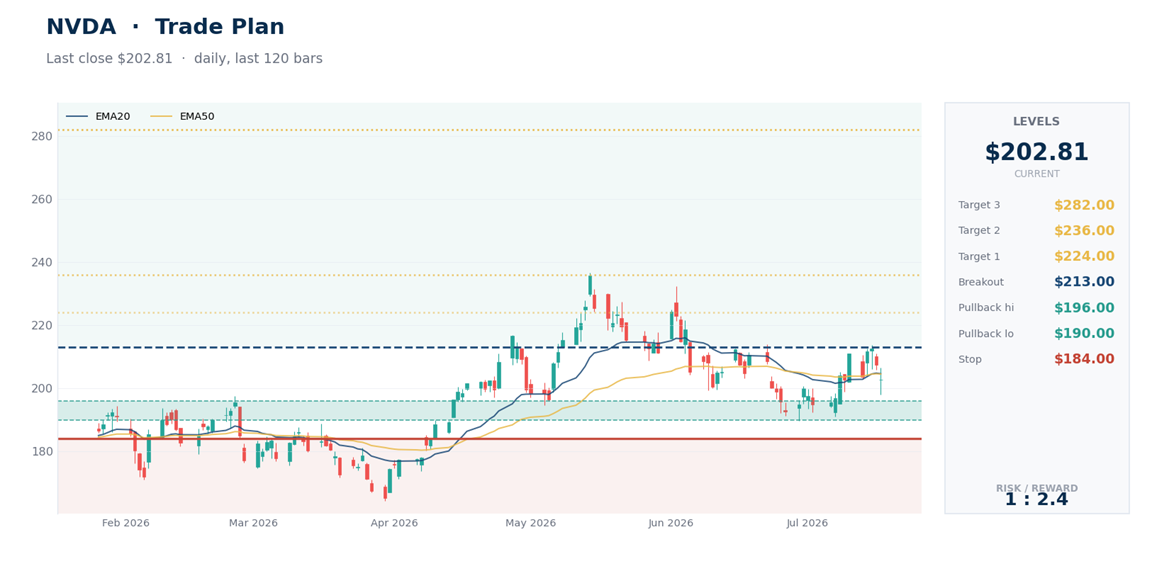
NVDA: thesis zone 190 to 196, the range floor, June low, and lower volatility band. Breakout alternative on a daily close above 213, the July recovery high. Structural failure below 184. References above: 224 (the June supply shelf), the 236 record, then 282 (the range height projected past the record). Earnings August 26; the range likely holds until then.
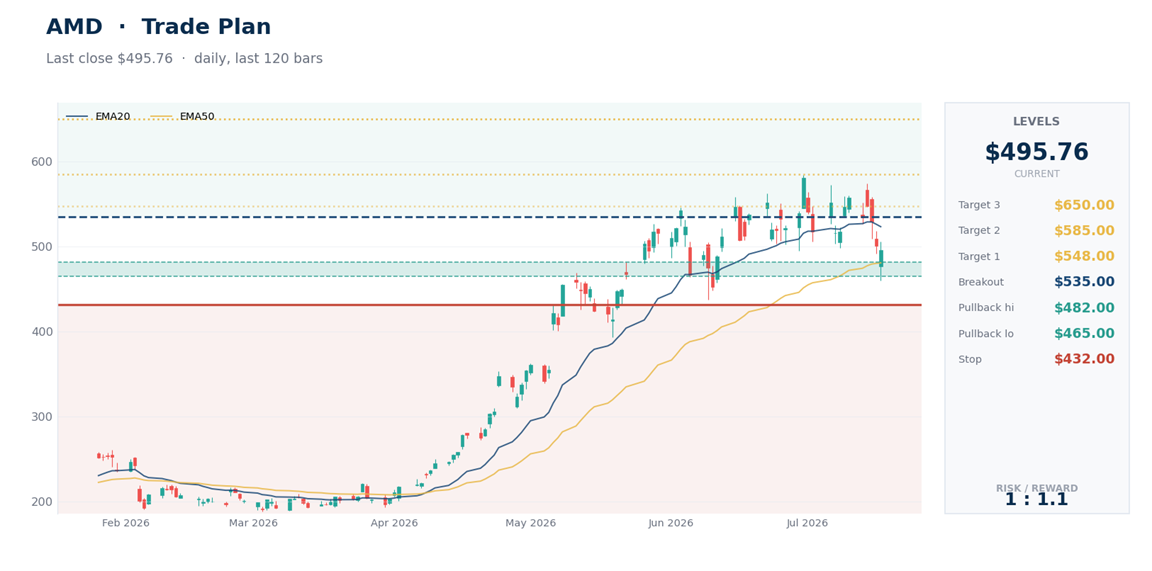
AMD: thesis zone 465 to 482, the 50-day average and the 38.2% retracement. Repair on a close above 535, the 20-day area. Structural failure below 432, under the halfway retracement of the whole run. References: 548 (the July recovery high), 585 (the record), then 650 (roughly the 465-to-585 consolidation height projected from a 535 reclaim). With earnings on August 4, anything entered before the print deserves half size at most; 37x forward plus a binary date is how sizing errors compound.
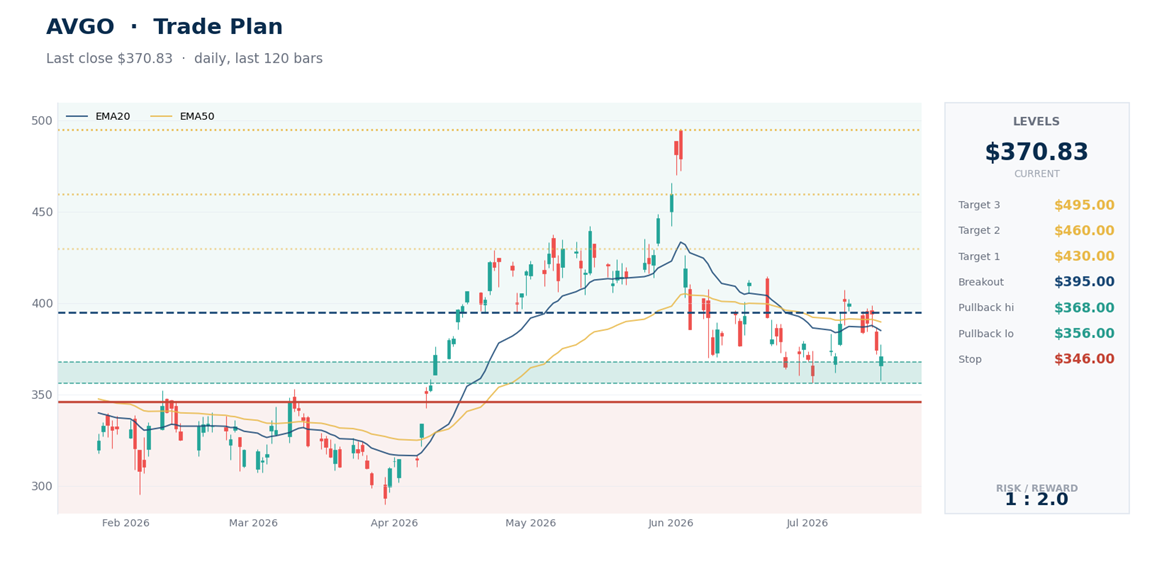
AVGO: thesis zone 356 to 368, the 200-day, the 61.8% retracement, and the July floor, with price already at its upper edge. Repair on a close above 395, the mid-July high. Structural failure below 346; a decisive 200-day loss in this tape would say the drawdown is information, not noise. References: 430 (the June congestion shelf), 460 (the early-June supply), then the 495 record.
On sizing, one rule for all 3: divide your portfolio risk budget by each trade’s planned risk (roughly 5% for NVDA and AVGO from zone midpoint to stop, roughly 9% for AMD), and assume a gap can run the modeled loss to 1.5 to 2 times plan; these names move 3.5% to 7.5% a day. A 0.5% budget implies positions near 10% in the first 2 and near 6% in AMD. The order of operations matters more than usual: AMD’s print lands 3 weeks before NVDA’s and a month before AVGO’s, and its result will move all 3.
Bottom Line
The week reinforced the near-term buildout and shifted the debate to returns, architecture, and share capture, and the multiples show where the market’s incremental expectations sit: 37x on the challenger, 19x on the toll collector, 16x on the incumbent still growing 85%. That ordering embeds strong assumptions in AMD, mild ones in AVGO, and outright pessimism in NVDA, and that’s why the risk-reward reads inverted from the price action: the stock that went up least may now need the least to go right.
August 4 starts the adjudication. Until the prints, the levels do the talking: 190 under NVDA, 465 under AMD, 356 under AVGO. Hold those and it’s consolidation inside the largest capex cycle in tech history. Lose them together, and the market isn’t repricing the dams anymore; it’s repricing the river.
This is research and commentary, not personal investment advice. Levels and trade plans are illustrative; size positions to your own risk tolerance and time horizon. The author may hold positions in names discussed.