
LOCKHEED MARTIN & NORTHROP GRUMMAN - Ahead of Earnings
Deep Dive Fundamental & Technical Analysis • Medium‑Long Term

In an era of rising geopolitical tensions and accelerating defense budgets, the prime contractors at the top of the food chain, Lockheed Martin LMT 0.00%↑ and Northrop Grumman NOC 0.00%↑ offer both ballast and optionality for investors. These aerospace‑defense behemoths not only dominate government contracting but also drive technological innovation in hypersonics, cybersecurity, and space. Yet, beneath their Herculean reputations lie the balance sheets, margins, and chart patterns that determine whether today’s stock price is a buying opportunity, a holding pattern, or a call to cash in.
Key Takeaways
Secular Tailwinds: Rising global defense budgets (NATO, Indo‑Pacific, space) underpin long‑term growth for both LMT and NOC.
Superior Profitability: Lockheed’s ~12.4% operating margin and Northrop’s ~11.1% outpace the sector average (~9.5%).
Rock‑Solid Backlogs: LMT $66 B and NOC $55 B in backlog up 6–7% YoY, ensure revenue visibility for years.
Cash Flow & Returns: 70%+ FCF conversion, decades of dividend raises, and $50 B+ combined buybacks demonstrate disciplined capital allocation.
Balance Sheet Strength: Net Debt/EBITDA ~2.3–2.5x with low borrowing costs and ample liquidity for M&A or further buybacks.
Attractive Valuations: Trading at ~17–19x P/E and ~11–12x EV/EBITDA, below or in line with peers despite superior margins.
Technical Setups:
LMT: Bull‑flag on 2‑hr chart, key support $466–$468 aligns with Fib 38–50% and Ichimoku cloud top.
NOC: Symmetrical triangle near $520–$522, 38.2% Fib retrace, bullish Ichimoku bias.
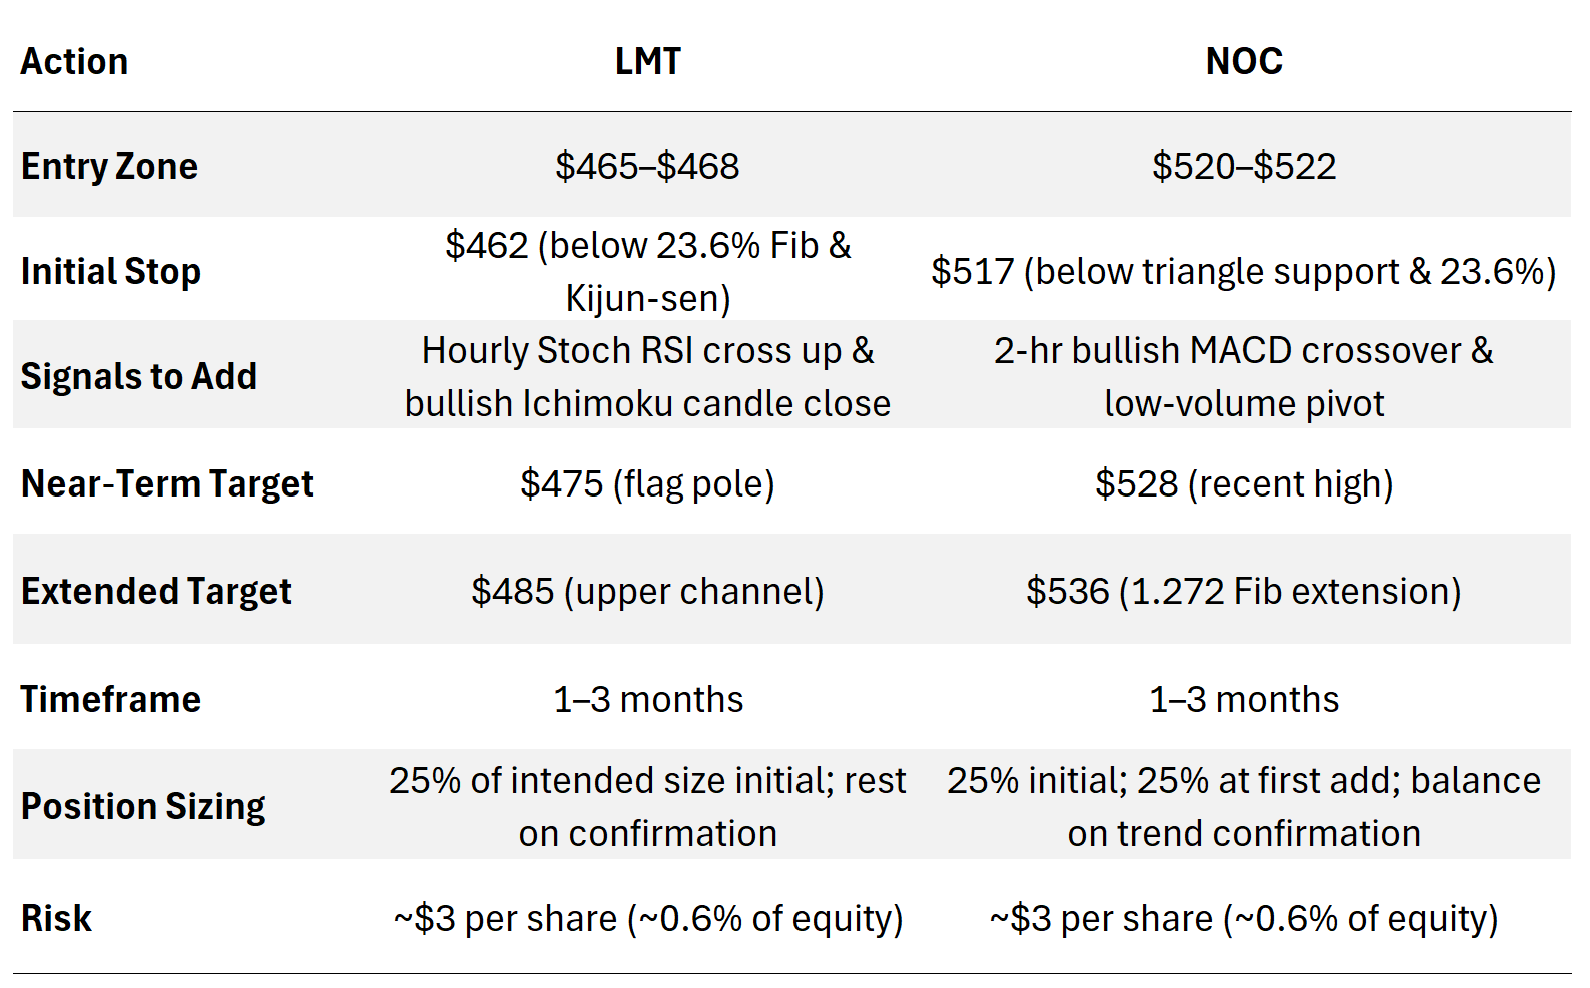
Trade Plan:
LMT Entry: $465–$468, stop $462, target $475/extended $485.
NOC Entry: $520–$522, stop $517, target $528/extended $536.
Risk Management: Tight stops (~$3 per share), staged entries (25% initial), add on confirmation.
Macro & Sector Backdrop
Global Defense Spending is on pace for mid‑single‑digit annual growth through 2028, driven by NATO rearmament, Indo‑Pacific tensions, and space‑domain awareness.
U.S. Budget Authority: FY 2025 base + supplemental topping $900 B, with continued bipartisan support, contracts aren’t drying up.
Tech Arms Race: Hypersonics, unmanned systems, directed energy, and resilient C4ISR are hotspots. LMT & NOC are at the forefront.
Key Sector Metrics
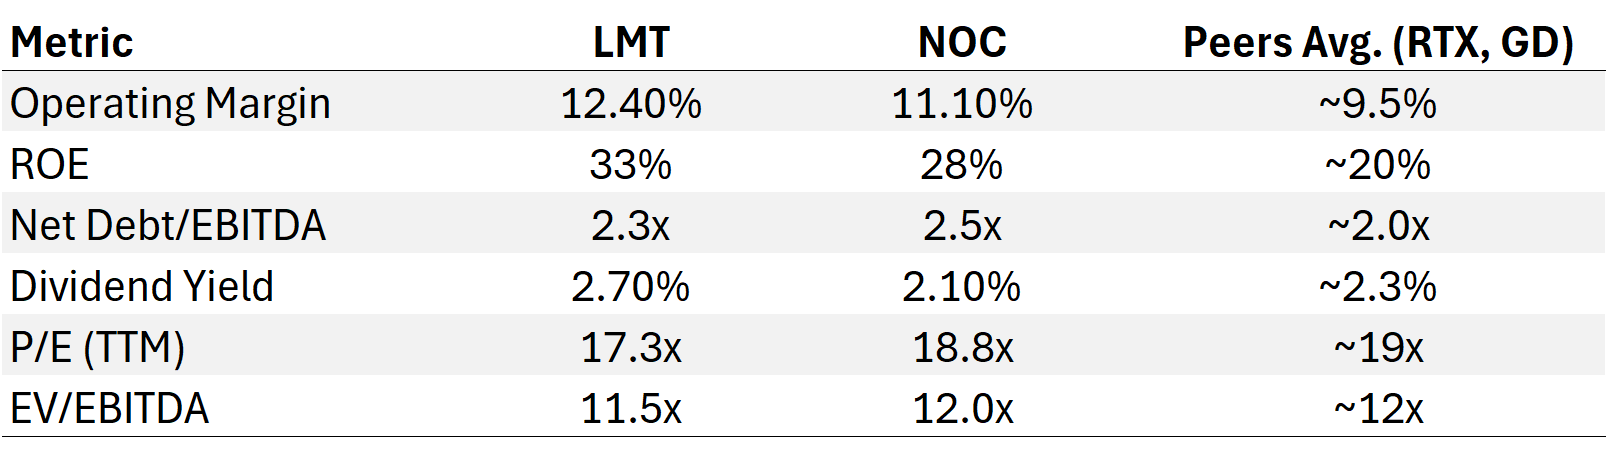
Compared to peers, both LMT and NOC deliver superior profitability at slightly tighter valuations.
Fundamental Deep‑Dive
A. Revenue & Backlog
Lockheed Martin: $66 B backlog (up 7% YoY). F-35 ramp, Space Force sats, and Sikorsky Black Hawk modernization are engines of growth.
Northrop Grumman: $55 B backlog (up 6% YoY). B-21 Raider prototype, James Webb Space Telescope legacy, and cybersecurity services drive sticky revenue.
B. Margin & Profitability
Ops Leverage: Each has maintained margins ~300 bps above sector over the past five years—thanks to high‑value, low‑volume platforms.
SG&A Discipline: G&A as % of revenue ~6% for both (vs. peer ~7–8%).
C. Cash Flow & Capital Allocation
Capital Expenditure: 3–4% of revenue, focused on R&D, not ground facilities.
Free Cash Flow Conversion: ~70% of net income, healthy and consistent.
Shareholder Return: Five years of steady dividend raises and $35 B in buybacks (LMT) / $20 B (NOC).
D. Balance Sheet & Leverage
Debt Profile:
LMT’s average cost ~3.2%, maturity ladder spaced through 2037.
NOC’s average cost ~3.5%, with tuck‑in acquisition capacity.
Liquidity: Combined cash + revolver capacity > $15 B, ample runway for M&A or share repurchase.
Fundamental Mini‑Conclusion
Both companies check the boxes: growth in backlog, above‑average margins, fortress balance sheets, and shareholder returns that outpace sector norms. At current valuations, they offer a margin of safety and upside leverage to continued defense spending.
Technical Microscope
Lockheed Martin (LMT)
Trend: Since March, price has respectably oscillated between $460 and $485, forming a bull‑flag consolidation.
Ichimoku Cloud (2‑hr chart):
Price sits at cloud top (~$465), with Kijun‑sen support at $462.
Tenkan‑Kijun just crossed bullish.
Fibonacci Retracements (short‑term swing high/low):
38.2%: $466
50%: $467.7
61.8%: $469.3
Momentum:
Daily RSI ~50, no divergence.
Hourly Stoch RSI bouncing from oversold.
Set‑Up: A retest of $466–$468 that holds would trigger a run to $475–$480 (range high + measured flag).

Northrop Grumman (NOC)
Trend: A clear up‑slope from June lows ($481) to July highs ($529), now digesting in a symmetrical triangle.
Ichimoku (hourly): price perched above the cloud, Tenkan‑sen rising toward Kijun‑sen, bullish bias.
Key Fib Levels (529 → 515 swing):
38.2%: $521
50%: $522.7
61.8%: $524.4
Momentum Indicators:
MACD (daily) flattening after bullish run, watch for a positive re‑acceleration.
ADX ~17 (weak trend) on 2‑hr, signaling a potential breakout zone.
Set‑Up: Watch $520–$522. If price holds and volume contracts, odds favor another leg to $530–$536.

Our Investment Blueprint
Bottom Line
Both Lockheed Martin and Northrop Grumman occupy sweet spots where secular defense growth, technological edge, and shareholder‑friendly cash flows intersect. Their fundamentals are robust, margins, returns, and balance sheets surpass the sector and their chart structures offer clear, high‑odds setups around key Fibonacci and Ichimoku levels. For a medium‑ to long‑term investor, these names warrant staged entries on defined pullbacks, tight risk controls, and the confidence that government spending tailwinds remain intact.
In uncertain times, buy what governments must buy.
This information is provided for educational purposes only and should not be construed as investment advice or a solicitation to buy or sell any securities.