Lululemon Athletica Inc. (LULU) - The Athleisure Icon
Oversold and Searching for a Base

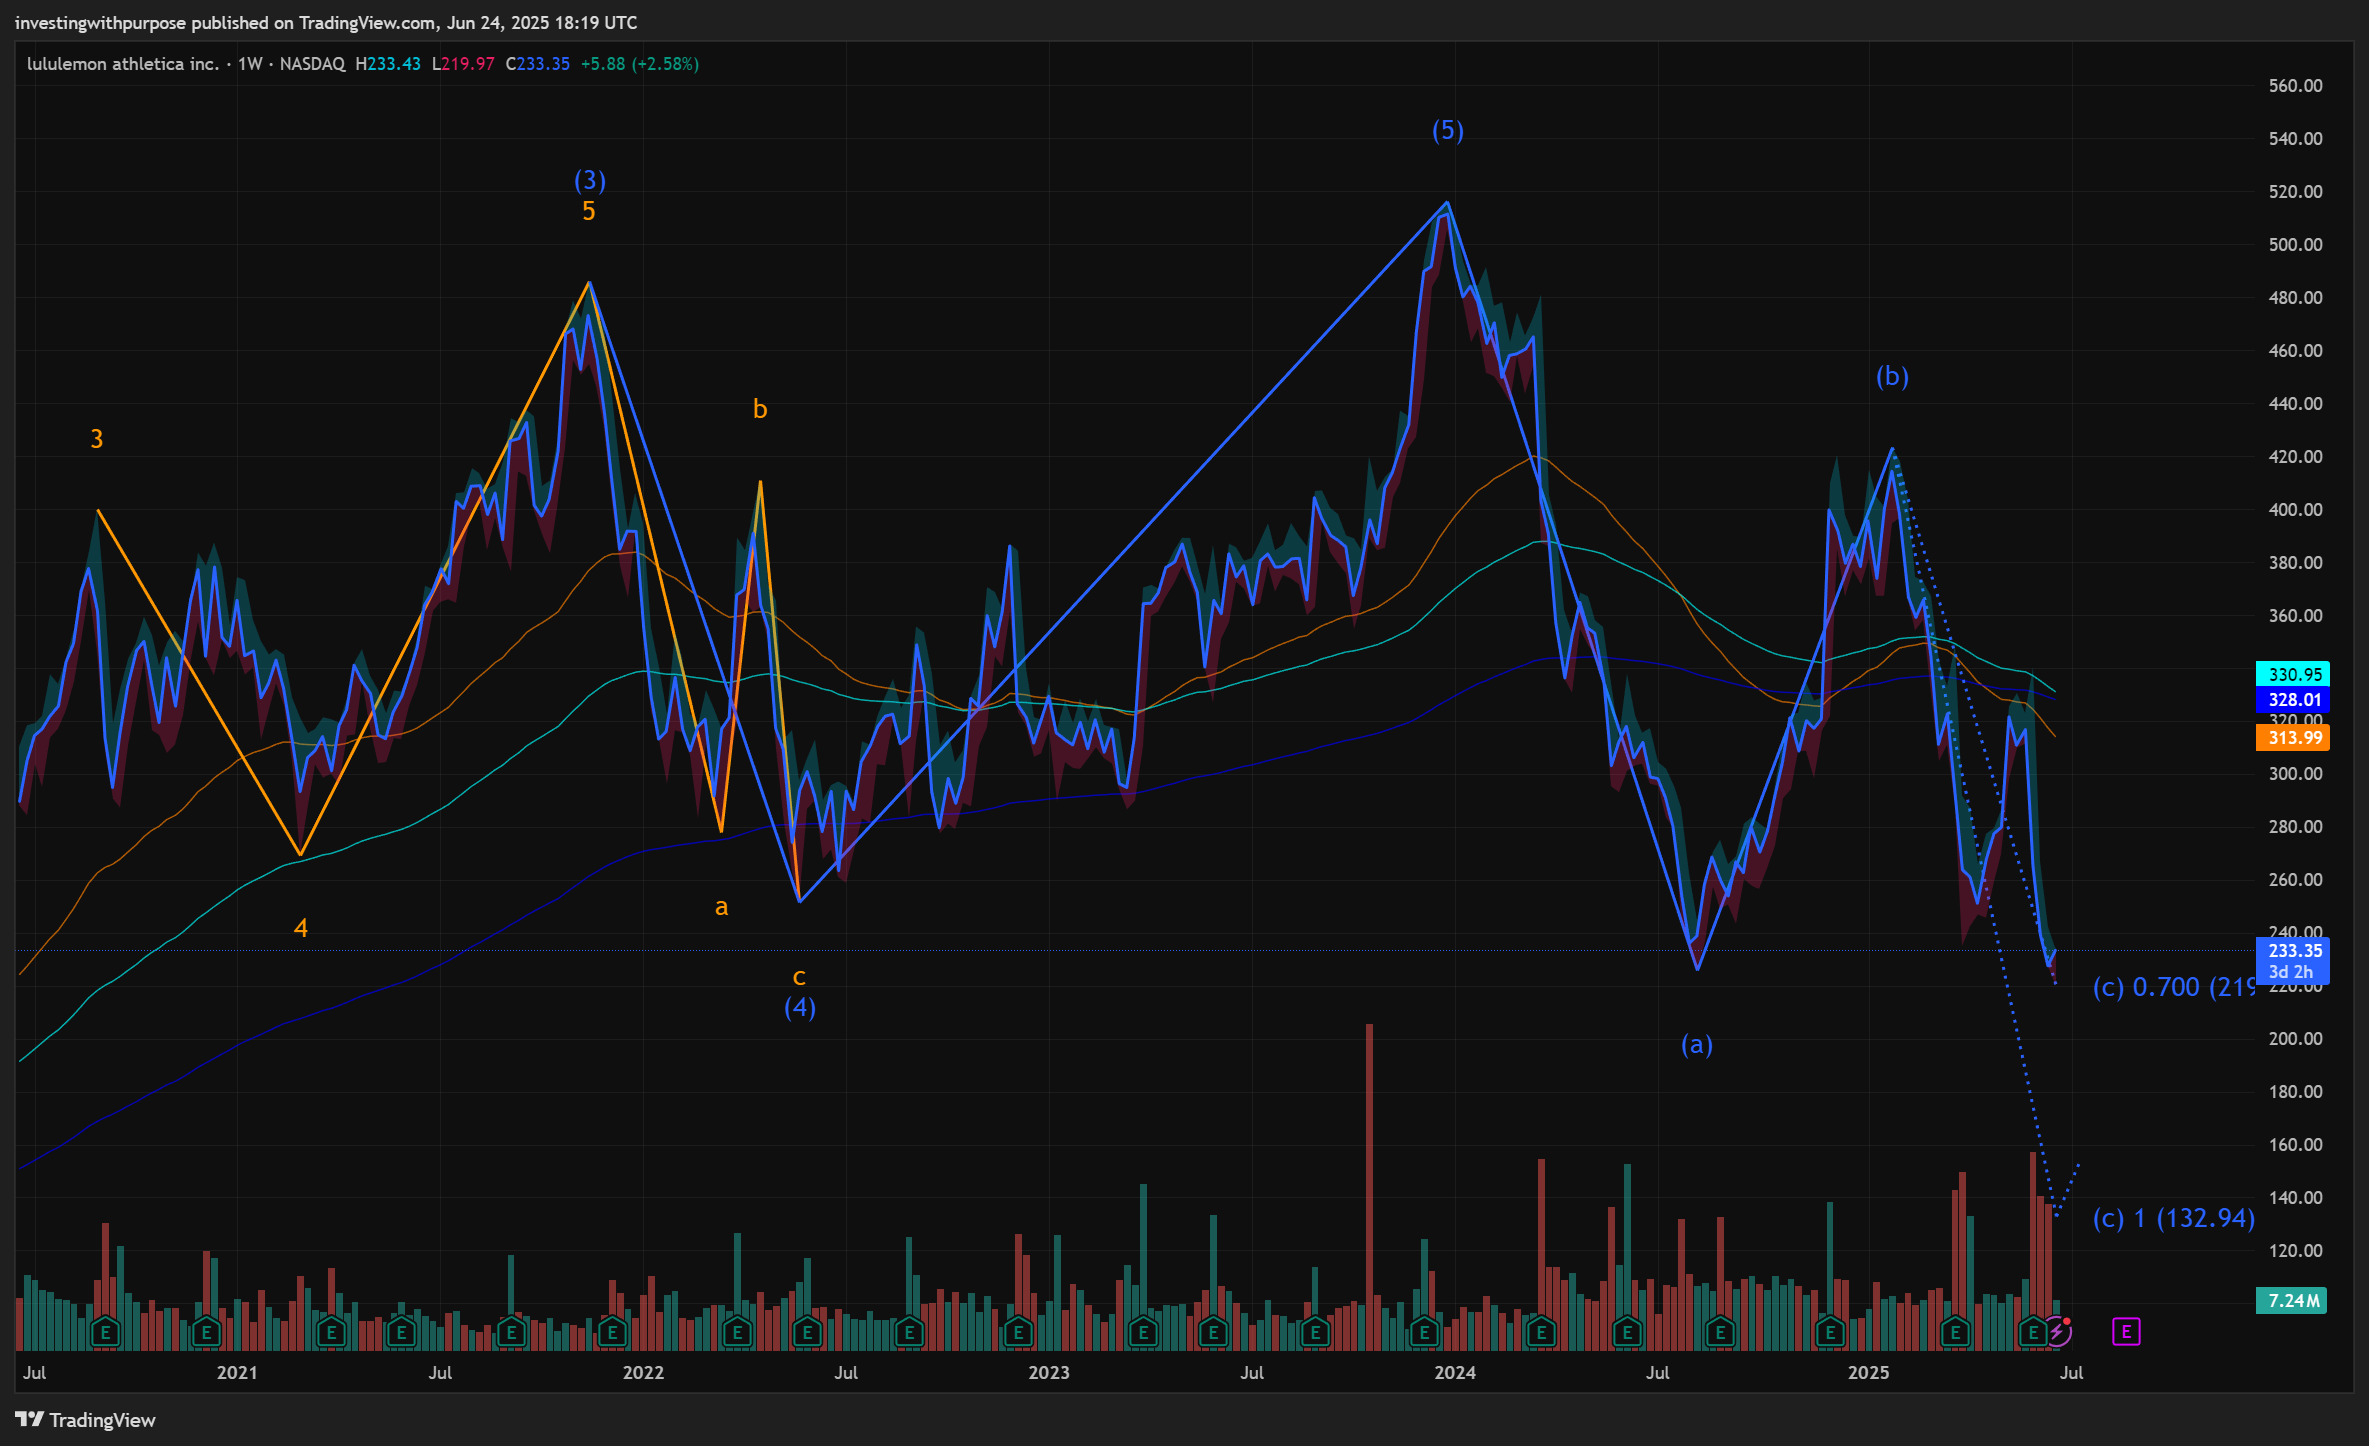
LULU 0.00%↑ down 40% from its highs. Weekly trend broken - RSI < 40, MACD deep in the red. Daily rejected .382 retrace ($237) and pressing towards .236 ($220). Oversold, no reversal yet.
LULU clipped FY25 EPS guide to $14.58–14.78 (down ~3–4%) as rising import duties (~100bps margin hit) and weaker traffic pressure the brand. New lines missed. Premium competitors gaining ground.
LULU summary: Oversold chart, weaker guide, rising costs, new lines missed. $215–$220 is the key area. Hold it, and a counter‑trend rally is in play. Lose it, $200 is next. This is a show‑me stock until price confirms a turn.
TL;DR
Wave 4 retrace finding its base between $215–$220 (weekly chart).
Short‑term resistance ~$237, RSI and MACD still neutral–negative.
Wave 5 target= $410–$420 if long‑term trend resumes (1.618× Wave 1).
Forward P/E=15–16× vs premium peers (~18–20×). Gross margins down ~100bps due to rising import duties. New product lines missed internal sales marks, making the brand harder to justify at a premium.
Best approach: scale into long‑term positions with tight, time‑aligned stops.
1. Elliott Wave & Weekly Technicals
Wave Count: Final leg of five‑wave rally topped early 2024. Current correction (Wave 4) retraces 78.6% of Wave 3 ($215–$220).
Wave 5 Target: Fibonacci extension (1.618× Wave 1) ~= $410–$420.
Weekly RSI: ~35.9, bullish divergence versus prior low suggests waning downside momentum.
MACD: Histogram contracting, hinting that selling pressure may be exhausting.
Implication: Weekly signals aligning for a durable low - ideal zone for long‑term accumulation.
2. Fundamentals
Forward P/E: ~15–16×; lower than premium peers.
Gross Margin: Down year‑over‑year as higher import duties and cost pressures weighed on profitability.
Guidance: FY25 EPS trimmed to $14.58–14.78 (~3–4% cut), reflecting cost pressure and weaker traffic.
Product Trends: New lines (Glow Up, Daydrift) missed internal sales marks, making the core franchise (Align) more critical for recovery.
Implication: Valuation reset closer to fair value, making $LULU a viable long‑term candidate if trend and earnings justify a re‑rating.
3. Daily Signals & Confirmation
20/50/200‑SMA Ribbon: Bearish, but flattening.
Key Level: $237 (daily .382 retrace) needs to be reclaimed for trend shift.
MACD: Line approaching signal line from below — crossover >0 confirms medium‑term shift.
Implication: A daily close > $237 triggers trend reversal watch, making this the line in the sand for new buyers.
4. Intraday Signals (2H–1H Charts)
Ichimoku Cloud: $LULU still trading below cloud resistance (~$235–$237), breakout required for momentum shift.
Stoch‑RSI (3,3,14,14): Oversold, suggesting sharp swings in either direction as price compresses.
Heikin‑Ashi: Mixed wicks imply low conviction until price clears the cloud.
Implication: Expect chop until breakout confirms trend shift.
5. Phase‑Based Entry & Risk Management
Phase 1 (Base): 30% in the $215–$220 range | Stop ~$210
Phase 2 (Confirm): 40% if daily close > $237 | Stop adjusted to $230
6. Macro & Catalyst Calendar
Tariffs: Import cost pressure (~100bps) expected to normalize if global supply chains stabilize.
Consumer Spend: Inflation and cautious behavior remain key risks.
Product Cycle: New lines need strong early sales for sentiment shift.
Earnings Date: 66 days until the next earnings call - pivotal for guidance review and price reaction.
Final Thought
$LULU is no longer priced for perfection. Oversold chart, weaker guide, rising cost headwinds, and underperforming new lines have reset expectations. In this zone, patient investors can build a position within $215–$220, adding on trend confirmation > $237 and $270. This is a show‑me story, best approached with discipline and a clearly defined roadmap.