
Mastering P/E, PEG, and Price-to-Sales: Valuation Ratios Made Simple
A clear, practical guide to three of the most important valuation ratios, their history, how to interpret them, and how to integrate them into a full investment process.

TL;DR
P/E, PEG, and Price-to-Sales are three of the most common valuation ratios, each showing how the market is pricing a company relative to its earnings, growth, or sales. Their meaning has evolved over decades: P/E dominated early industrial investing, PEG rose with growth stock booms, and P/S became popular with high-revenue but unprofitable tech firms.
These ratios measure market value against certain fundamentals, not intrinsic value. Intrinsic value is what a business is truly worth based on its future cash flows, assets, and competitive position, while market value is what investors are currently willing to pay. The two often diverge due to sentiment, economic cycles, and investor psychology.
In bullish markets, high ratios may feel normal; in bearish periods, even fair valuations can look expensive. Sector norms also matter. What’s high in one industry may be low in another. The most effective use of these ratios is as a starting point: compare within sectors, check against history, and integrate with deeper analysis of growth, profitability, and risk.
Valuation ratios are the quick language of the stock market. You see them in earnings headlines, analyst notes, and investor presentations. For many, they’re the first step in deciding whether a stock is “cheap” or “expensive.”
But there’s a problem: these numbers are often taken at face value, stripped of the history, context, and psychology that give them meaning.
Used correctly, valuation ratios are a filter, or a way to narrow down opportunities and spot potential risks. Used poorly, they can lead to costly mistakes.
This guide will cover three of the most widely used ratios: Price-to-Earnings (P/E), Price/Earnings-to-Growth (PEG), and Price-to-Sales (P/S). It will also go deeper into their history, their interpretation, and how investor psychology changes what those numbers mean.
The Evolution of Valuation Ratios
Valuation ratios have been around for more than a century, but their meaning has evolved.
Early 1900s: P/E was a banker’s shorthand. Companies with P/E ratios above 15 were often considered “speculative.”
1930s–1950s: Benjamin Graham and David Dodd formalized P/E and book value multiples, tying them to intrinsic value estimates.
1980s–1990s: The growth stock boom saw PEG ratios gain traction, popularized by Peter Lynch as a way to spot growth at a reasonable price.
2000s–Today: P/S ratios became mainstream, especially during periods when tech companies operated with high growth but no profits.
Each ratio rose in prominence during periods when it best fit the market narrative: low P/E in post-war industrials, PEG in tech growth waves, P/S in startup-heavy eras.
Intrinsic Value vs. Market Value
Understanding valuation ratios requires knowing what they measure and what they do not.
Intrinsic Value: An estimate of a company’s true worth based on fundamentals, like discounted cash flows (DCF), asset value, and competitive position. This is a model-driven, forward-looking assessment.
Market Value: The current price investors are willing to pay, as set by supply and demand in the market. This is influenced by fundamentals but also by sentiment, liquidity, and macro conditions.
Valuation ratios tell you about market value relative to certain fundamentals, not the intrinsic value itself.
A stock can have a low P/E and still be overvalued if its intrinsic value is lower than what the market is pricing in.
Fair Value is where intrinsic and market value are in balance.
Ratios help identify possible over- or undervaluation, but they are not substitutes for full valuation models.
1. Price-to-Earnings (P/E) Ratio
Formula:
P/E = Current Share Price ÷ Earnings Per Share (EPS)
The P/E ratio tells you how much investors are paying for each dollar of current earnings. It’s simple, intuitive, and widely available, which is why it’s often the first number people quote when talking about a stock’s valuation.
Interpreting the P/E Ratio
High P/E: Often signals high growth expectations. This can be good if the growth materializes, dangerous if it doesn’t.
Low P/E: May indicate undervaluation or that the market expects weak growth or significant risks.
Example:
Company A is trading at $100 per share with $5 in EPS. Its P/E is 20.
Company B trades at $50 per share with $5 in EPS. Its P/E is 10.
Without more context, B appears cheaper. But if A is growing earnings at 30% annually while B’s earnings are flat, the picture changes.
Pitfalls:
Comparing across sectors: A 20 P/E might be cheap for software but expensive for utilities.
Ignoring one-time earnings impacts: A large gain or loss from an asset sale can distort EPS.
Not adjusting for the cycle: P/E ratios can look artificially low during earnings booms and artificially high during recessions.
2. Price/Earnings-to-Growth (PEG) Ratio
Formula:
PEG = P/E ÷ Expected Annual EPS Growth Rate
The PEG ratio refines the P/E by adding a crucial dimension: growth. By dividing the P/E by the company’s expected growth rate, you get a measure of how expensive the stock is relative to its growth prospects.
Interpreting the PEG Ratio
PEG < 1: Often considered undervalued relative to growth.
PEG ≈ 1: Fairly valued.
PEG > 1: Possibly overvalued for its growth rate.
Example:
Company C has a P/E of 25 and an expected EPS growth rate of 30%. PEG = 0.83. This could indicate a reasonable valuation for a high-growth business.
Company D has a P/E of 25 but a growth rate of just 10%. PEG = 2.5, which may be expensive unless there are other strategic advantages.
Pitfalls:
Reliance on analyst estimates: Growth forecasts can be overly optimistic.
Useless for negative growth: A shrinking company will have a negative PEG, which tells you little.
Short forecast horizons: PEG usually uses a 1- to 5-year growth estimate, which may not capture the full business cycle.
3. Price-to-Sales (P/S) Ratio
Formula:
P/S = Market Capitalization ÷ Total Revenue
(or Share Price ÷ Sales Per Share)
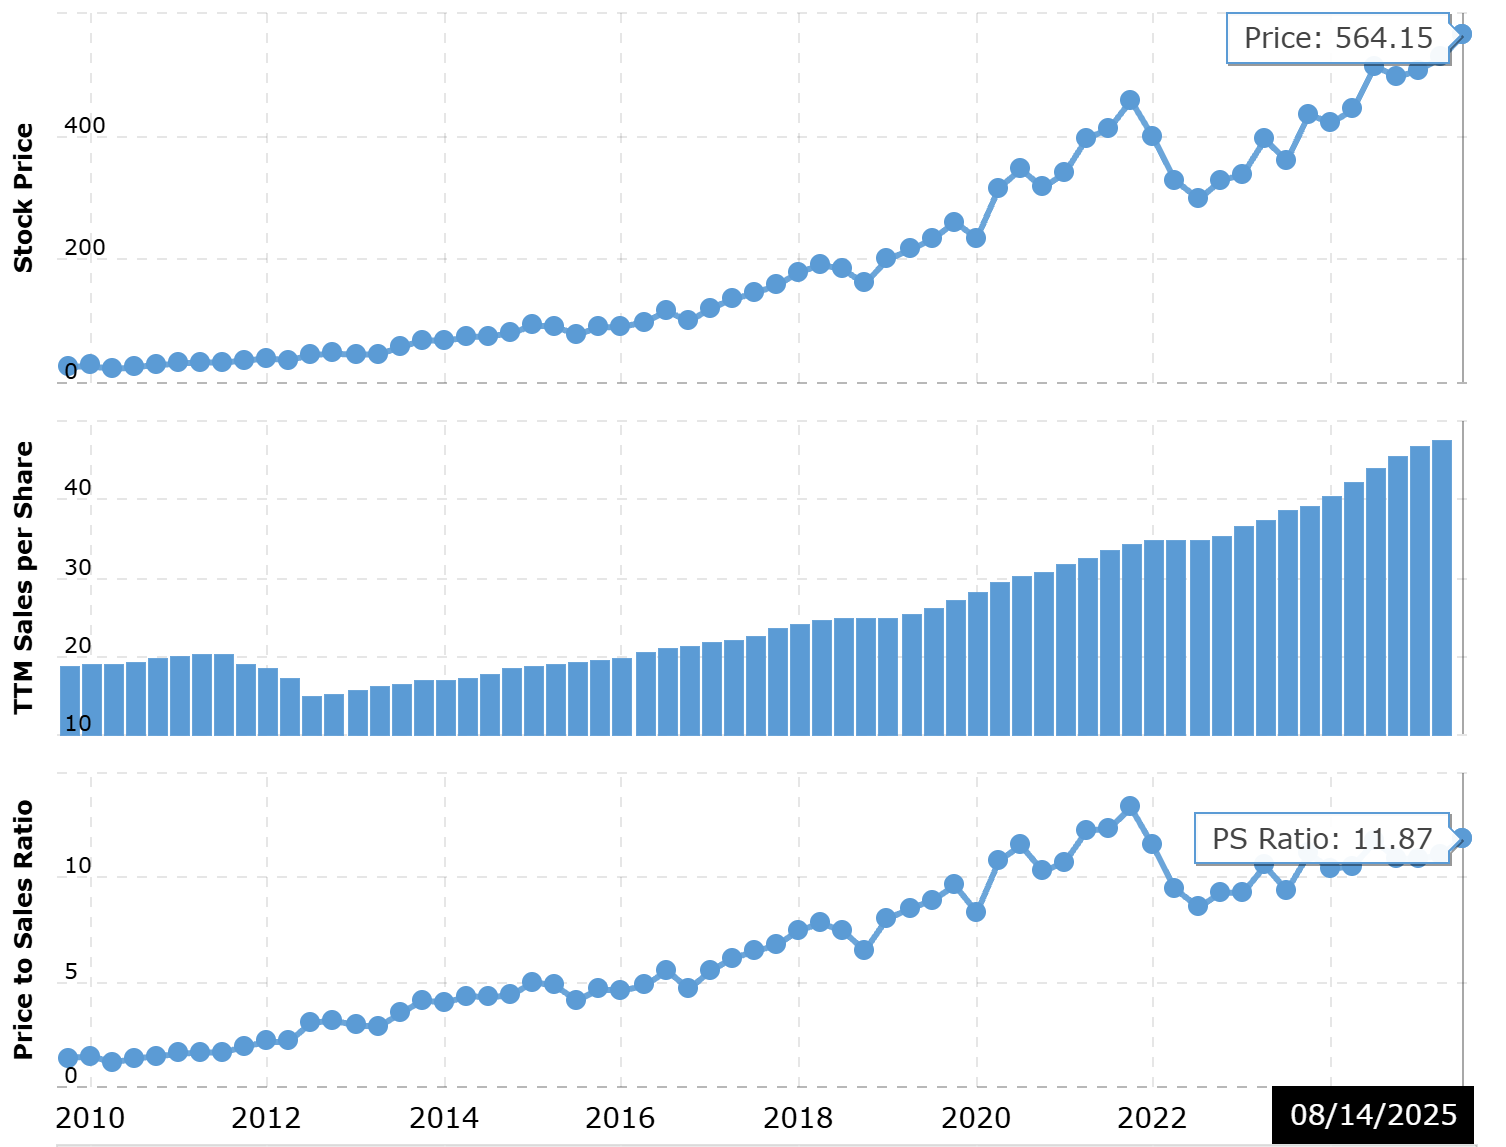
The P/S ratio tells you how much investors are paying for each dollar of revenue. It’s especially useful for companies that are not yet profitable, such as early-stage tech firms.
Interpreting the P/S Ratio
Low P/S: Could mean undervaluation, particularly if margins are improving.
High P/S: Could mean overvaluation unless revenue growth is strong and sustainable.
Example:
A cloud software startup with $200 million in revenue and a $1 billion market cap has a P/S of 5. This might be reasonable if it’s growing revenue at 50% a year with strong gross margins, but expensive if growth is slowing.
Pitfalls:
Different industries have different average margins: A grocery store chain and a software company can have similar P/S ratios but vastly different profit potential.
A low P/S can still be a value trap if sales are declining or margins are thin.
Sector Benchmarks
P/E, PEG, and P/S mean different things depending on the industry. Here are a few sample sector benchmarks for valuation ratios.
Utilities:
Typical P/E: 10–20
Typical P/S: 1–2
Growth: Low and stableTechnology:
Typical P/E: 20–40+
Typical P/S: 5–15+
Growth: HighConsumer Goods:
Typical P/E: 15–25
Typical P/S: 1–4
Growth: ModerateEnergy:
Typical P/E: 8–18
Typical P/S: 0.5–2
Growth: Cyclical
These are rough ranges, and market cycles can push them higher or lower.
For investors looking for credible, up-to-date data on valuation multiples, few resources match the quality and breadth of Aswath Damodaran’s NYU Stern website. Damodaran, often called the “Dean of Valuation,” publishes annual datasets that cover market-wide valuation multiples across sectors and geographies.
His data includes:
Average and median P/E, P/S, EV/EBITDA, and other key ratios
Breakdowns by industry group
Comparisons across global markets
Historical trends to put current valuations in perspective
This information is invaluable for benchmarking individual companies against their peers and understanding how sector norms shift over time. Because it is updated annually and covers both U.S. and international markets, it is a dependable reference point for both professional and retail investors.
You can explore the datasets here: Damodaran’s Current Data Page
Investor Psychology and “What Feels Expensive”
Investor sentiment shifts the boundaries of what’s considered “cheap” or “expensive.”
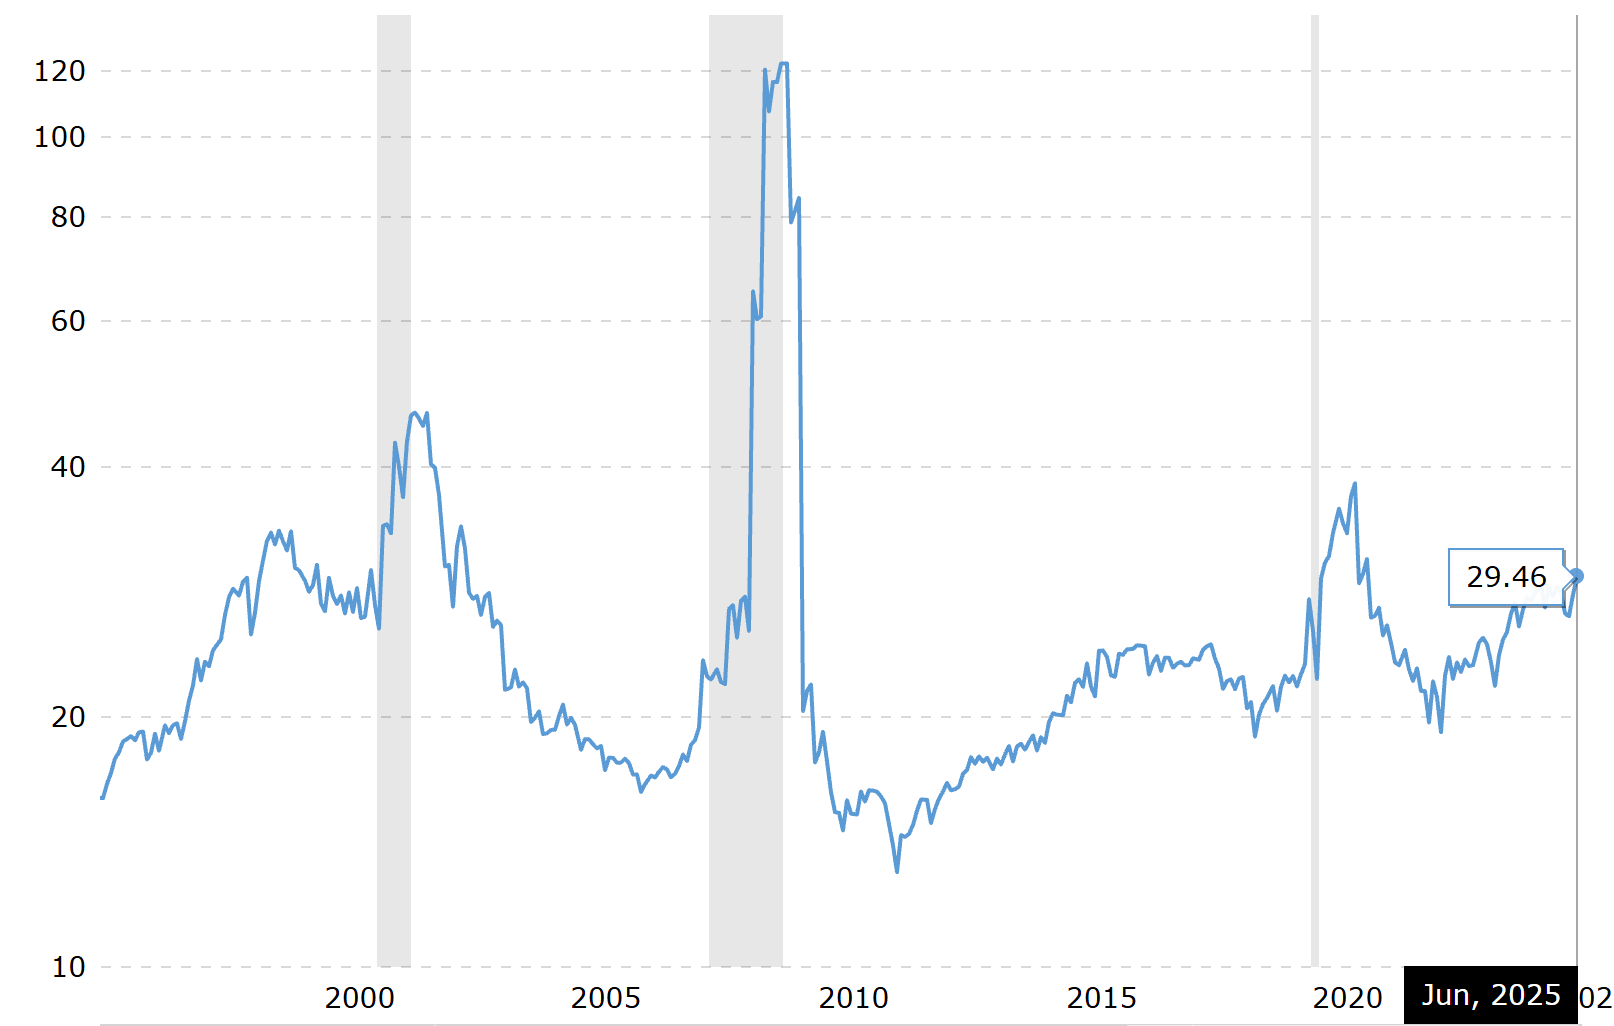
Late Bull Markets: High ratios feel “normal” because everyone expects growth to continue. Tech companies in 1999 traded at P/S ratios above 20 without raising eyebrows.
Bear Markets: Even fair valuations feel expensive because investors are fearful. In 2009, quality companies traded at single-digit P/E ratios and still struggled to attract buyers.
Behavioral finance tells us that anchoring plays a big role. If a stock has historically traded at a P/E of 30, investors may see 20 as “cheap” - even if fundamentals suggest it’s overvalued. Similarly, recency bias leads investors to overemphasize recent performance when judging value.
Behavioral finance is a crucial tool when analyzing market trends and momentum.
Valuation is not purely mathematical, it’s also emotional.
Using Ratios
Ratios are most powerful when used together. For example:
A high P/E with a low PEG can signal growth at a reasonable price.
A low P/S with improving margins can suggest an undervalued turnaround.
A company with a P/E below sector average, a PEG under 1, and stable or rising sales may be a strong candidate for deeper research.
Also, using multiples as part of a process will always increase the probability of a successful conclusion. The best investors use ratios as an entry point. Here’s an example process:
Screen for companies with P/E, PEG, or P/S suggesting possible mispricing.
Check sector norms and adjust expectations.
Evaluate growth drivers, profitability, and competitive position.
Compare market value to intrinsic value estimates.
Factor in sentiment and behavioral context.
Common Misuses of Valuation Ratios
Taking them at face value: Always investigate the underlying earnings or sales quality.
Not adjusting for debt: Two companies with the same P/E can have very different risk profiles if one carries high leverage.
Forgetting macro context: Interest rates, inflation, and economic cycles can all affect what is considered “cheap” or “expensive.”
Final Thoughts
Valuation ratios are essential, but they are only part of the puzzle. They tell you how the market is pricing a company today relative to certain metrics, not what it’s truly worth.
To use them well, you need historical context, an understanding of intrinsic vs. market value, and awareness of how investor psychology can distort what feels “cheap” or “expensive.”
The numbers are objective. The interpretation is where investing skill comes in.
Thank you for reading!