


When a cash machine goes on sale, the reason usually matters more than the discount.
Meta closed at $612.34 on 2026-05-26, down about 5% over the past year. In that same stretch the S&P 500 climbed 26%. That gap is the puzzle, because the business behind the stock just had one of its best years on record. Revenue grew 33.1% YoY in the March quarter to $56.31B, the operating margin held above 40%, and the company threw off $124B of operating cash over the past 12 months. So why is one of the great compounders in the market down while almost everything else is up? In a word, spending.
Meta is pouring tens of billions into AI data centers, and the market hasn’t decided whether that’s a moat being built or a hole being dug. That single question, not the earnings, is what’s pricing the stock right now.

Key Takeaways
Growth reaccelerated. The March quarter put up $56.31B, up 33.1% YoY, at a 40.6% operating margin. This is a $215B-revenue business still growing like a much smaller one.
The earnings power is rare. Operating cash flow was $124B over the past year and return on equity is 33%. Few companies on earth turn revenue into cash like this.
The AI bill is the overhang. Capital spending nearly doubled in fiscal 2025 to about $70B, pushing free cash flow far below the $124B of operating cash flow. That outlay, and its uncertain payoff, is why the stock has lagged.
Valuation has come back to earth. Near 14.2x EV/EBITDA, Meta trades close to the broad market despite growing several times faster. A one-time tax charge muddies the trailing P/E, so EV/EBITDA is the cleaner lens here.
One zone frames the trade. Price is resting on long-term-trend support around $600 to $605. Hold it and the multi-year uptrend is intact. Lose it and the pullback has further to run.
Here’s what the numbers actually say.
META: A Cash Machine That Decided to Spend
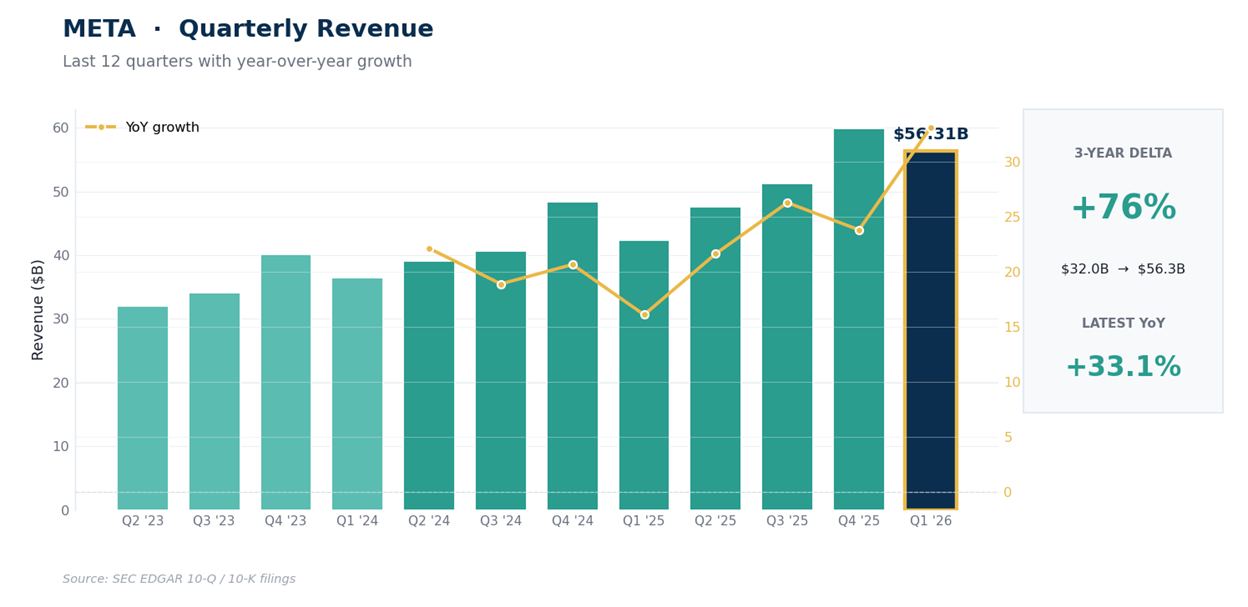
3 years ago Meta looked broken. Fiscal 2022 revenue actually shrank to $116.6B and operating income collapsed to $28.9B as an ad recession met heavy Reality Labs losses. Then came the cuts, the headcount reset, and a hard refocus on the core advertising engine.
The result: fiscal 2025 revenue reached $201.0B and operating income $83.3B, nearly tripling the operating line in 3 years. The March quarter did $56.31B, up 33.1% YoY, at a 40.6% operating margin and an 81.9% gross margin. Net income was $26.77B, up about 61% from a year ago, outpacing revenue because below-the-line items broke favorably, not because margins widened.
This is a business firing on its core, not a turnaround hoping to work.
The spending is the other half of the story, and it’s the half the market is fixated on. Capital spending ran near $19B in the March quarter alone, so the $124B of operating cash flow Meta produced over the past year converts into far less actual free cash.
The bull case is that this capacity powers sharper ad targeting, new AI products, and a durable lead. The bear case is the risk to margins: depreciation from all that hardware lands on the income statement for years, whether or not the revenue shows up to match it. Both can be partly right, and the next several quarters of margin data will settle the argument.
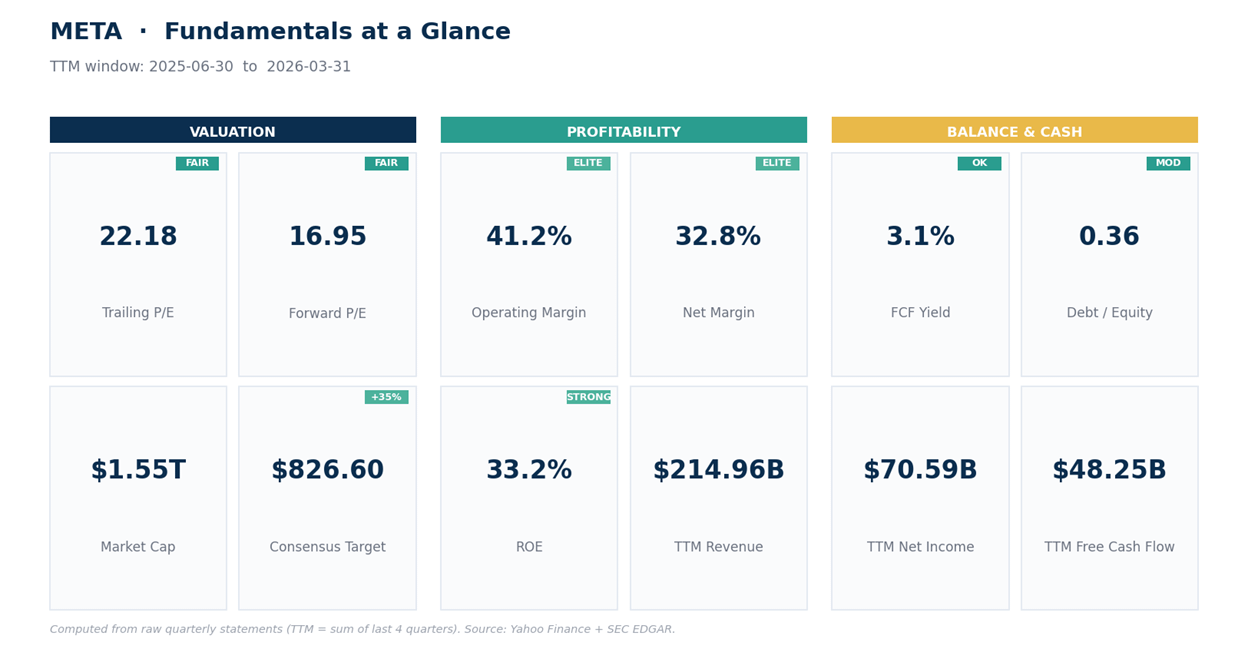
A wrinkle worth knowing here: the September quarter carried a large one-time tax charge that pushed that quarter’s net income down to $2.71B, so trailing earnings understate the real run-rate.
The balance sheet gives Meta room to make this bet, with about $81B in cash against $87B of debt even after the borrowing it added to help fund the build-out.
On valuation the stock isn’t expensive: near 14.5x EV/EBITDA (enterprise value against operating earnings before depreciation) and around 22x trailing earnings, multiples you’d expect on a slower business than this one. EV/EBITDA is probably the cleaner lens right now, since it strips out both the September tax distortion and the depreciation timing on all that new hardware.
For context, the analyst desk is overwhelmingly positive and its lowest published target sits just above today’s price, but that’s supporting color. The spending debate, not the sell-side, is what moves this stock.
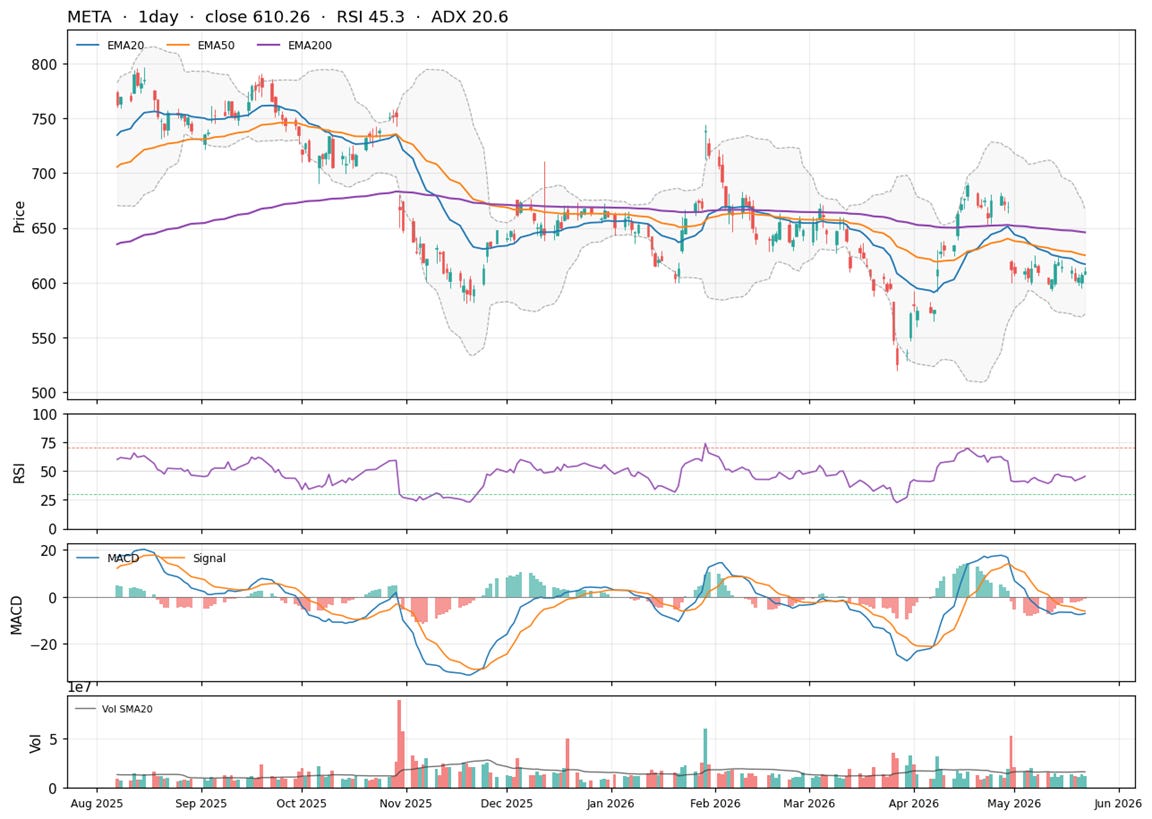
The tape says the market is undecided, not bearish. On the weekly trend Meta pulled back from a high near $796 to $612, but it’s still holding above its 100-week EMA at $598.55 and far above its 200-week EMA at $482.17 (the EMA, or exponential moving average, is a trend line that weights recent prices more), so the multi-year uptrend is intact even after the slide.
Weekly RSI is 46.6, a 0-to-100 momentum gauge sitting in neutral rather than oversold, and weekly ADX is just 12.6, a trend-strength reading so low it signals chop instead of direction. Price is parked just above the 50% retracement of the entire $414-to-$796 run near $605, which is why this zone carries weight.
The daily picture is softer. Price sits below all 4 daily moving averages, stacked in the bearish order that marks a downtrend, with the nearest overhead the daily EMA20 at $616.51 and the EMA50 at $624.55.
Daily MACD, which tracks the spread between a fast and a slow trend average, is mildly negative, so sellers still hold a slight edge. But drop to the 4-hour and a bounce is underway: price has reclaimed the 4-hour EMA20 ($608.43) and EMA50 ($611.30), and 4-hour RSI has crossed back above 50.
Net of the detail, the read is simple: a healthy long-term uptrend on a medium-term pullback, defending real support, momentum neutral and starting to base. First resistance is $617 to $632, then $650. Support is the $600 to $605 shelf, then $560.
Net read: this is a high-quality business on sale over a real and unresolved question about its spending, not because the earnings cracked. Price is holding just above the line that has defined the multi-year uptrend, around $600 to $605, with momentum neutral and the 4-hour turning back up. It isn’t a clean breakout, and it doesn’t need to be chased.
The better move is to let the support zone prove itself, or wait for a reclaim of $632 to confirm the pullback is done. The next print lands Wednesday 2026-07-29, 63 days out, so there’s time to be patient.
Here’s how to act on it.
