


Our Monday piece said Wednesday would turn on the spending guides, and set a checklist for each name. Microsoft cleared the 2 items the market cared about most, Azure at 43% against a 39% to 40% guide and a fiscal 2027 capex frame with the margin-protection framing our checklist required, while leaving backlog concentration unanswered. Meta held its ad metrics and failed the sentence that mattered most: the capex floor moved up, margins fell from 43% to 31%, and EPS missed by $1.04. One stock jumped in late trading. The other fell about 10%.

The spending guides decided both, in opposite directions.
Monday’s piece argued Microsoft and Meta were cheap for the same reason and that Wednesday’s reports would be graded on the bills, not the growth. Microsoft reported the cleaner quarter and rose through the evening session; Meta reported a revenue beat wrapped around a profit miss and fell roughly 10% in late trading.
That drop leaves Meta’s quotes near $527, below the gap-zone we mapped Monday and only dollars above its invalidation. Prices below are based on the July 29, 2026 close ($390.54 Microsoft, $585.61 Meta); results are from both companies’ releases and calls, and this morning’s quotes are still moving.
Key Takeaways
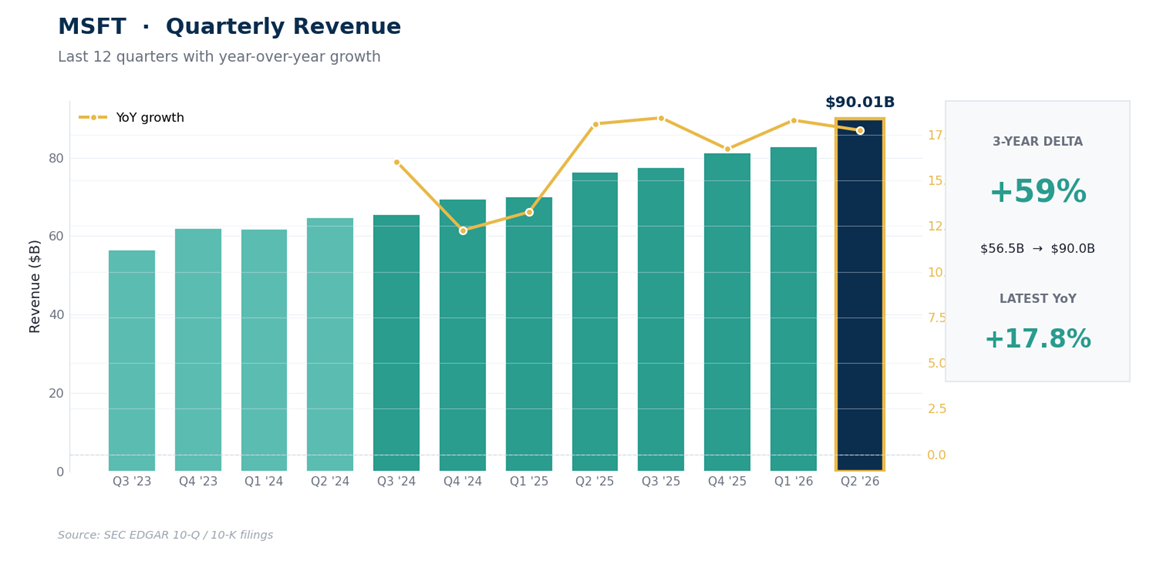
Microsoft: revenue of $90.01B grew 18% (consensus $87.62B), adjusted EPS of $4.74 beat $4.24, Azure grew 43% in constant currency against a 39% to 40% guide, fiscal-year Azure revenue passed $100B, and fiscal 2027 Azure is guided to 45%.
The fiscal 2027 capex number is enormous, $255B to $260B, and the market took it well because of how it was framed: the calendar-2026 envelope held, fiscal 2027 was guided cash-flow positive, and longer server useful lives trim the depreciation bite.
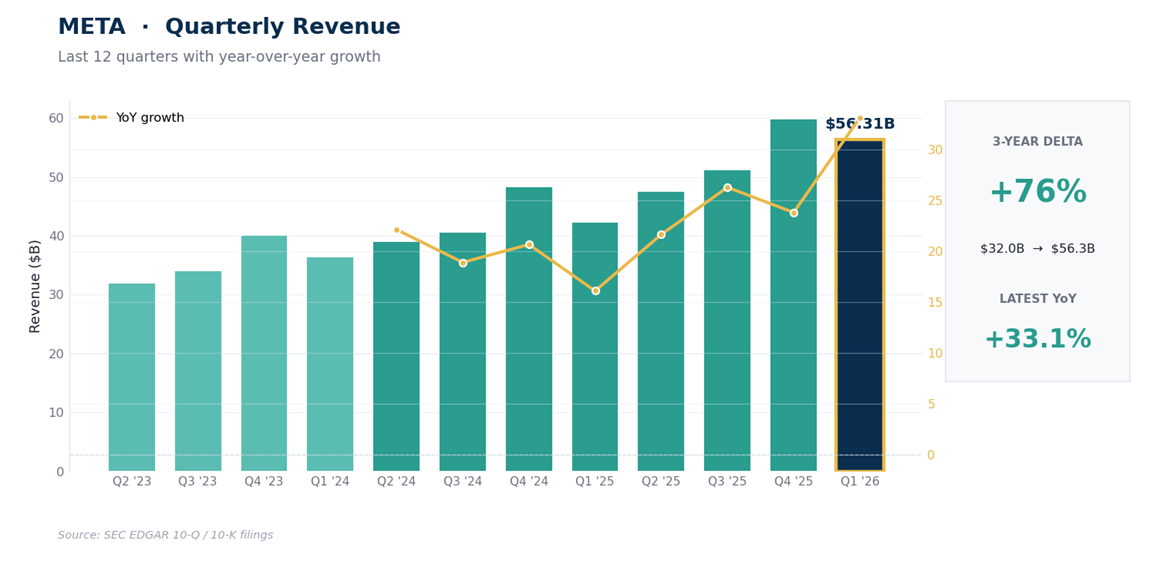
Meta: revenue of $60.80B grew 28% and beat, but diluted EPS of $6.18 missed by $1.04, operating margin fell from 43% to 31%, free cash flow compressed to $784M, and the capex guide’s floor rose to $130B from $125B, the exact sentence our Monday piece said had to stay unchanged.
The frameworks scored honestly: Meta’s prior 594 invalidation fired Monday evening, 2 days before the print, taking disciplined followers out ahead of the drop; Microsoft’s map never forced an exit and its 408 repair line is being tested by this morning’s gap.
The new maps: Microsoft pullback zone 405 to 412, invalidation 389, breakout 425, references 452 and 466. Meta decision zone 520 to 530, invalidation 518, repair 555, references 586, 614, and 631.
The Checklist Audit
Monday’s piece reduced each report to a short list, so let’s score the lists. Microsoft needed 3 things: Azure at or above its 39% to 40% guide, a fiscal 2027 capex frame with margin-protection language, and progress diversifying the backlog beyond OpenAI.
It delivered the first emphatically, at 43%, with next fiscal year guided to 45% against consensus near 41%. It delivered the second in the way that mattered: $255B to $260B is a staggering number, but the 2026 envelope didn’t move, the year was guided cash-flow positive, and the accounting commentary about longer useful lives addressed depreciation directly. The third went largely unanswered, and it remains the open risk in the story. That’s 2 of 3, cleared decisively, and the market paid for it.
Meta needed 2 things: ad metrics holding, and the $125B to $145B capex range surviving the call intact. The first passed cleanly, impressions up 14%, pricing up 12%, 3.60B daily users. The second failed: the floor moved to $130B. What the checklist couldn’t anticipate was how much of the spending had already reached the income statement: operating margin fell 12 points, Reality Labs lost $4.62B, free cash flow all but vanished at $784M, and EPS of $6.18 missed consensus by $1.04 despite the revenue beat.
The third-quarter revenue guide of $61B to $64B, whose $62.5B midpoint sits below the $63.15B consensus, finished the job. One sentence failed, and everything downstream of it followed.
Microsoft: What 43% Azure Buys
The quarter itself deserves its numbers stated once, and they’re worth staring at. Revenue of $90.01B grew 18% at a $360B run rate, Azure’s 43% constant-currency growth beat the guide by 3-plus points, and Intelligent Cloud grew 31.6%.
One asterisk before trusting the GAAP line: net income of $35.77B, or $4.81 a share, includes a $3.2B gain on Microsoft’s Anthropic stake, so the $4.74 adjusted figure is the operative one. Quarterly capex and finance leases ran $41B, up 69%, and the fiscal 2027 total of $255B to $260B will dominate the debate for the next year.
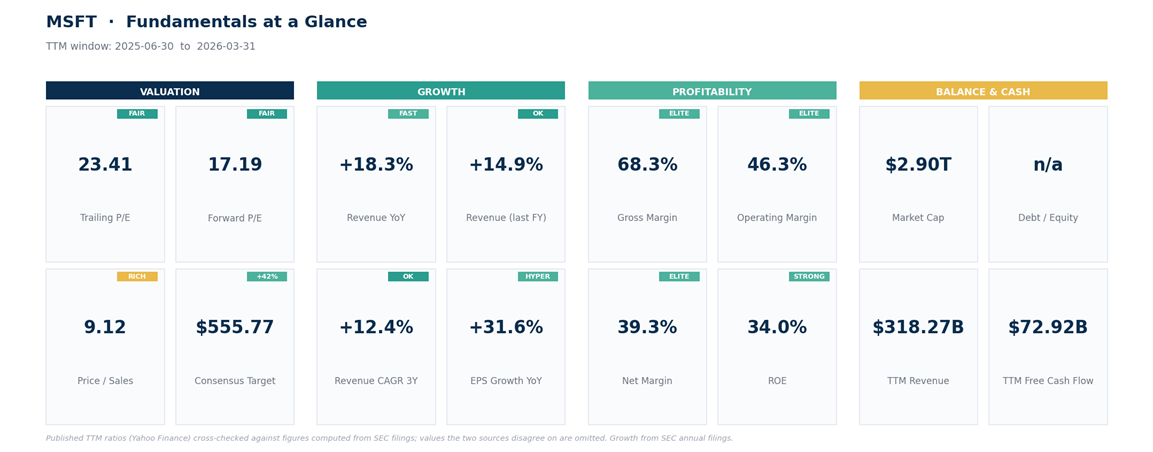
What Monday’s discount didn’t survive was the combination the market actually got: acceleration in the business that justifies the spending, plus a spending frame that protects margins and cash flow while it happens. At Wednesday’s $390.54 close the stock traded near 17.2x next-fiscal-year consensus earnings (the same consensus-feed basis we’ve used all season); the evening’s gap points at our old 408 repair line and the 422 area where the 200-day average and the June-break retracement stack within a dollar.
The Microsoft Map
One possible framework, not a promise, and every trigger below means a daily close, so nothing fires before tonight.
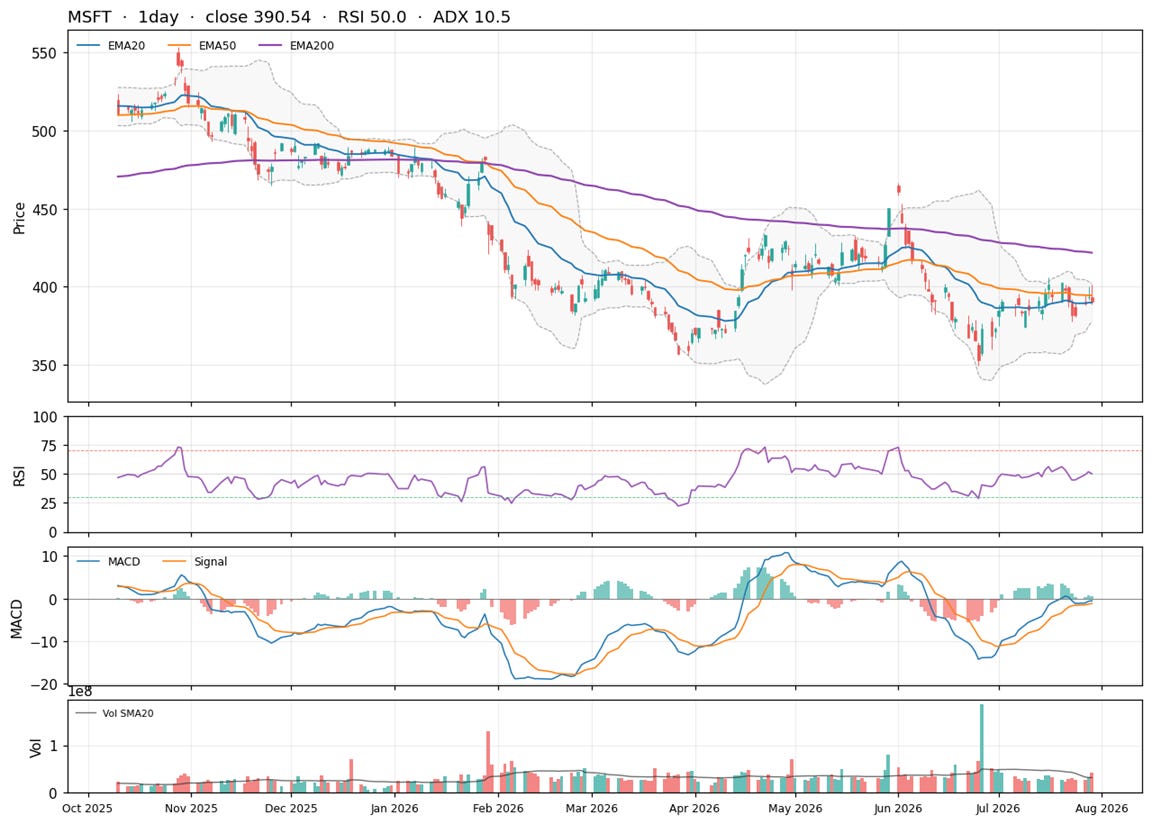
Pullback zone: 405 to 412, the old repair line (408), the halfway retracement of the June break ($407.76), and the 100-day average just beneath. A gap that retests this zone and holds converts the reaction into a base above the old range.
Invalidation: a daily close below 389, back under the pre-earnings close. That would mean the market fully unwound the report’s verdict, which after numbers like these would itself be new information.
Breakout: a daily close above 425 clears the 200-day average ($421.72) and the 38.2% retracement ($421.58), stacked within a dollar, with references at 452 (the halfway mark of the whole spring decline) and 466 (the June high).
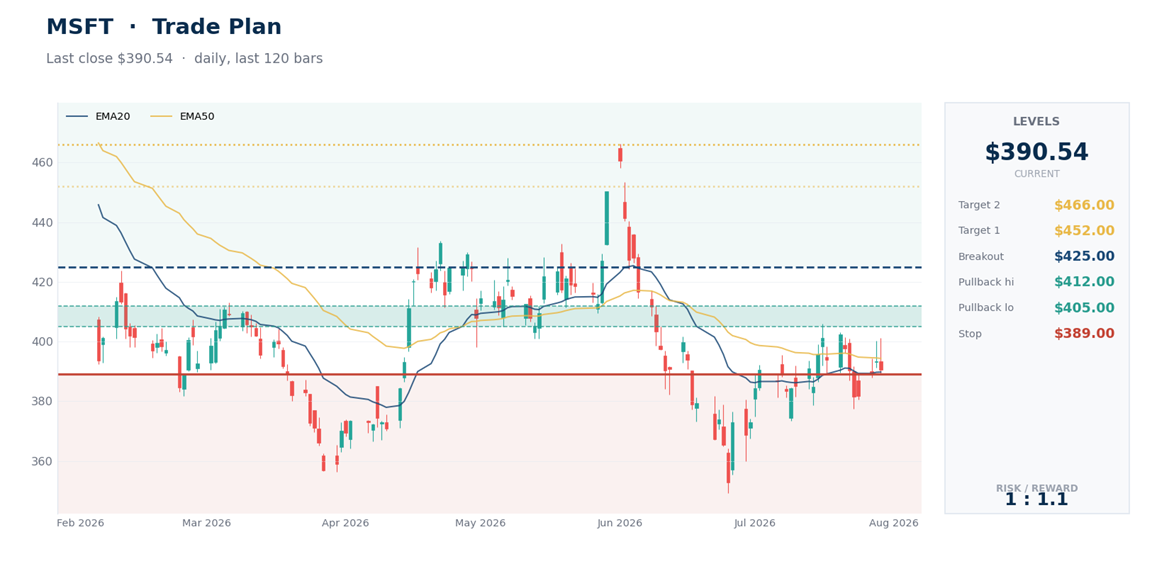
For fresh capital (illustrative): a fill near 408 against the 389 line risks about 4.7%; size so a larger gap stays inside your portfolio risk budget. Chasing above 422 before a close confirms it pays a worse price for the same information.
Meta: The Floor Moved, and the Costs Arrived Early
Meta’s report needs separating into halves. The advertising machine is fine: 28% revenue growth, double-digit gains in both impressions and pricing, and Family of Apps operating income of $23.39B. What broke was everything the spending touches. Total operating margin fell from 43% to 31% in a year, dragged by depreciation from prior capex, Superintelligence-era compensation, and a Reality Labs loss of $4.62B.
Free cash flow compressed to $784M against $31.08B of quarterly capex: the buildout absorbed nearly all the cash the business generated. And the guide moved the wrong way: the capex floor rose $5B, with 2027 already signaled higher. The result was the rare print that beats on revenue and still counts as a miss, because the $6.18 of EPS fell $1.04 short and the market’s entire question this season has been about spending conversion, not demand.
The frameworks handled it. The July 19 invalidation at 594, which Monday’s piece kept as the governing line for existing positions, fired that same evening at $593.87 and stayed fired Tuesday and Wednesday; anyone following it was out before the report.
The 540 to 555 gap-zone we drew for a bad reaction has already been overshot by the late-session quotes near $527, which leaves this morning’s open between the 52-week low at $520.26 and the old zone floor, with the 518 invalidation dollars away.
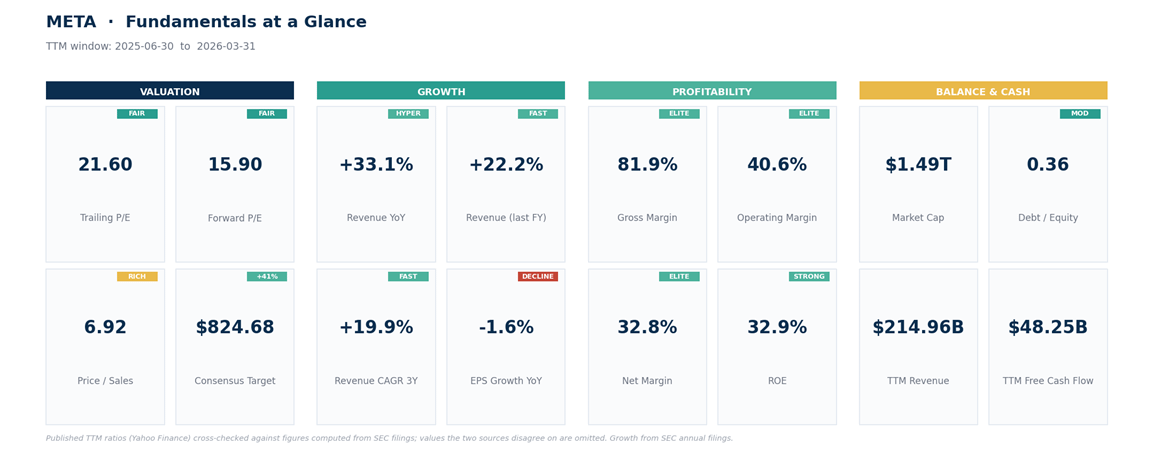
At Wednesday’s close Meta traded near 15.9x next-year consensus earnings, on the same feed basis as Microsoft’s multiple above; if the late quotes hold, this morning it opens closer to 14x, the cheapest large-cap AI franchise on the board, for the now-familiar reason.
The Meta Map
Same rules: one possible framework, not a promise, and every trigger is a daily close on a reaction day with wide gaps.
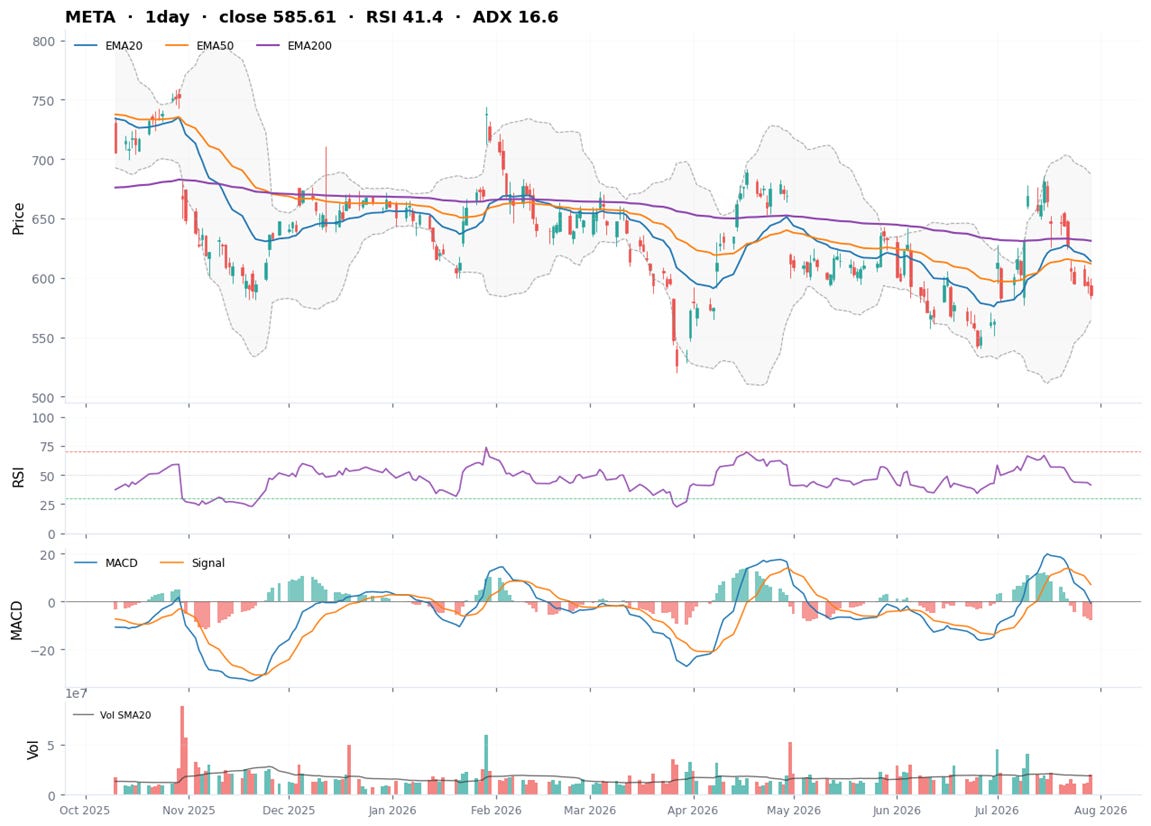
Decision zone: 520 to 530, the 52-week low ($520.26) and the area where the late-session quotes landed. This is where the market decides whether a 14x-forward Meta is a gift or a trap.
Invalidation: a daily close below 518, unchanged from Monday’s piece. Below the 52-week low, the 2-year uptrend structure is finished and no multiple argument overrides that.
Repair: a daily close back above 555 reclaims the old gap-zone in full, with references at 586 (the pre-report close area and the 61.8% retracement at $585.68), 614 (the 20-day and 50-day cluster), and 631 (the 200-day average).
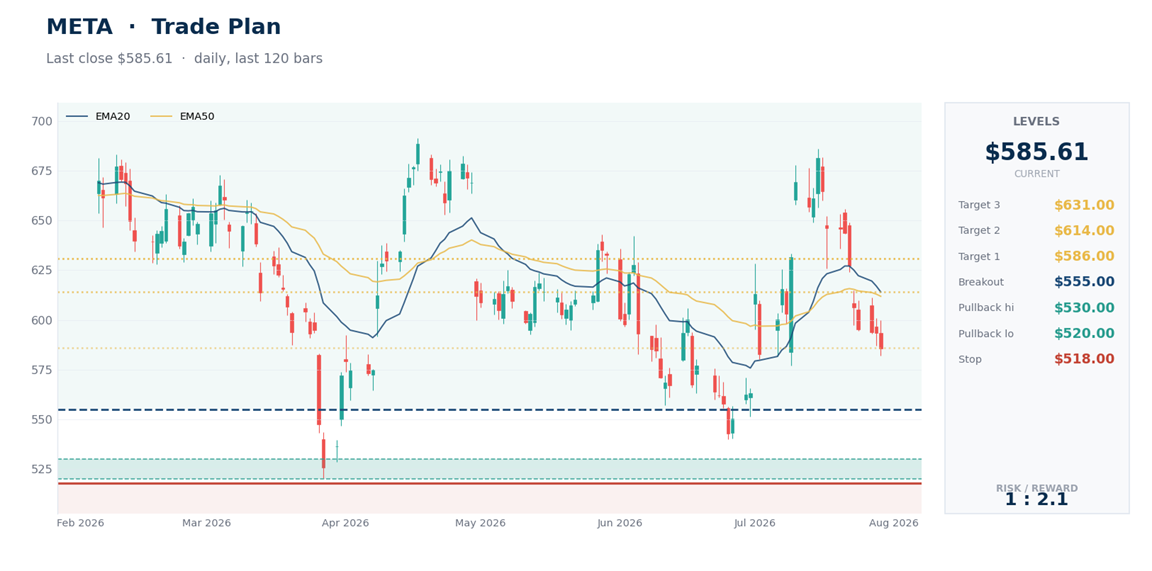
For fresh capital (illustrative): this is a falling knife with a nearby floor, the hardest setup to trade well. The disciplined version waits for either a daily close that holds 520 to 530, or the 555 repair; a fill near 525 against the 518 line risks under 2% on paper, but a name that just gapped 10% can gap through 518 as easily, so size for a 10% adverse move, not 2%.
Bottom Line
It’s now 3 prints telling the same story in 8 days: Alphabet fell on a raised bill, Microsoft rose on a contained one, and Meta fell on a floor that moved. The market’s rule this season is consistent, and it isn’t about demand: spending discipline gets paid, open-ended spending gets charged, and the quarter’s operating numbers mostly decide how violently.
For Microsoft, the cheap thesis from Monday is resolving upward through the old repair line, with 405 to 412 now the zone that matters. For Meta, the discount got deeper and the question got harder: the ad machine is untouched, the multiple is nearing 14x, and the stock is sitting on its last mapped line. We’d rather let 518 or 555 answer that than guess at it today.
This is research and commentary, not personal investment advice. Levels and trade plans are illustrative; size positions to your own risk tolerance and time horizon. The author may hold positions in names discussed.
Metas margins were compressed because of one off expenses like legal fees and the severance payout. Without that, their operating income would’ve grown 9% y/y. While ofc some aspects of metas earnings were not as impressive, the pre market movement is more an opportunity.
I’m long both MSFT and META