
Nebius vs CoreWeave: Owning The AI Plumbing Without Blowing Yourself Up
Two neocloud darlings, tens of billions in contracts, and balance sheets that can either compound or crater your capital.

AI needs power and GPUs. You’re deciding whether to own the landlords.
If you think of AI as a gold rush, Nebius NBIS 0.00%↑ and CoreWeave CRWV 0.00%↑ are not selling apps. They are selling shovels, land, and power lines.
Both are “neocloud” providers: GPU heavy data centers, wired and tuned for model training and inference, rented out mostly to hyperscalers and big AI labs. They are posting triple digit growth, signing multi billion dollar contracts with Microsoft, Meta, OpenAI and Nvidia, and burning enormous amounts of cash to build capacity.
On paper, it looks simple: massive demand, high gross margins, long dated contracts. In practice, you’re underwriting highly levered, project finance style stories where execution, funding conditions and a few customers matter more than any spreadsheet.
This note is for medium to long term investors trying to answer a basic question:
Do you really want to own this kind of risk, and if yes, how do you size and time it without being reckless?
Key takeaways
Both Nebius and CoreWeave are real businesses with very strong demand signals and huge signed contracts. They are not “hope and slide deck” stories.
Nebius is earlier in its revenue ramp, with 70 percent plus gross margins and two mega deals: 17.4–19.4 billion with Microsoft and 3 billion with Meta over five years.
CoreWeave is larger today: about 1.36 billion in Q3 revenue, 55.6 billion in backlog and 5.05–5.15 billion revenue guided for 2025.
Both are deeply capital intensive and either already highly levered (CoreWeave) or moving that way (Nebius). They rely on ongoing access to equity and debt markets.
Technically, $NBIS looks like a strong primary uptrend that just had a violent wave 2 style reset and is trying to turn back up. $CRWV looks like a mature downtrend in early relief bounce.
For a typical investor, this is “satellite position only” territory. Think small allocation, staged entries, very clear risk lines, and be emotionally ready for 40 to 60 percent drawdowns.
If you dislike funding risk, customer concentration and big swings, it’s perfectly rational to watch these from the sidelines and express the AI theme elsewhere.
What these businesses actually are
Nebius
Nebius is the rebranded non Russian piece of the old Yandex NV, now focused almost entirely on AI infrastructure. It runs GPU dense data centers and a cloud software stack that lets customers train and deploy models, plus a few non core assets like Avride (autonomous driving), TripleTen (edtech) and stakes in ClickHouse and Toloka.
Roughly 90 percent of its revenue already comes from AI infrastructure. The rest is nice optionality, not the core of the story.
CoreWeave
CoreWeave started life as a crypto miner, then turned its GPU footprint into a pure AI cloud platform. It now runs 30 plus data centers with roughly 250k GPUs, renting capacity to AI labs, hyperscalers and enterprises, and layering on software (Weights & Biases, OpenPipe, etc) to move up the stack.
Its pitch is simple: “The essential cloud for AI” with highly optimized Nvidia clusters that can be faster and easier to consume than generic hyperscaler instances.
So in both cases, you’re buying AI plumbing, not AI models.
Pipelines, contracts and build plans
This is where both names get interesting, and dangerous.
Nebius: mega deals, early scale
Q3 2025 revenue: 146.1 million, up 355 percent year over year and 39 percent quarter over quarter.
Annualized run rate revenue exiting Q3: about 551 million.
2025 ARR target: 900 million to 1.1 billion. 2026 target: 7 to 9 billion ARR.
Anchor contracts:
Microsoft: 17.4 billion over five years, with options that take it to 19.4 billion. Capacity comes largely from the 300 MW Vineland, New Jersey data center.
Meta: 3 billion over five years, announced with Q3 results as the second hyperscaler deal. Demand was strong enough that Nebius capped the contract based on available capacity.
Capex and build:
Q3 capex: about 955 million, up sharply as Nebius buys GPUs, land and power.
2025 capex guidance lifted to around 5 billion to fund data centers in New Jersey, Kansas City, Iceland, Finland and France.
The pipeline is clear: pre sell capacity to hyperscalers, raise capital, stand up gigawatt class data centers, then ramp ARR into 2026.
CoreWeave: bigger backlog, more moving parts
Q3 2025 revenue: about 1.36 billion, up 134 percent year over year.
Revenue backlog: 55.6 billion at quarter end, almost double from the prior quarter.
2025 revenue guidance: 5.05 to 5.15 billion after a small cut driven by a delayed third party data center shell.
Key contracts:
OpenAI: total contract value up to about 22.4 billion across multiple agreements to power next gen models.
Meta: multi year deal worth 14 billion plus to supply AI infrastructure.
Nvidia: 6.3 billion capacity backstop through 2032, where Nvidia must buy unsold capacity.
Capex and build:
2025 capex guided to 12 to 14 billion after being trimmed from 20 to 23 billion, largely because of timing shifts into 2026.
CoreWeave is further along the same path: huge backlog, huge capex, and very visible demand, but also more leverage and more operational complexity.
Nebius is the up and comer with two huge anchors. CoreWeave is already operating like a global AI utility.
Fundamentals
Nebius fundamentals
What’s working:
Growth is explosive. Revenue is up more than 4x year on year and the core AI infrastructure segment is already profitable on an adjusted EBITDA basis.
Gross margins in the core infra business are around 70 percent, which is elite for something that looks like “infrastructure”.
The Microsoft and Meta deals lock in more than 20 billion of multi year demand, far above current scale.
What hurts:
Q3 GAAP net loss from continuing operations was about 119.6 million. Adjusted net loss was around 100 million.
Operating cash flow was negative and capex near 1 billion in the quarter. Levered free cash flow is deeply negative.
To fund this, Nebius is using a mix of debt, convertibles and fresh equity, including a 3 billion package in September and an at the market program for up to 25 million new Class A shares.
You are buying extremely high growth and strong unit economics, funded by aggressive capex and ongoing dilution. The business looks good. The equity behaves like long dated, leveraged call options on AI infrastructure demand.
CoreWeave fundamentals
What’s working:
Q3 revenue of about 1.36 billion, more than double last year, and adjusted EBITDA of roughly 838 million with a 61 percent margin.
Backlog of 55.6 billion, which is roughly 10 to 11 times one year of guided revenue. That is strong visibility by any standard.
Mega deals with OpenAI, Meta and Nvidia signal CoreWeave’s relevance at the top of the AI stack.
What hurts:
GAAP operating income in Q3 was only about 52 million. Net loss was around 110 million, thanks mostly to more than 310 million in net interest expense in the quarter.
Net debt is very high relative to equity and even relative to adjusted profitability. Annual interest is guided around 1.21 to 1.25 billion, which is larger than expected adjusted operating income for 2025.
2025 revenue guidance was trimmed slightly because a third party data center developer fell behind schedule. Contract value is intact but it exposed execution risk and the stock sold off on the news.
The business has scale, backlog and margins that most companies dream of, but the capital structure is heavy. You are underwriting management’s ability to execute multi billion dollar builds, keep borrowing costs under control and avoid any serious customer or project problems.
Fundamental big picture
Both names share the same core trade off:
Very strong demand and visibility, high gross margins, multi year contracts.
Very heavy capex, negative free cash flow and reliance on debt and equity markets.
If you like simple, self funded, low leverage compounders, neither fits that profile. If you are comfortable with project finance style risk in exchange for upside tied to AI infrastructure, they become interesting but position sizing is everything.
These are not “forget in a drawer for 10 years” names. They are “monitor closely” names.
Technical picture: what the charts are actually saying
Nebius
Big picture (weekly):
Strong primary uptrend from roughly 20 into the 140 area during 2025.
Price corrected into the 70s, then bounced back toward the high 90s.
Weekly EMAs are still bullishly stacked and price has reclaimed the 20 week EMA, which is typical of a violent but healthy reset rather than a completed long term top.
Weekly RSI cooled from overbought into the mid 50s and stochastics are lifting from low levels, which often marks the early stage of a new swing up.
Structure and Fib framework:
The move from roughly 18 to 140 looks like a completed higher degree wave 1 on the Elliott count.
The drop into the low 70s retraced about 50 to 62 percent of that move and held above the big prior wave 4 area in the 60s. That is classic wave 2 territory.
On the big weekly Fib, 0.382 sits around the low to mid 90s and 0.618 in the mid 60s. Price has already tested the “golden pocket” around 65 to 70 and is now back above 0.382.
Shorter time frames:
Daily: price has reclaimed the 20 day EMA around the high 90s and is challenging the 50 day near 100. MACD has turned up from deeply negative and RSI is back around neutral, which lines up with “early phase of a new upswing”.
Four hour: price is pressing into a dense 97 to 100 resistance band with overbought stochastics, so a pause or pullback here would be normal inside a larger recovery attempt.
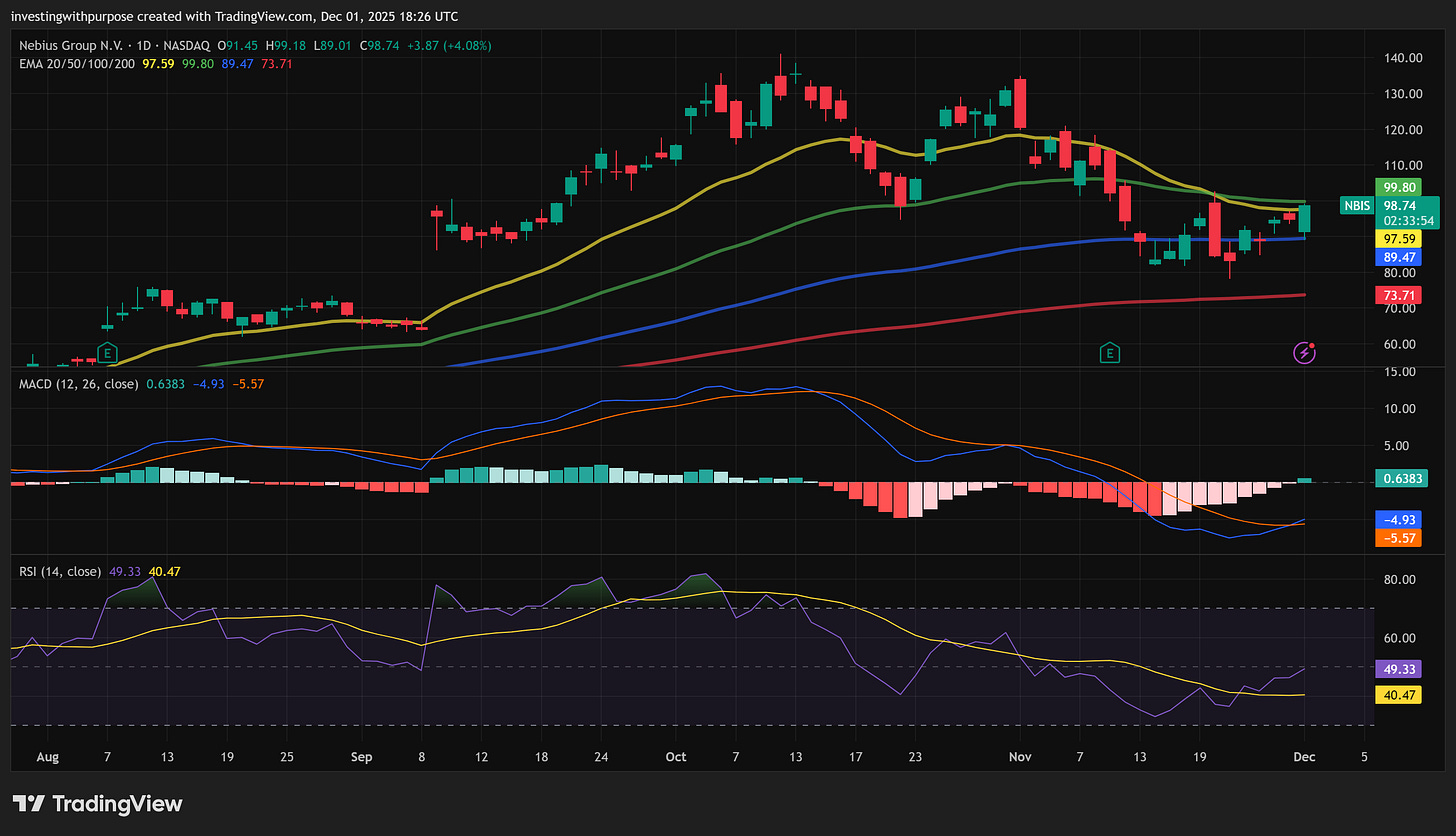
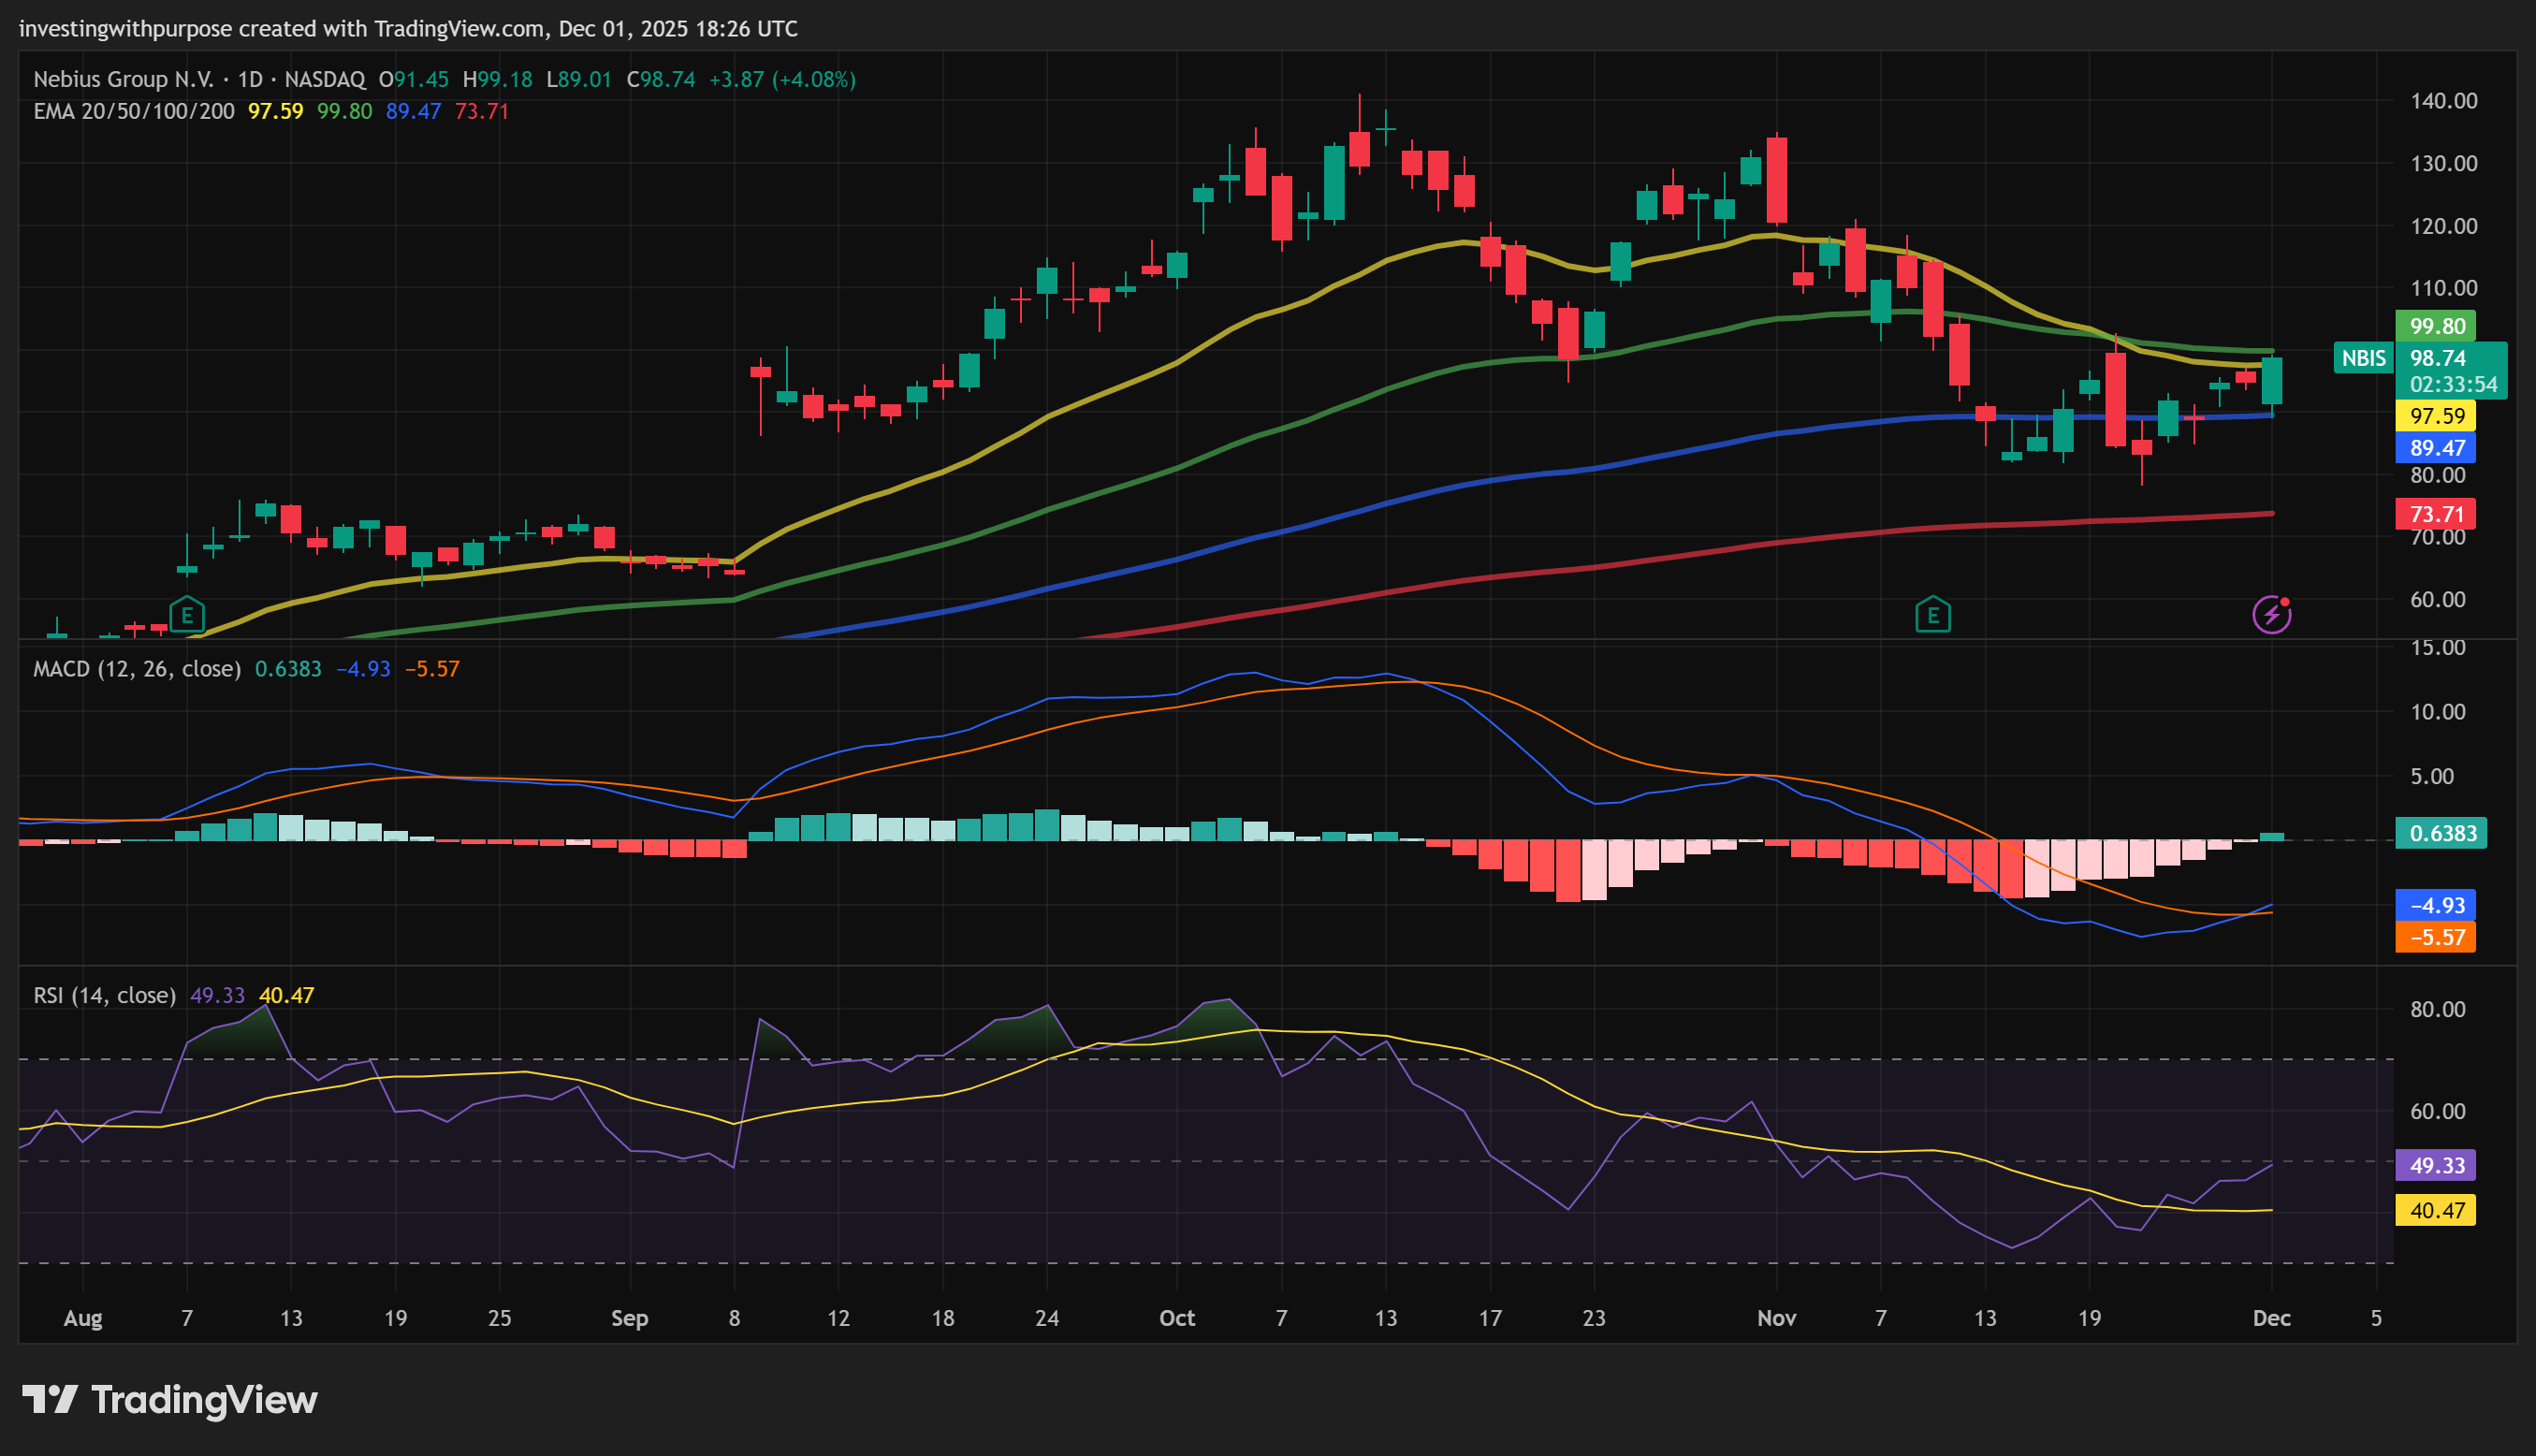
Key zones to care about:
First support: 97 to 98. Lose that and you probably retest 90 to 92.
Major support: 90 to 92. This clusters the 100 day EMA and a key Fib level. A higher low here keeps the bullish interpretation clean.
Deeper “do not want” zone: 77 to 80, then 65 to 70. A decisive break of the mid 60s would seriously damage the bullish wave structure.
Upside pivots:
99 to 102: first real decision area for the daily trend.
109 to 115: where Fib extensions, cloud resistance and prior congestion meet.
120 to 125: prior local highs.
134 to 141: the old top.
The chart currently supports “bull market, big wave 2 correction likely completed, now trying to build a new leg higher”. That case survives as long as pullbacks hold roughly 90 and especially 80. Below the mid 70s the story changes.
CoreWeave
Big picture (weekly and daily):
After the IPO run into the 180s, price has been in a clear downtrend, with a swing low in the mid 60s and a bounce into the 70s.
On the big Fib leg, price has already retraced around 78.6 percent of the prior advance and is sitting just above that zone, which is “deep but not broken beyond repair”.
Weekly stochastics are extremely oversold, which usually precedes a bigger bounce, but trend is still down.
Daily structure and Fibs:
The downtrend leg into 65 looks like a completed wave 3 on the Elliott count, with multiple Fib extensions clustering in the high 70s and low 80s.
From that low, a bounce toward 83 to 95 would be a classic wave 4 retrace, as long as price stays below roughly 95 to 100.
Daily Fibs put:
0.236 around low 80s.
0.382 around mid 90s.
0.618 and 0.786 up in the 112 to 125 area, which would be a much deeper mean reversion.
Trend filters:
On the daily, price is still below the 20, 50, 100 and 200 day EMAs. All are sloping down. This is what a mature downtrend looks like.
Ichimoku: price is below the cloud, above the Tenkan, below the Kijun. The cloud itself sits roughly 100 to 110 for now. That is textbook “bearish trend with a corrective bounce”.
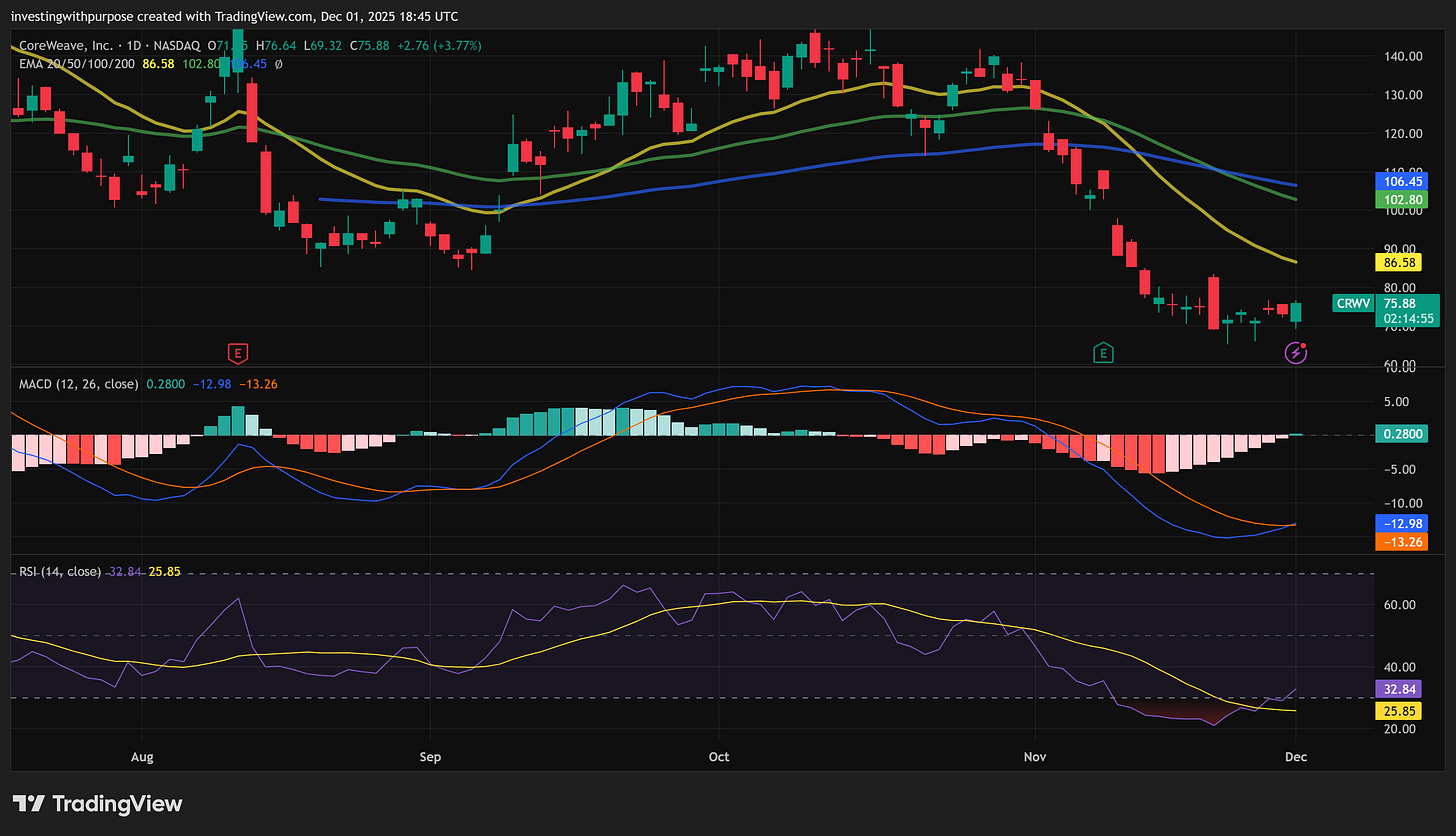

Key zones to care about:
Structural support: 65 to 72. Lose this area with conviction and you open a path toward Fib extensions down in the 40s.
First resistance:
77 to 78: short term EMA band where intraday traders will fade.
83 to 88: daily 0.236 plus 20 day EMA and mid Bollinger band.
Major inflection: 94 to around 100. That is where the 0.382 retrace, daily 50 day EMA and prior shelves come together.
If bulls somehow push into 112 to 125 and hold, you would have to seriously question the “five wave down” view and think in terms of a larger corrective structure instead.
The chart currently says “primary downtrend, early relief bounce from deeply oversold”. There is room for a bigger counter trend rally, but until price reclaims at least the low 90s and then 100 plus, any bounce is guilty until proven innocent.
Technically: Nebius is in repair mode after a big reset. CoreWeave is still in damage control after a big run and reversal.
A simple, risk aware way to approach these names
Nebius (NBIS): tradable with clear risk lines. Uptrend intact on higher timeframes. Wave-2 style reset likely finished in the 70s. Trying to turn higher.
1. Preferred Pullback Long
Entry: 90–92
Stop: 82–83
Targets:
T1: 102–105
T2: 112–115
T3: 120–125
Why this works:
90–92 is your strongest support cluster (Fib + 100-day EMA). Holding it keeps the bigger bullish structure alive.
Risk is about 8 points; upside is 12–30+.
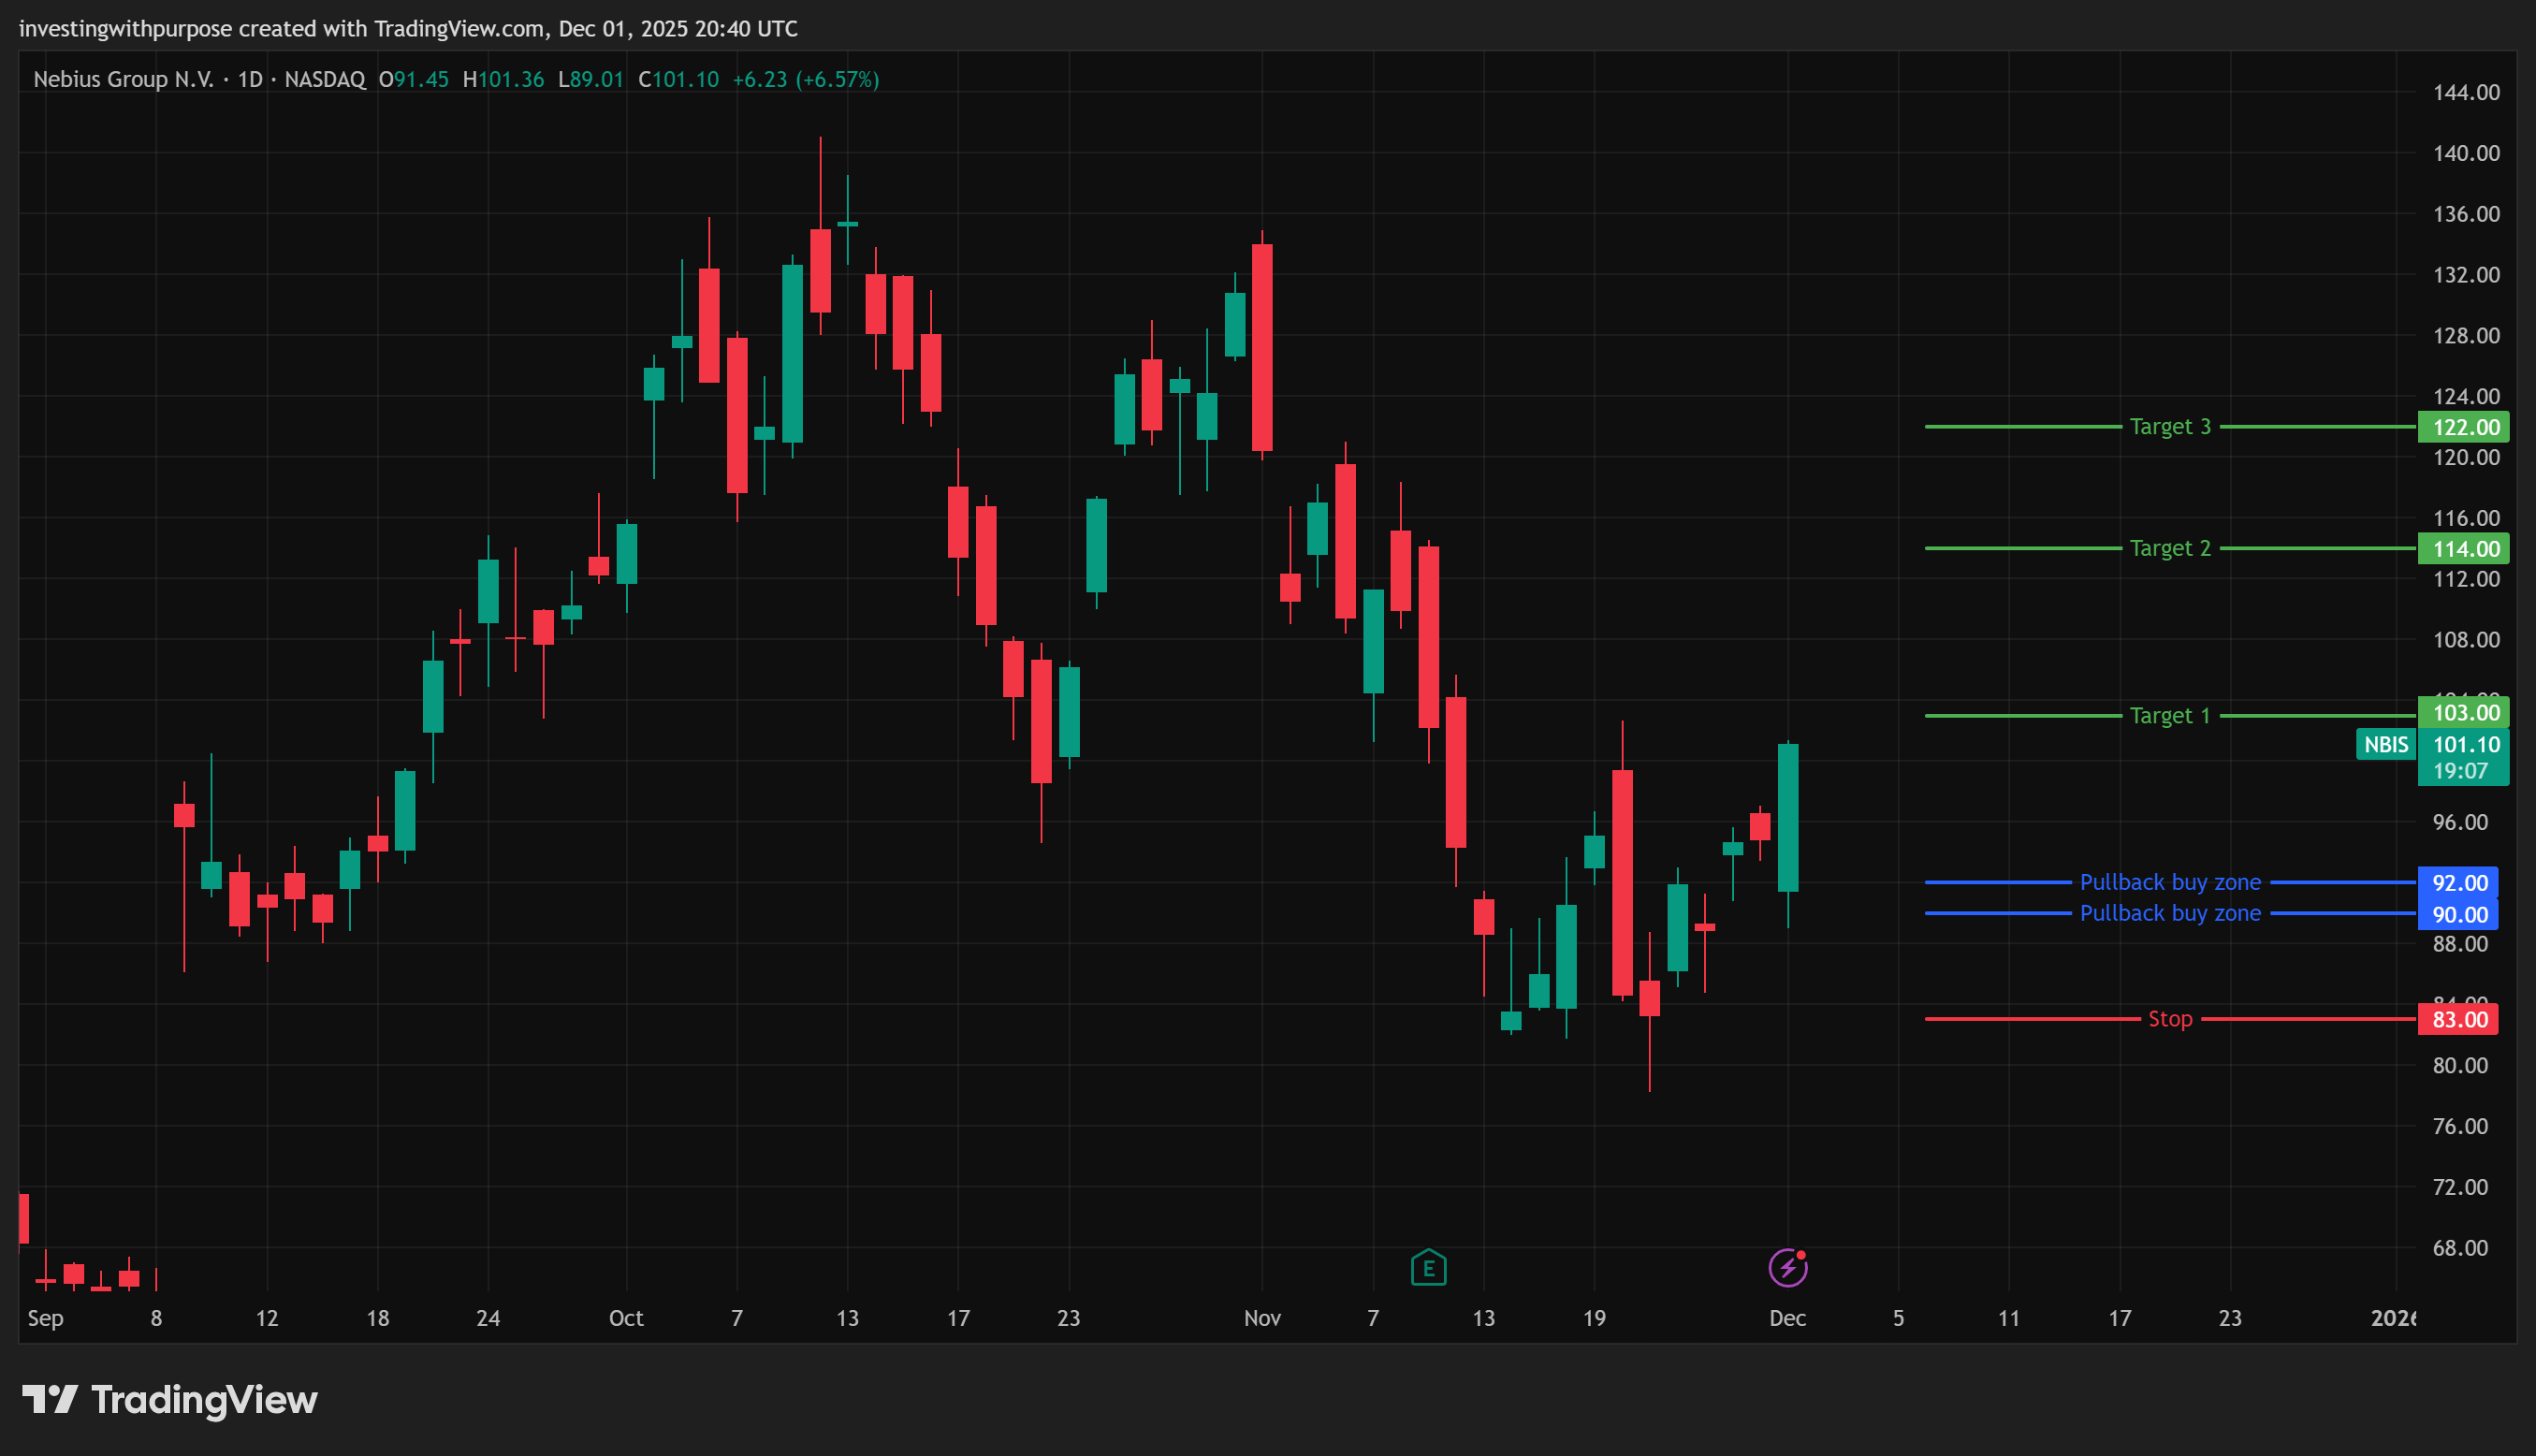
2. Breakout Long (safer, later)
Trigger: Daily close above 102
Entry: 103–106 on a retest
Stop: 96–97
Targets:
T1: 115
T2: 125
T3: 135–140 (ATH retest)
Why this works:
You let the trend confirm itself. You’re buying strength, not guessing bottoms.
When NOT to touch NBIS
If price loses 90 and can’t reclaim it.
If price loses 80, the bullish wave structure is probably wrong.
Below 75, it becomes a watch-only name until a new base forms.
CoreWeave (CRWV): wait unless you want high stress
Primary downtrend. Oversold bounce → yes. True reversal → not yet.
Medium-long term investors should be patient.
1. Strength-Only Long (the only clean setup)
Trigger: Daily close above 90–95
Entry: 92–98
Stop: 80–82
Targets:
T1: 105–110
T2: 120–125
Why this works: You avoid catching knives. You only buy once the daily trend actually flips.
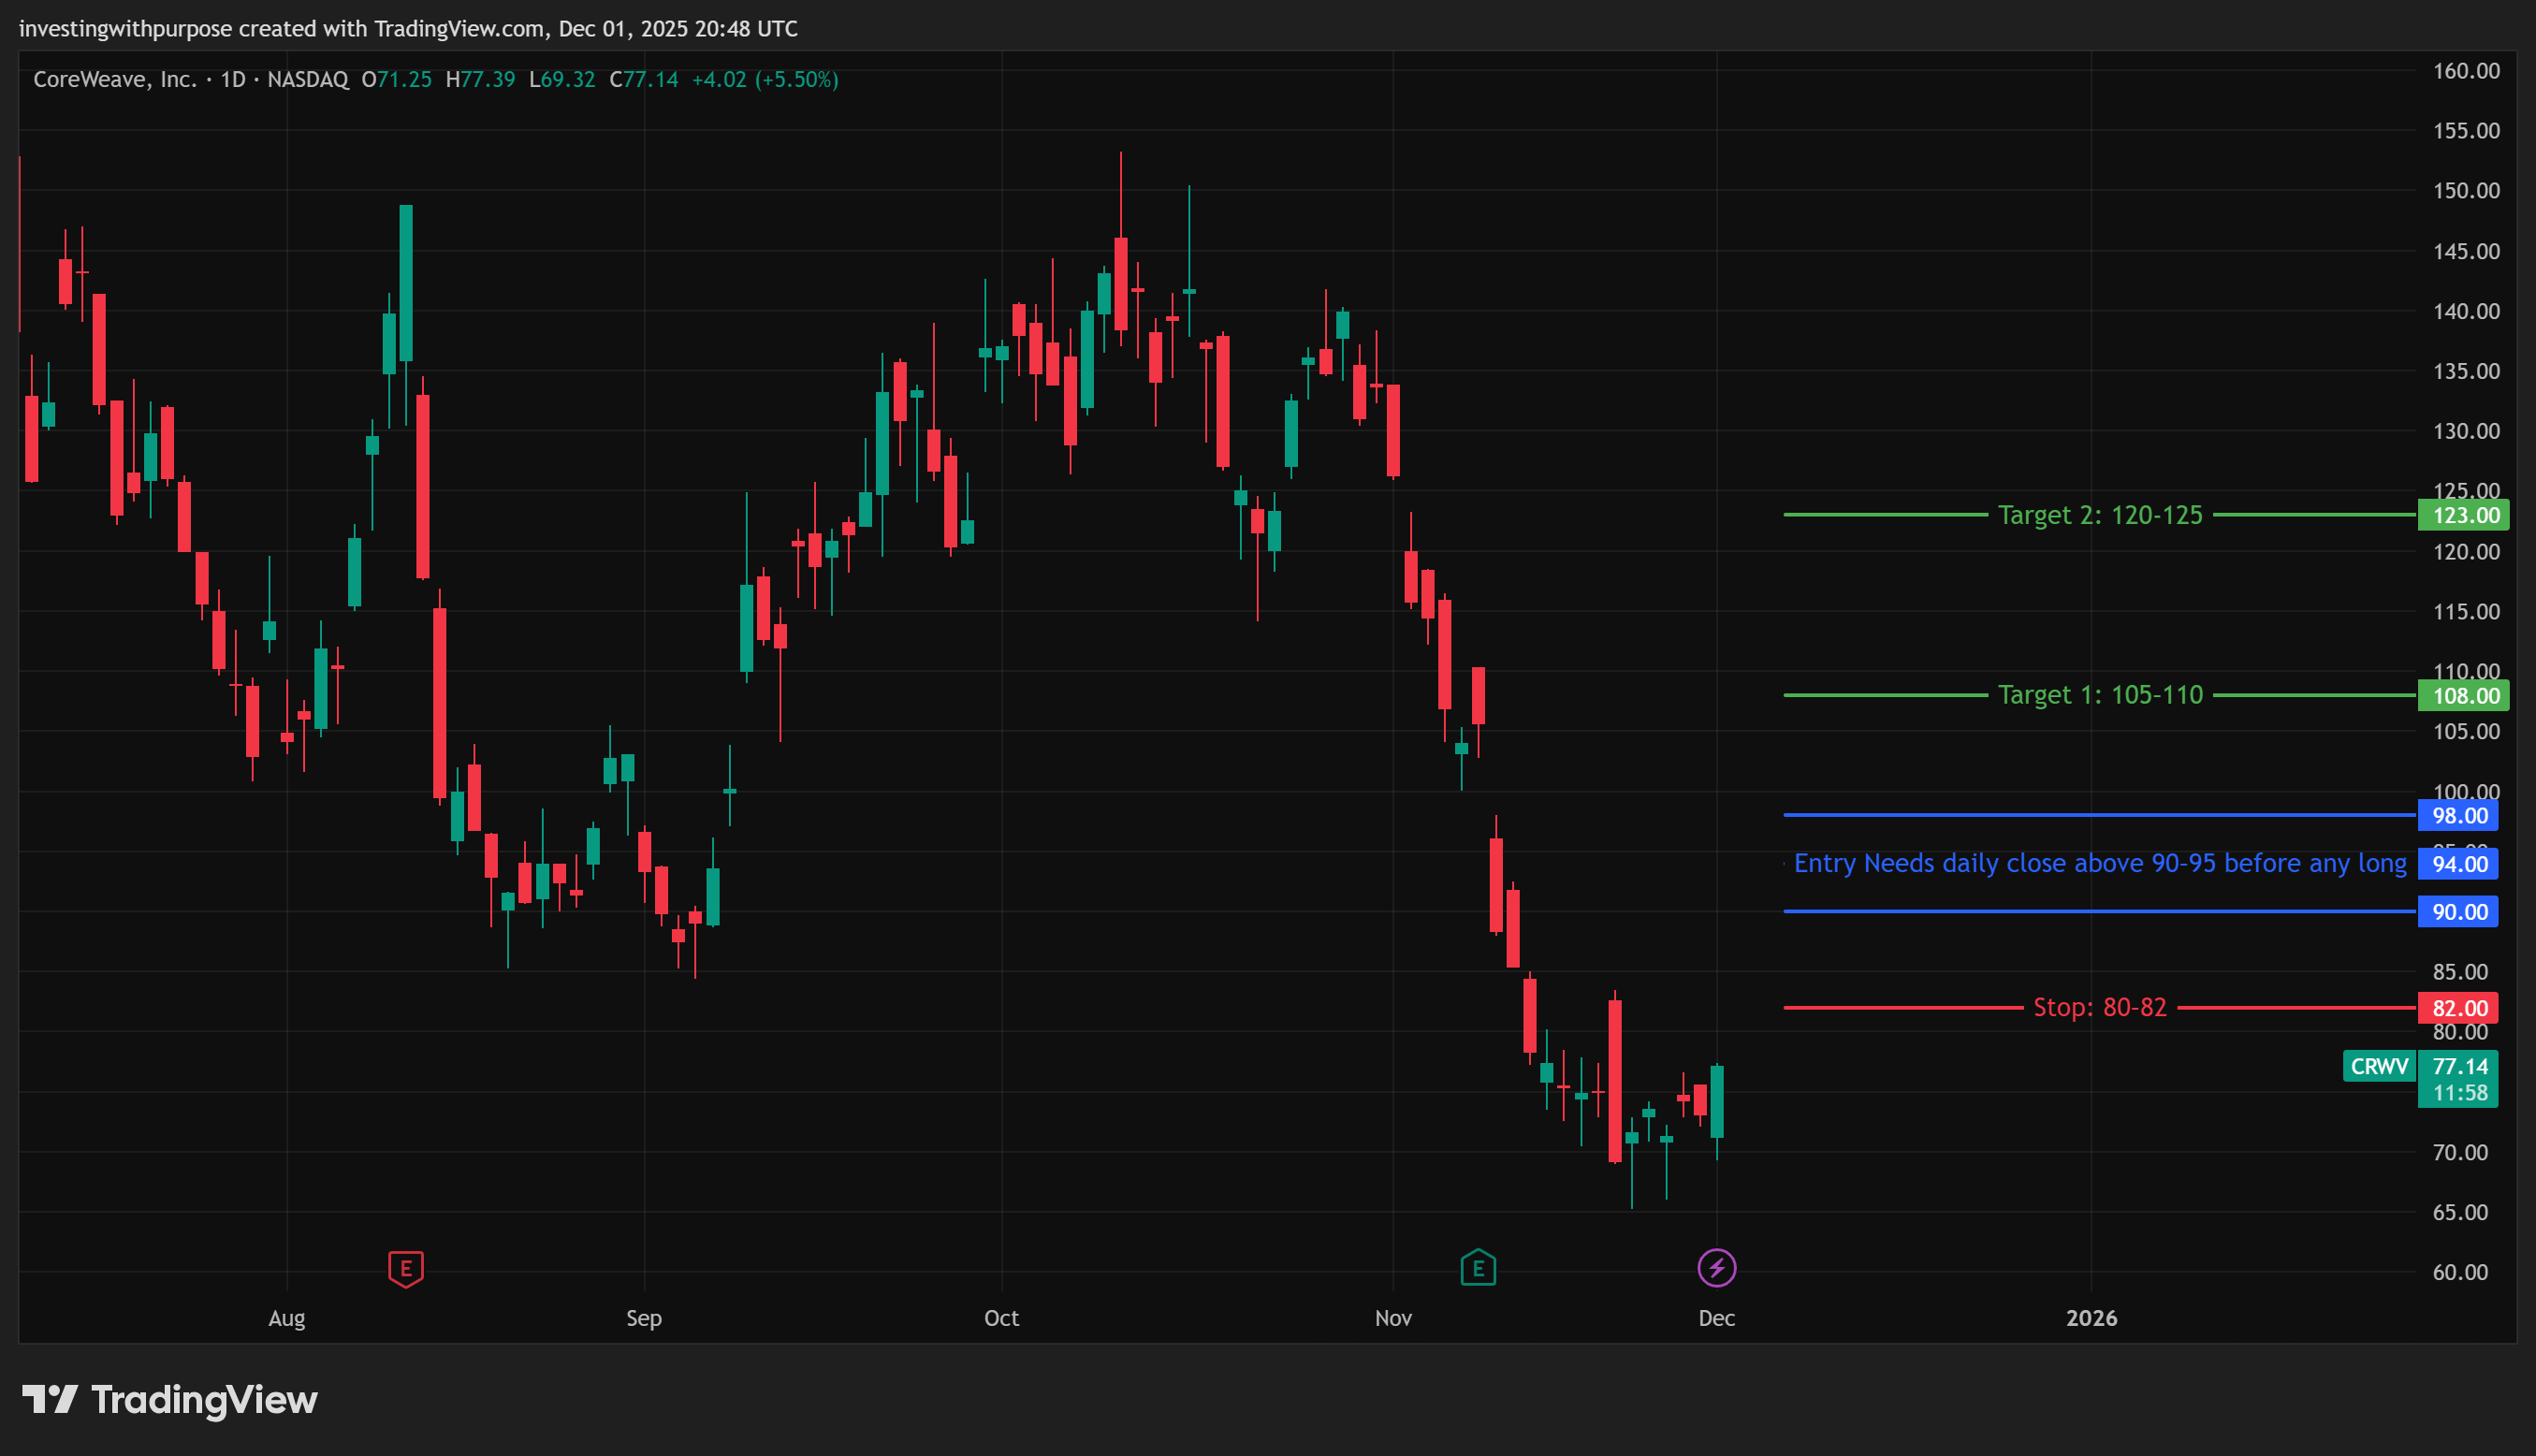
2. Deep Speculative Swing (tiny size only)
Entry: 66–72
Stop: 60
Targets:
T1: 83–88
T2: 94–100
Why this works: It’s the structural low zone, but it’s still a downtrend. High reward, high stress.
When NOT to touch CRWV
If you’re a trend investor: it’s still bearish.
If price loses 65, the next stop can be the 40s.
If you need clean fundamentals: leverage + interest + execution risk = messy.
Bottom line
Nebius and CoreWeave sit at the heart of the AI infrastructure build out. The demand signal is real, the contracts are real and the growth is real. They are not meme stocks.
They are also:
Capital hungry.
Exposed to a small number of huge customers.
Dependent on smooth execution of very complex engineering projects.
Sensitive to what happens to the cost and availability of debt and equity.
On the charts, NBIS looks like a bull that just got punched in the face and is trying to get up again. CRWV looks more like a leader that overextended, broke trend and is now deciding whether it is a temporary reset or something more structural.
If you choose to play here, do it with eyes wide open: small sizes, clear invalidation levels, and a willingness to admit if the thesis is broken rather than “waiting for it to come back”.
If you look at the leverage, capex and sensitivity to a handful of counterparties and think “this is just not my game”, that is not cowardice. That is discipline. There are many easier ways to express a long term view on AI than owning two of the most aggressive infrastructure bets in the market.
Your edge here is not predicting which press release comes next. It is knowing how much risk you actually want to live with.
This content is for educational purposes only and isn’t investment advice or a recommendation to buy or sell any security.