
Netflix Is Entering Its Most Important Year Since Streaming Won
Ads are scaling fast, margins are rising, but the Warner deal makes execution and balance-sheet discipline the new catalysts.

Netflix NFLX 0.00%↑ reported a fundamentally strong Q4 and FY 2025, but the stock sold off in the immediate aftermath as investors focused less on backward-looking execution and more on a deceleration implied in 2026 guidance. While revenue, operating income, and free cash flow all exceeded internal targets in 2025, management’s 2026 outlook signaled slower growth and rising capital complexity tied to the Warner Bros. Discovery acquisition.
The pullback reflects a transition point for the stock. Netflix is evolving from a high-multiple growth compounder into a capital-intensive media platform with meaningful leverage, acquisition risk, and integration execution ahead. The market is now recalibrating what multiple it is willing to pay for that profile, even as underlying fundamentals remain strong.
Key Takeaways
NFLX 0.00%↑’s trend is broken, but the post-earnings selloff has pushed the stock into oversold territory where short-term rebounds can occur—even as the broader structure remains damaged.
The market is repricing Netflix from a “pure compounder” to a compounder with leverage and integration risk, making 2026 execution—not headlines—the key determinant of multiple support.
Fundamentals remain strong. 2025 delivered ~16% revenue growth, ~26% net income growth, and ~37% free cash flow growth, with 2026 FCF guided near $11B.
The Warner Bros. all-cash deal introduces a new variable: balance sheet discipline and integration execution now matter as much as subscriber and advertising momentum.
Price structure is well-defined: support at $82–$80, resistance at $86–$90, and $92 as the line between “broken” and “repairing.”
The best move right now is patience. Opportunities exist for tactical, defined-risk positioning, but the setup favors waiting for confirmation, not rushing into long-term exposure.
The post-earnings drop was not about Q4 execution. It was about whether Netflix’s next phase justifies a premium multiple with higher balance sheet risk.
Company Overview
Netflix operates the largest global paid streaming platform, with over 325 million paid memberships across UCAN, EMEA, LATAM, and APAC. The company monetizes through subscription pricing tiers and a rapidly scaling advertising business, with content spend and amortization forming the core cost structure.
What differentiates Netflix at this stage of maturity is operating leverage. Content investment has become more predictable, pricing power is established across regions, and incremental revenue increasingly converts into operating income and free cash flow. This has shifted Netflix from a reinvestment-driven model toward a cash-generative one.
The proposed acquisition of Warner Bros. Discovery would fundamentally reshape the business. Netflix would gain direct ownership of one of the deepest film and television IP libraries globally, internal studio capacity, and the HBO brand ecosystem. Strategically, this compresses the content supply chain and increases long-term margin control, but it also reintroduces balance sheet risk that Netflix has spent years reducing.
Netflix’s core business is structurally stronger than at any point in its history, but the Warner Bros. transaction meaningfully raises the stakes on capital allocation discipline.
Major News / Pipeline
Q4 2025 Earnings and 2026 Outlook
Netflix closed 2025 with revenue of $45.2B, up 16% year over year, and operating margin expansion to 29.5%, up roughly 300 basis points. Q4 revenue grew 18% YoY, while operating income rose 30% YoY, reflecting continued operating leverage and pricing strength.
For 2026, management guided:
Revenue of $50.7B–$51.7B, implying 12%–14% YoY growth
Operating margin of 31.5%, including ~$275M of acquisition-related costs
Advertising revenue expected to roughly double year over year
While still healthy, this guidance represents a clear slowdown from 2025 growth rates, which the market interpreted as the start of a normalization phase rather than a temporary pause.
Advertising Business Inflection
Advertising revenue surpassed $1.5B in 2025, up more than 2.5x YoY, and is now large enough to matter to consolidated margins. Ads improve monetization per user without proportionally increasing content spend, making this segment structurally accretive over time.
Warner Bros. Discovery All-Cash Acquisition
Netflix amended its merger agreement to an all-cash transaction valued at $27.75 per WBD share, accelerating the shareholder vote timeline and removing equity dilution. To support the transaction, Netflix has secured $42.2B in aggregate senior unsecured bridge facility commitments, with plans to term out the financing via bond issuance and accumulated cash before closing. The transaction is expected to close within 12–18 months, subject to regulatory and shareholder approvals.
Capital Allocation Shift
Share repurchases are paused to preserve liquidity ahead of closing. Management reiterated its commitment to maintaining an investment-grade credit profile, signaling a desire to de-risk leverage post-transaction rather than aggressively re-lever the balance sheet.
Netflix is deliberately prioritizing strategic control and long-term content ownership over near-term financial simplicity, a choice that introduces volatility into the equity narrative.
Fundamental Analysis
Revenue Growth
Netflix has re-accelerated top-line growth into the mid-teens while expanding operating margins. Revenue grew 16% in 2025, and 2026 guidance implies continued double-digit growth despite FX headwinds and acquisition drag. Operating income has compounded faster than revenue, reflecting improved cost discipline and content efficiency.
2024 revenue: $39.0B
2025 revenue: $45.2B
YoY growth: ~16%
2026 guidance implies a step down to 12%–14% growth
This confirms Netflix has exited its hyper-growth phase but remains a double-digit grower at scale, a rare profile in global media.
Net Income Growth
2024 net income: $8.7B
2025 net income: $11.0B
YoY growth: ~26%
Earnings growth outpaced revenue growth, driven by operating leverage and controlled expense growth, reinforcing margin durability.
Free Cash Flow Expansion
Free cash flow reached approximately $9.5B in 2025 and is guided to roughly $11B in 2026, assuming a content cash spend to amortization ratio of ~1.1x. This is a critical inflection point. Netflix is now structurally free-cash-flow positive even while scaling content, ads, and live programming. This cash flow underwrites both shareholder returns and strategic M&A.
2024 free cash flow: $6.9B
2025 free cash flow: $9.5B
YoY growth: ~37%
2026 FCF guidance: ~$11B, implying ~16% growth
Free cash flow quality is improving materially. Management expects a cash content spend to amortization ratio of ~1.1x, signaling disciplined reinvestment rather than renewed cash burn.
Profitability and Margins
Operating margin expanded to 29.5% in 2025 and is guided to 31.5% in 2026. Importantly, this includes higher content amortization and acquisition-related expenses. EBITDA reached nearly $29B on a TTM basis, reinforcing Netflix’s transition into a high-margin cash generator rather than a reinvestment-heavy growth platform.
EBITDA (TTM): ~$29B
Operating margin trajectory: 26.7% (2024) → 29.5% (2025) → 31.5% (2026E)
Margins are expanding even as Netflix invests in ads, live content, and integration planning, underscoring structural efficiency.
Balance Sheet and Leverage
Year-end cash: ~$9B
Gross debt: ~$14.5B
Net debt remains modest pre-transaction, but contingent leverage increases significantly with the WBD 0.00%↑ acquisition bridge financing
While leverage is manageable relative to EBITDA, execution risk rises meaningfully during the 12–18 month integration window.
Valuation Context
Netflix trades at a premium forward P/E and EV/EBITDA relative to traditional media peers, but in line with large-cap platform businesses. Unlike peers, Netflix combines double-digit revenue growth, expanding margins, and strong free cash flow visibility. The valuation premium is increasingly supported by fundamentals rather than narrative.
NFLX 0.00%↑ trades at a forward P/E of ~36.8x, representing a premium to large-cap platform peers like AAPL 0.00%↑ (~31x) and AMZN 0.00%↑ (~33x), reflecting higher near-term earnings growth but also embedding elevated execution expectations.
On EV/EBITDA, NFLX sits around ~31x, materially above AMZN (~18x) and AAPL (~25x), signaling that the market is pricing Netflix as a structurally higher-margin content platform rather than a traditional media business.
Price-to-sales of ~9.2x places Netflix at the high end of the large-cap peer group, above Amazon (~3.6x) and Apple (~8.7x), consistent with Netflix’s superior revenue growth but leaving less margin for error if growth decelerates.
Price-to-book of ~15.4x remains elevated due to negative tangible equity and heavy content capitalization, limiting its usefulness as a valuation anchor and reinforcing that Netflix is valued primarily on cash flow and earnings power.
Relative to other premium entertainment assets like EA 0.00%↑, Netflix trades at a lower P/E but similar EV/EBITDA, suggesting the market views Netflix as a scaled IP platform rather than a cyclical content producer.
The valuation premium compresses quickly if 2026 growth undershoots guidance, making forward execution and integration discipline critical to defending current multiples. However, that premium becomes more sensitive to guidance missteps and capital structure changes, which explains the post-earnings volatility.
Fundamental conclusion: Netflix’s fundamentals remain strong and internally consistent, but the stock is now priced on forward execution and balance sheet outcomes rather than historical growth alone.
Technical Analysis
Weekly Chart: trend damage is real, a decision zone is coming
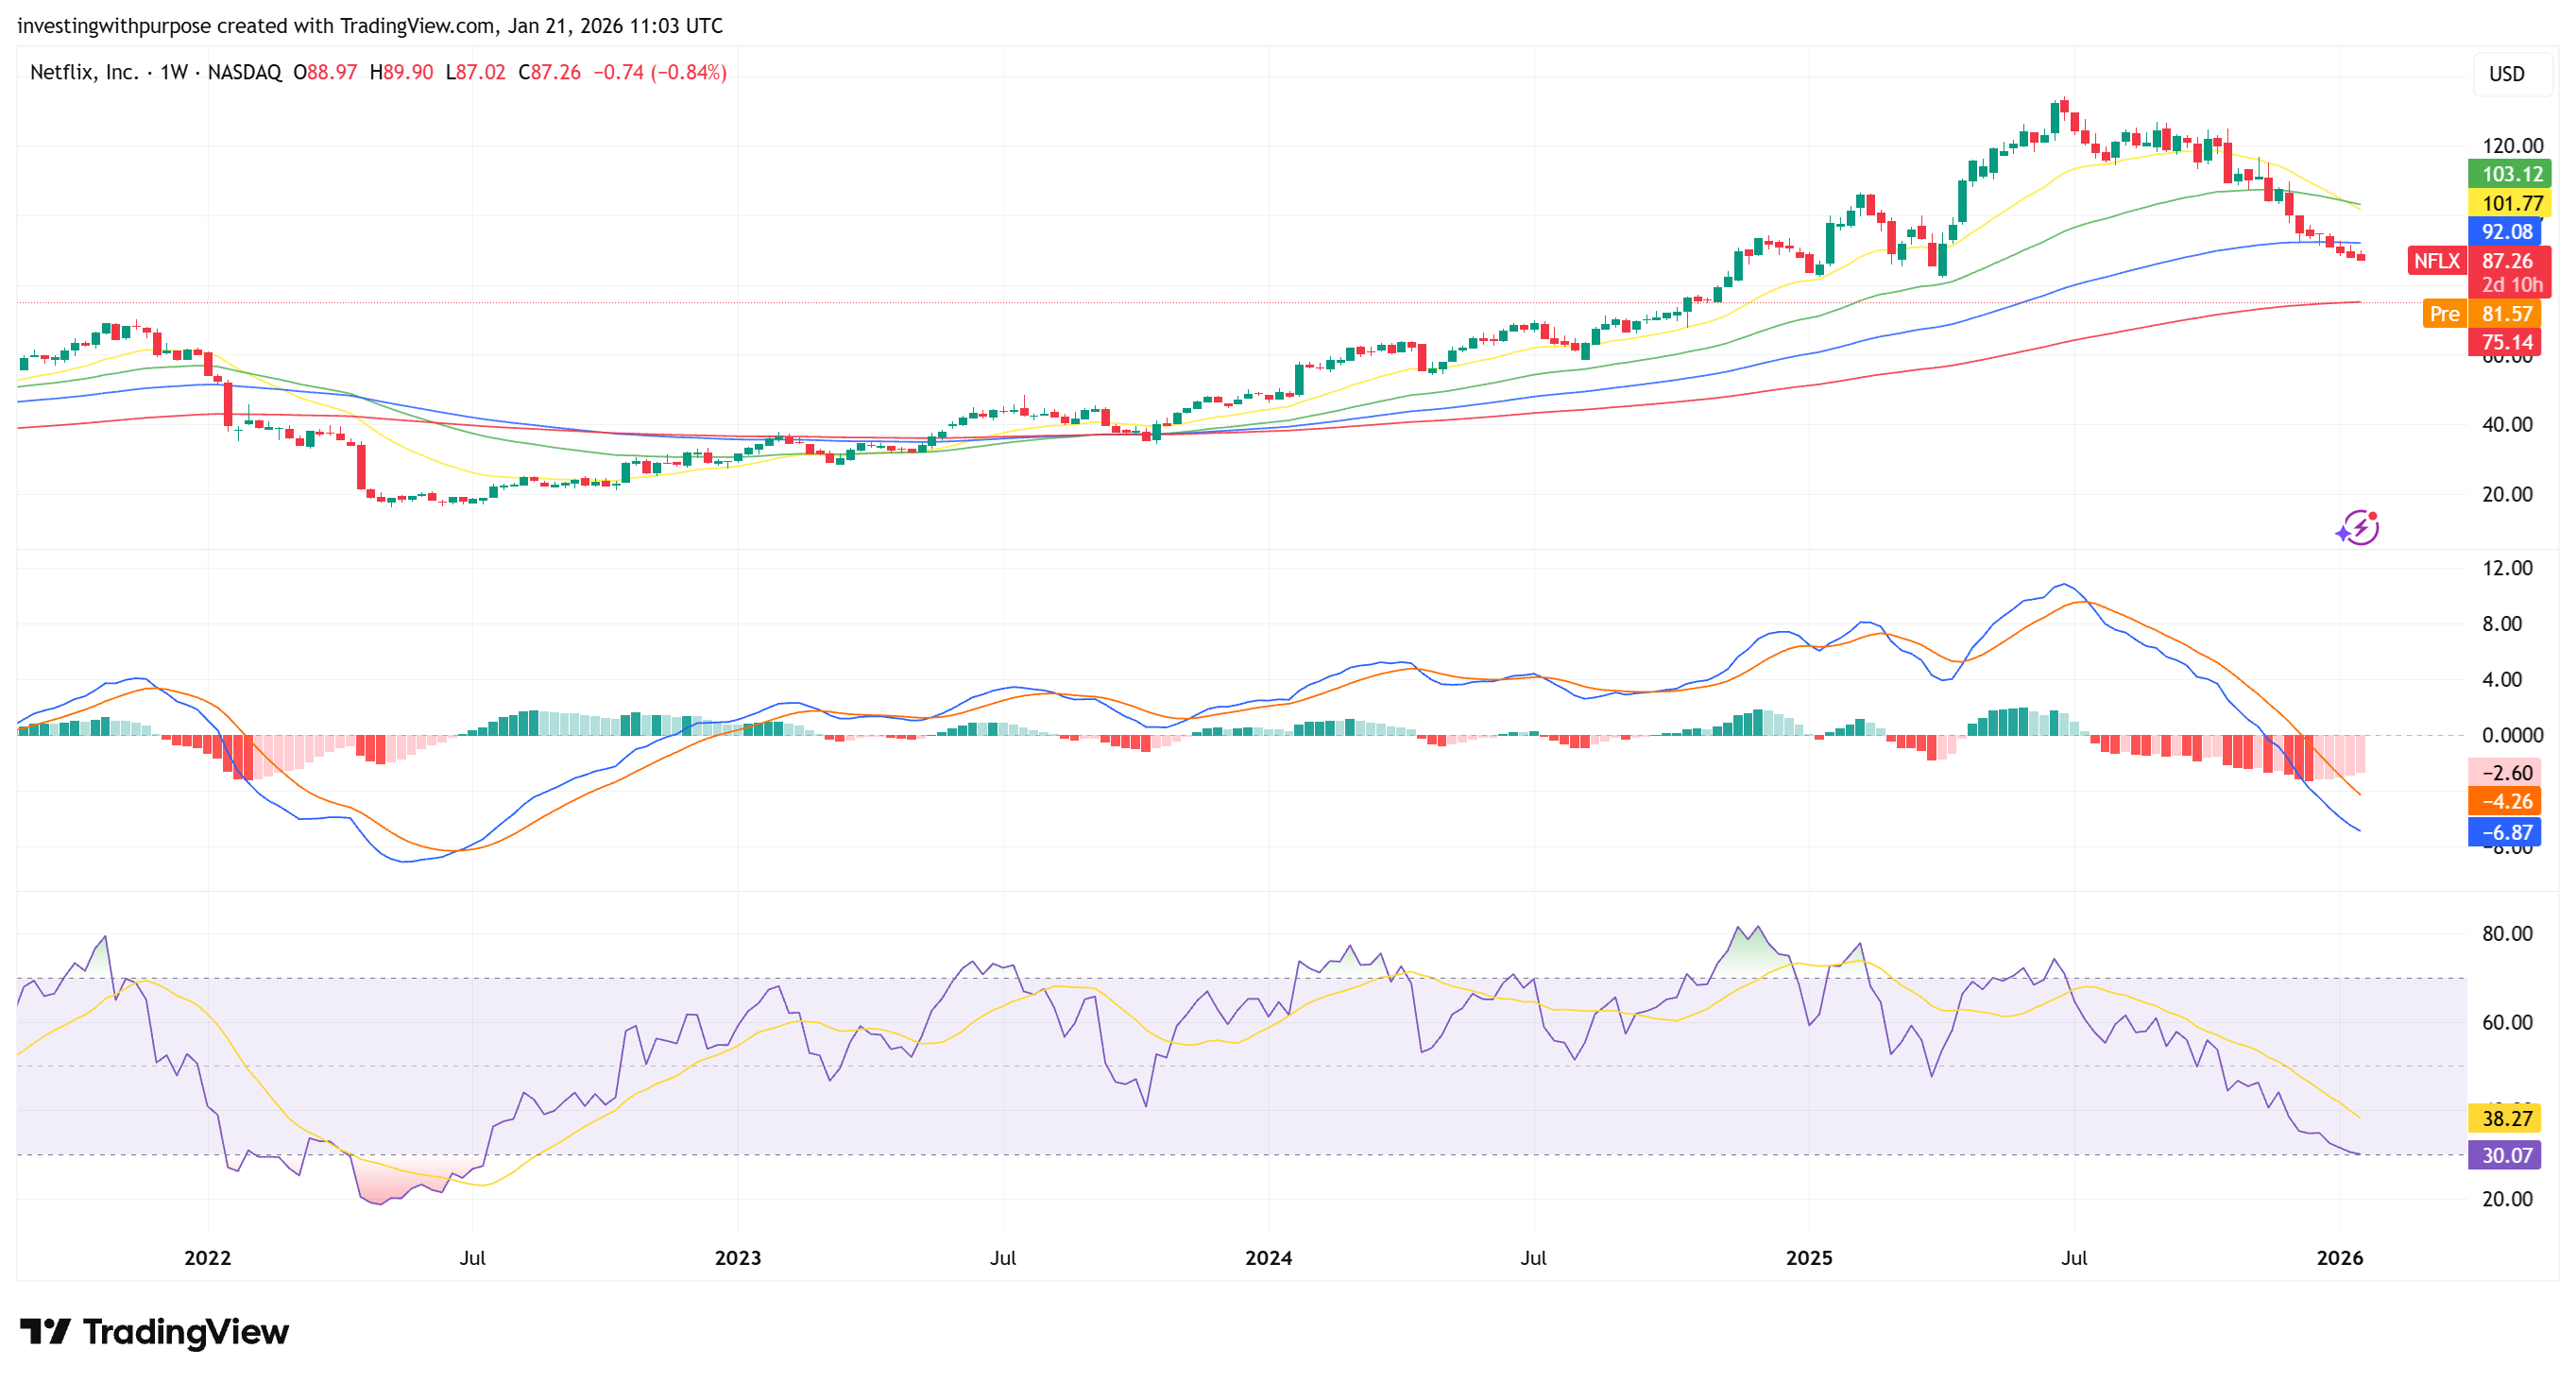
NFLX 0.00%↑ is in a confirmed weekly downtrend. The stock has rolled over from its 2025 peak and is now trading below the weekly EMA 20/50/100, which tells you the intermediate trend has flipped from buy dips to sell rallies.
Ichimoku is reinforcing the same message:
Price is below the cloud, with the cloud overhead acting as supply.
Mean reversion is not one good day, but a multi-week repair job.
You don’t need to overcomplicate it: the stock is trending lower under layered resistance.
Key weekly levels:
Major resistance zone: ~$92–$93 (weekly EMA100 + prior breakdown area)
Next resistance zone: ~$98–$103 (Ichimoku/EMA cluster overhead)
Current support zone: mid/high-$80s (where price is chopping now)
Line-in-the-sand support: ~$75 (weekly EMA200 ~ $75.14). If this gets tested, it likely comes with a macro or deal-driven stress event.
Momentum:
Weekly MACD is bearish and widening, consistent with a trend phase, not a “quick shakeout.”
Weekly RSI is ~$30, which is oversold-ish but not a buy signal by itself. In downtrends, RSI can live under $40 longer than people expect.
Weekly bias: Bearish-to-neutral (trend bearish, but nearing an area where sellers can start to exhaust).
Weekly conclusion: The bigger trend is still pointing down. The only “bullish” argument on weekly is that price is getting stretched enough to trigger a tradable mean reversion if the stock can stop making new lows.
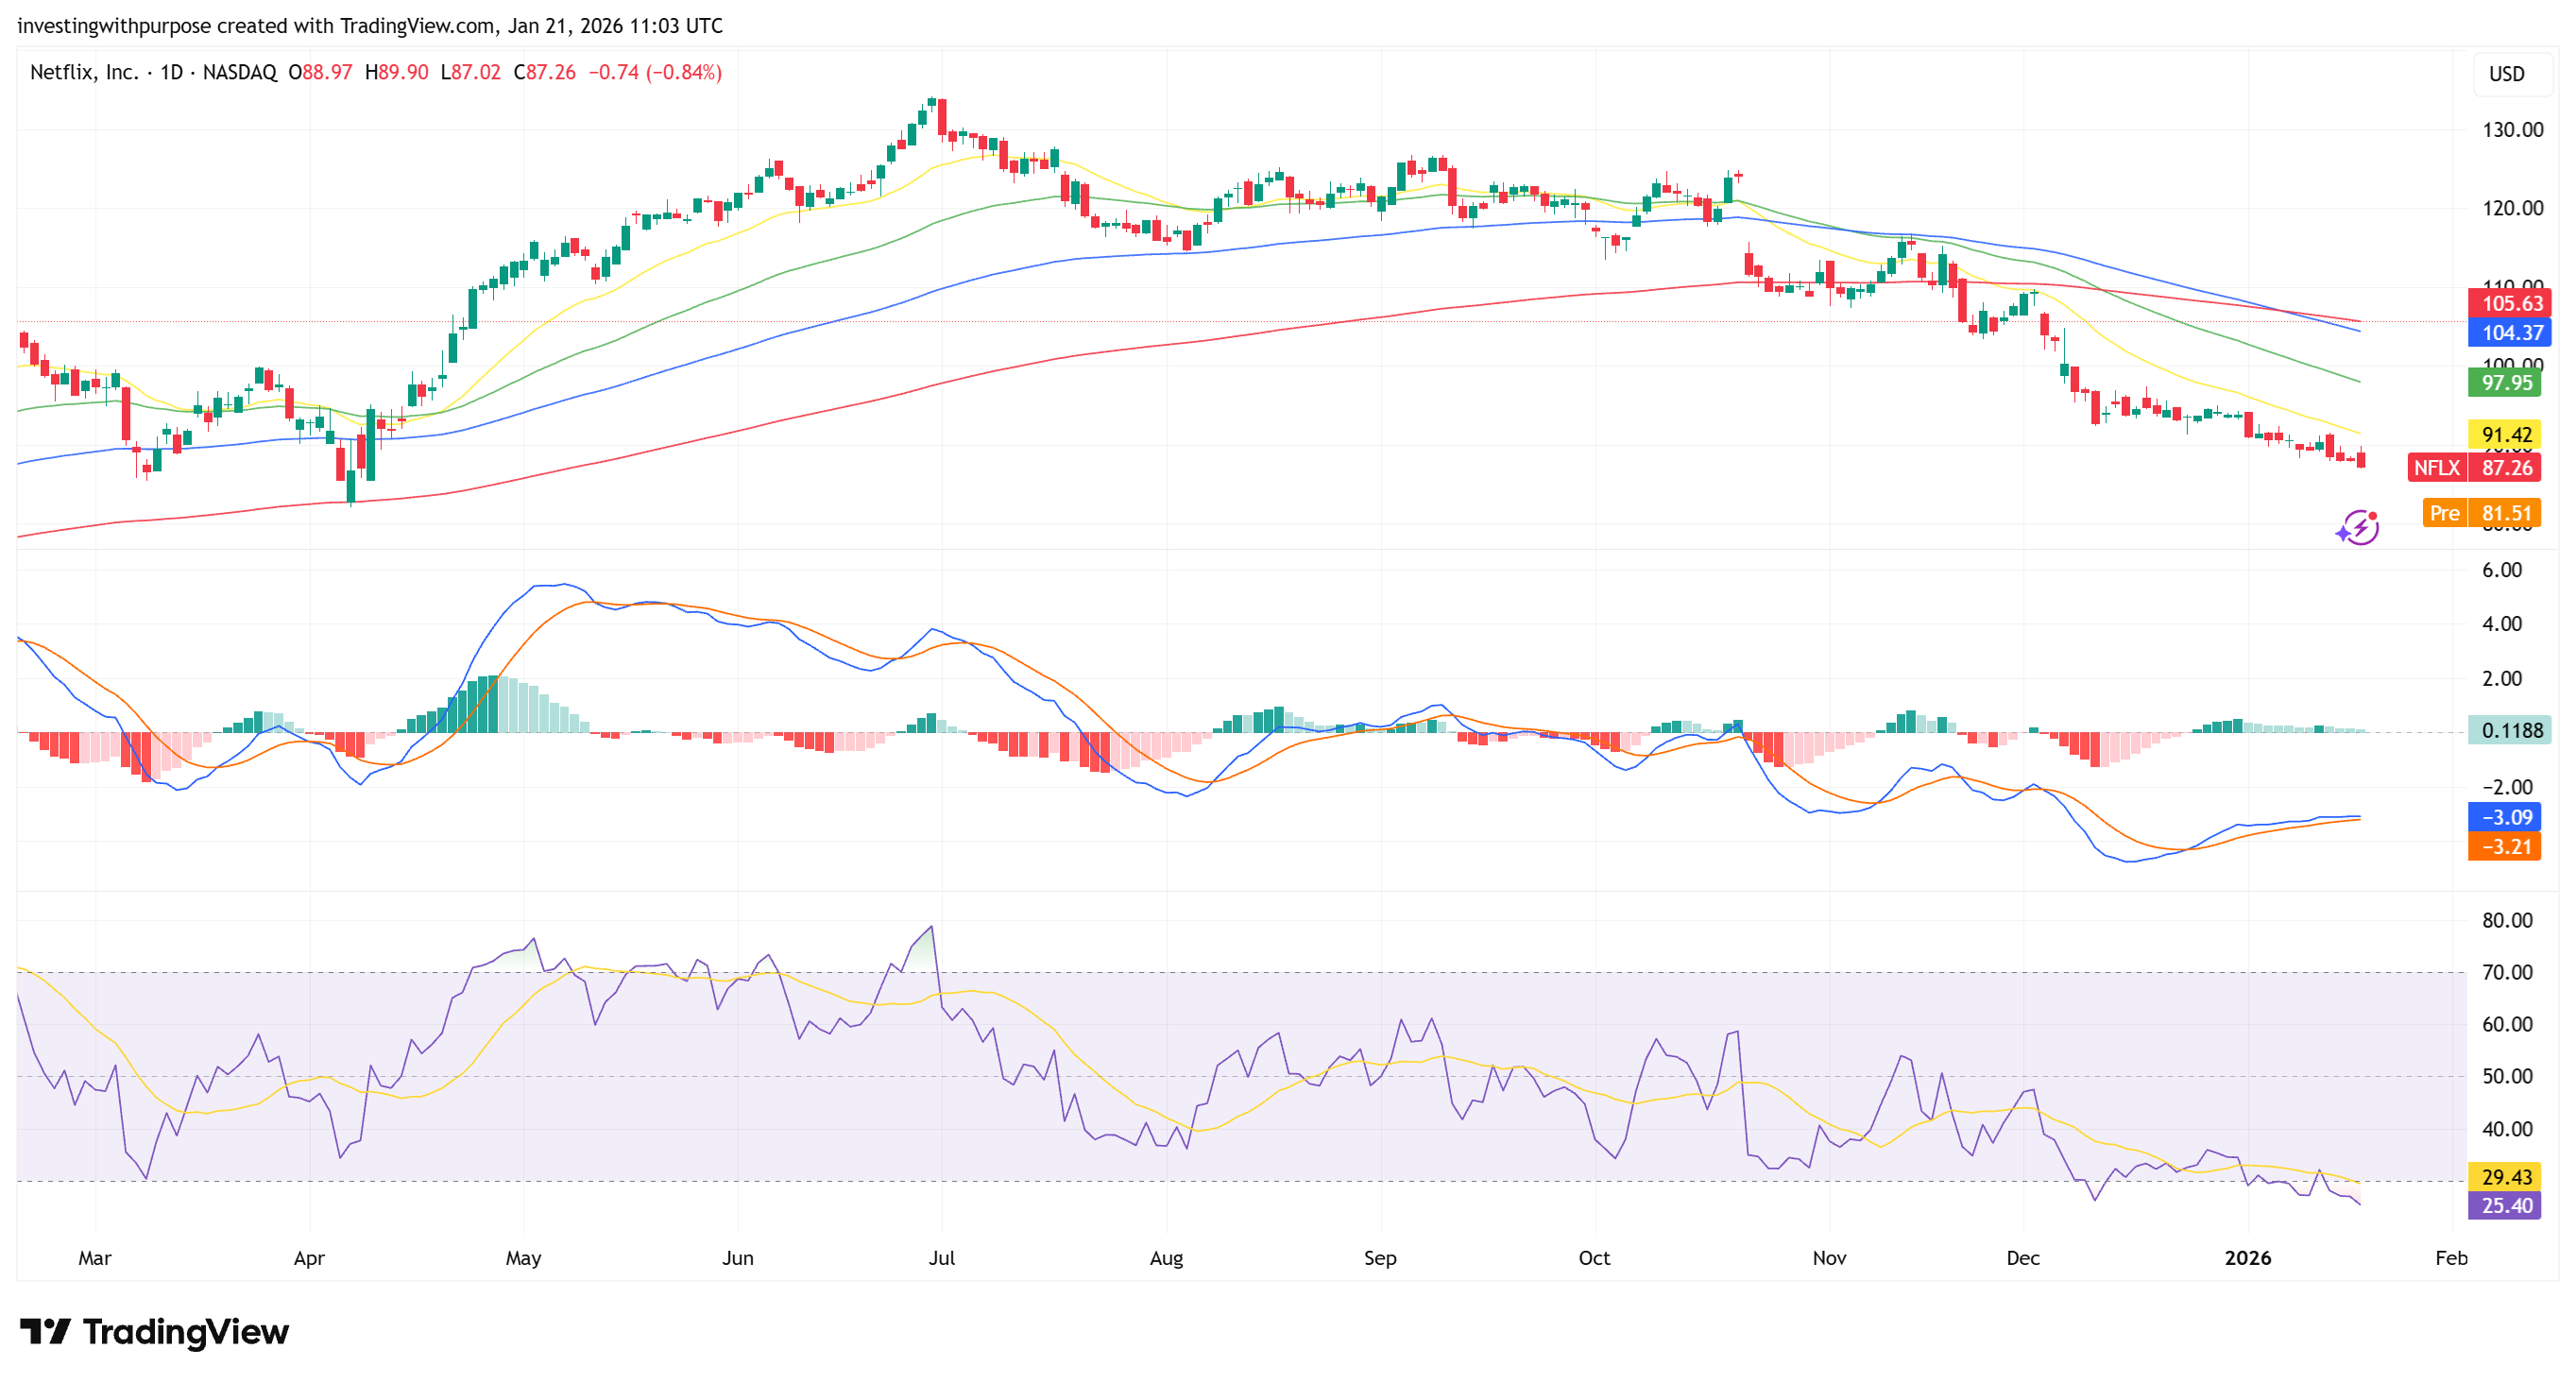
Daily Chart: breakdown confirmed, oversold conditions
Daily structure is cleaner: NFLX 0.00%↑ has been walking down and then broke hard post-earnings. The selloff shoved price below the all daily moving average.
Daily momentum:
Daily RSI is deeply oversold (mid-$20s). This is the best technical argument for a bounce attempt, not for a trend reversal.
Daily MACD is still bearish, but starting to see the conditions where bearish momentum can decelerate
Key daily levels:
Immediate support: ~$82–$83 (post-gap stabilization zone)
Next support: ~$80 (psychological + round-number magnet)
First resistance: ~$85.5–$86.5 (near-term reversion + intraday supply)
Major resistance: ~$88.5–$90 (1H/2H averages + Ichimoku supply)
Hard ceiling: ~$92 (daily/weekly trend pivot)
Daily bias: Bearish (trend), with rising odds of a reflex bounce due to oversold conditions.
Daily conclusion: The daily chart is “broken,” but the stock is stretched enough to produce a controlled bounce. The tradeable question is whether that bounce dies into $86–$90, or whether the stock can reclaim $92 and start repairing the trend.
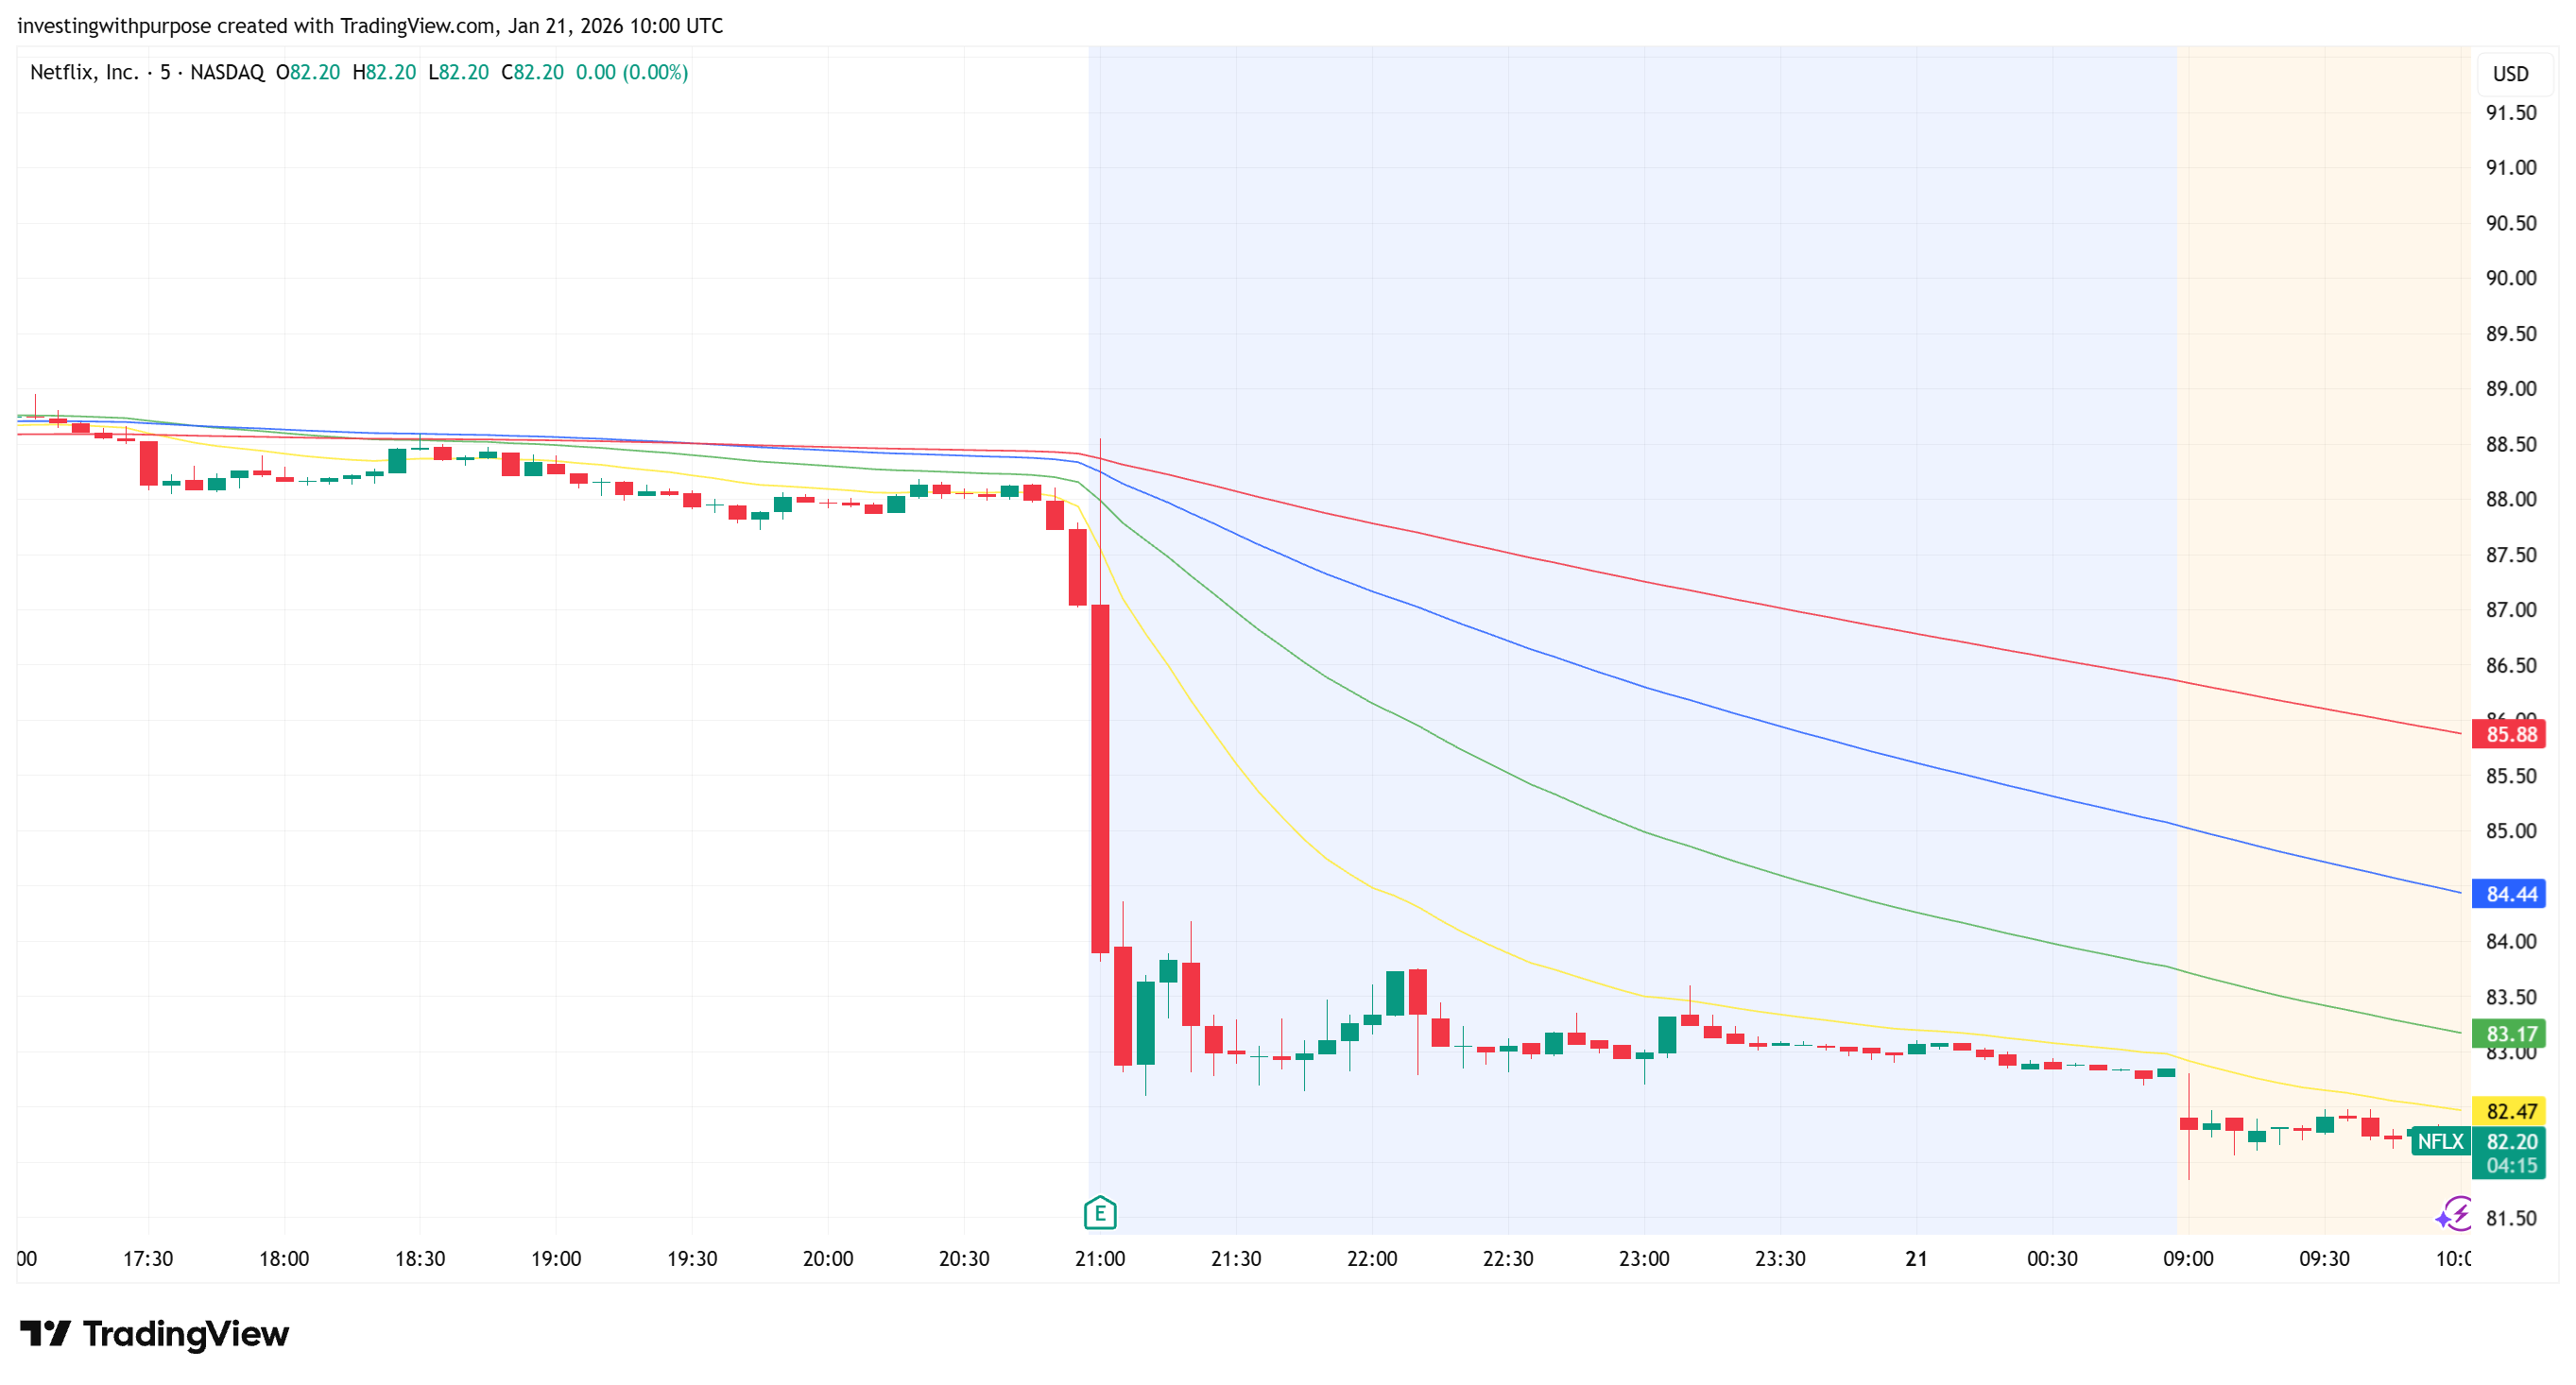
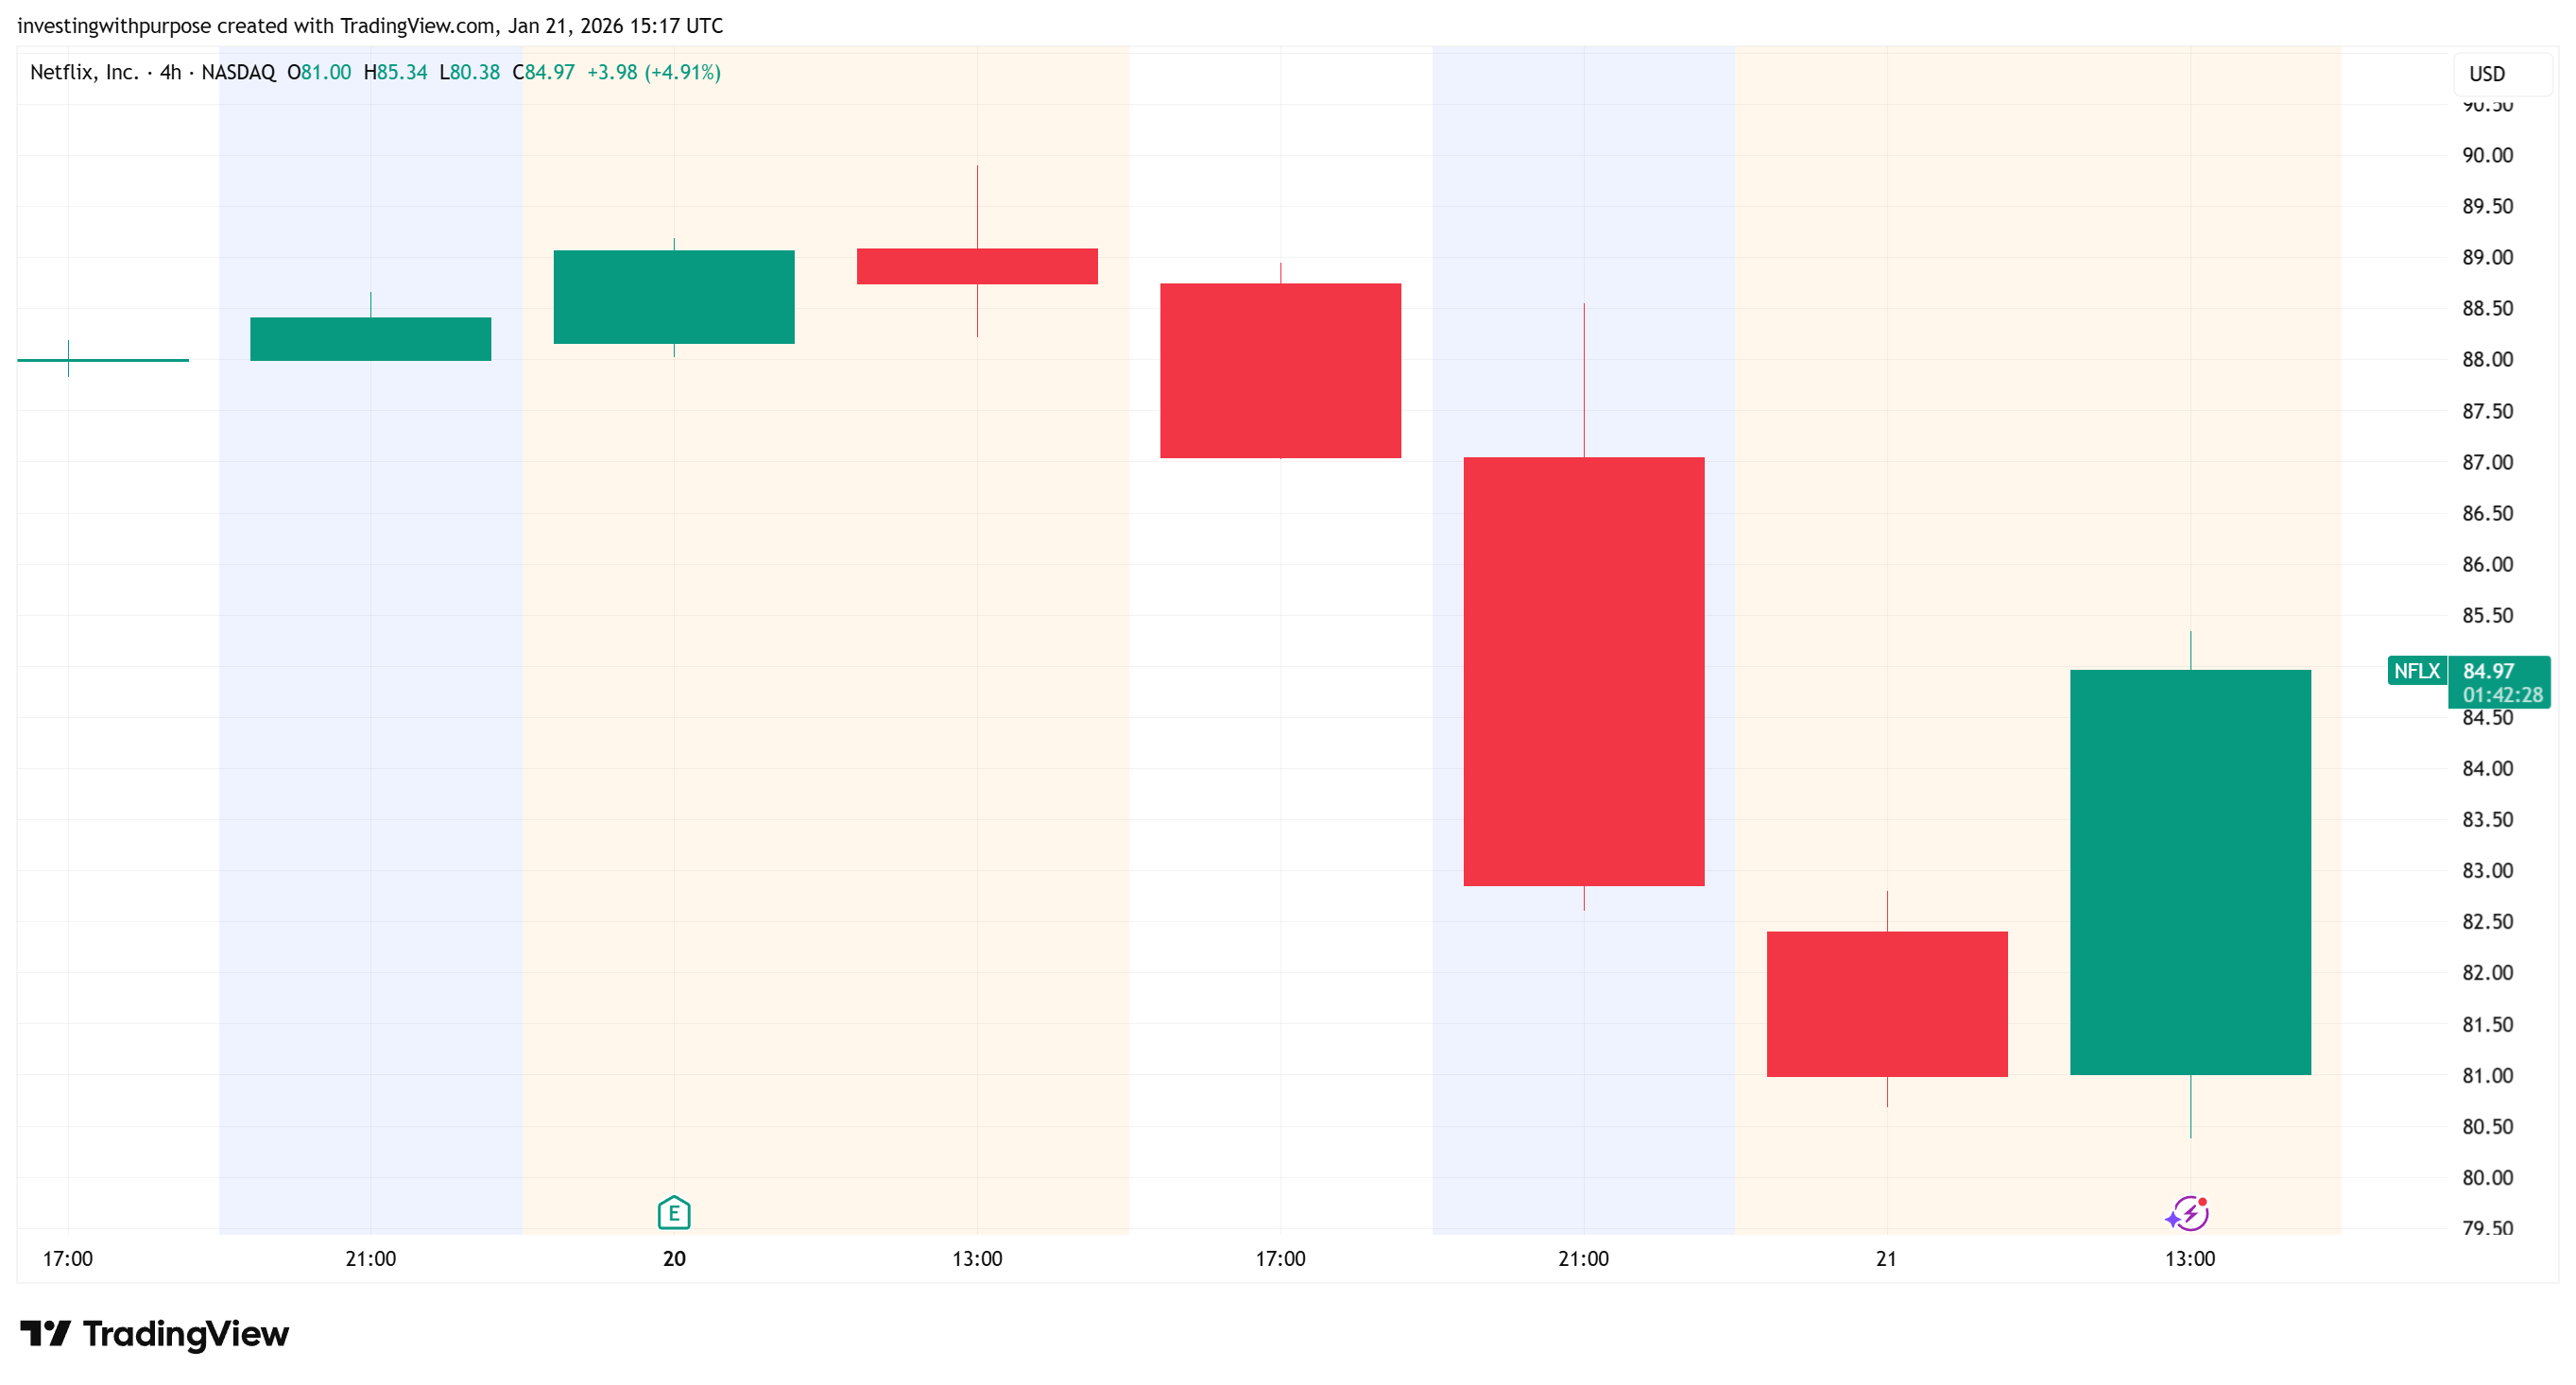
Last 24 Hours: Post-Earnings Breakdown (1H View)
Earnings triggered a sharp after-hours selloff, with price slicing cleanly below the 1H EMA 20 and 50.
Crucially, there was no reclaim attempt—the fast averages rolled over immediately, confirming this was repricing, not a knee-jerk move.
In pre-market, price continued lower, showing the selloff was accepted before the cash open.
The stock opened and traded below all key 1H moving averages, with the EMA 100–200 (high-$80s) acting as firm overhead resistance.
Since then, price has stabilized around the low-$82s, but every bounce has stalled below the EMA cluster.
(See after-hours and pre-market chart below)
Today’s session matters. After the post-earnings flush, NFLX 0.00%↑ defended the $80–$82 zone during regular trading and printed a strong green daily candle, reclaiming ground lost in the after-hours move.
This is a reflexive bounce, not trend repair. The candle confirms buyers are present at demand, but price remains well below declining daily moving averages, meaning supply is still overhead.
Key signal: the market is accepting prices above the post-earnings low, which reduces immediate downside tail risk, but has not reclaimed control.
Structure remains damaged. Even with today’s bounce, the stock is still below prior support-turned-resistance and inside a lower-high / lower-low regime on daily and weekly timeframes.
Interpretation: this is exactly what you expect after a violent earnings repricing. Stabilization first, decision later.
(See after market open reaction below)
The market accepted lower prices after earnings. As long as Netflix, Inc. stays below the 1H EMA 50–100 (~$85–$88), any upside is only a tactical bounce, not a trend reversal.
Technical conclusion: Across timeframes, the message is consistent: NFLX 0.00%↑ is in a downtrend, and the earnings reaction accelerated the move into an oversold condition. That combination often produces a bounce, but trend rules still apply. The levels that matter are clean: support is ~$82–$80, and resistance is ~$86–$90, with $92 as the higher-timeframe trend repair pivot. Until NFLX reclaims and holds those resistance bands, rallies are more likely to be sold than chased.
Trade Plan
Given the shift in narrative toward execution and balance-sheet management, the best default stance is patience. The stock is repricing real risks tied to leverage, integration, and capital discipline.
That said, the post-earnings selloff has pushed NFLX 0.00%↑ into an oversold zone where tactical, defined-risk positioning can make sense, without committing to a long-term view.
Oversold mean-reversion bounce following a sharp post-earnings repricing.
Position bias: Tactical long only
Entry
Buy zone: $81.5–$83
Optional add: $80–$81, only if price stabilizes
Risk Management
Stop: Below $79.50 daily close
A sustained break below $80 signals the base failed and downside risk increases.
Upside Targets
Target 1: $85.50–$86.50 (first resistance)
Target 2: $88.50–$90.00 (heavy supply zone)
Stretch target: $92, only if price holds above $90 and momentum improves
Execution Rules
Trim into $85–$86 if momentum slows.
Exit if $80 breaks sustainably. No averaging, no thesis rescue.
This is not a conviction long. It’s a controlled bounce trade in a stock that has already repriced risk. Patience remains the edge, but oversold conditions create room for tactical upside with capped downside.
Bottom Line
Netflix is still a structurally high-quality business, and the fundamentals continue to justify a premium profile versus legacy media. The problem is timing and trust. The post-earnings selloff broke the trend and shifted the stock into a market-defined “prove it” phase where leverage, integration complexity, and guidance credibility will dominate sentiment. From here, the clean approach is tactical: treat $82–$80 as the critical demand zone, respect $86–$90 as supply, and only upgrade the thesis if $NFLX can reclaim $92 and start rebuilding its trend.
This content is for informational and educational purposes only and reflects our views at the time of writing. It is not investment advice, a recommendation, or an offer to buy or sell any security. All investments involve risk, and prices can move against you. Past performance does not guarantee future results.
I better buy crypto then watch Netflix